Category: Transportation

  • FAQ on Phase-by-Phase: Unbundling MnDOT’s Winning Virtual Public Engagement Strategy

    FAQ on Phase-by-Phase: Unbundling MnDOT’s Winning Virtual Public Engagement Strategy

    For our April webinar, we were thrilled to be joined by the experts behind the Minnesota Department of Transportation’s successful public engagement project. Stephanie Castellanos, Public Engagement Officer from MnDOT and Hannah Johnson, Professional Transportation Planner, Alliant Engineering, share insights from their Hwy 25 – Buffalo to Monticello Corridor Study and guide us step-by-step through their public involvement process.  

    The on-demand session recording of Phase-by-Phase: Unbundling MnDOT’s Winning Virtual Public Engagement Strategy is available now (for free!) if you want to learn the specific tools and techniques they utilized to develop their public engagement plan, which raised barriers to participation and reached a diverse audience. Dave Biggs, our Chief Engagement Officer here at MetroQuest, facilitates the event and also shares his top 10 takeaways you can use for your next public engagement project! 

    Scroll below for an inside scoop on the live Q&A session where they answer the top questions from the audience….  


    https://vimeo.com/823188764?share=copy

    [scroll-box]Dave: Would you say there is still value in face-to-face interactions or can you get what you need from virtual alone?

    Stephanie: Yeah, I’ll take a stab at that, Dave. I’ve been thinking about this myself as we move forward into this hybrid world. And like I said, it was really by luck that we had MetroQuest ready to roll when we didn’t know the pandemic was coming. I mean, I can’t imagine how we would have done this Corridor Study without all the online tools that we had and everything.

    But going forward, I do see the value in hybrid. I’m working on a Corridor Study right now. I think especially with agency and community partners, it’s important to have that face-to-face so you can talk and roll out the maps and put, you know, Post-it notes on it and everything, but I will say the quantity of feedback that you can get virtually is amazing when you look at broad demographics and how you really are to reach people and take those 5 minutes of their time, that’s invaluable.

    We never have hundreds and hundreds of people so far that really come to in-person events. But then we had thousands of people that responded to virtual means of interacting with us. I see the value in both, but I really don’t foresee going forward without having some virtual aspect.

    Hannah: I just really want to highlight how I think they are both really important. As Stephanie mentioned, you get a lot of people responding online and and it’s a really good way to reach people who either can’t or don’t want to come to in-person events. But in-person is still really important. And I just had an open house on a different project last week that like 150 people came to.

    And some people stayed for an hour and talked with the project team and just really being able to have those live two-way conversations and pointing at maps, that’s really important and I don’t think that’s going to go away.
    [/scroll-box]


    https://vimeo.com/823188784?share=copy

    [scroll-box]Dave: What kind of things did you do to reach underserved or difficult to reach populations?

    Stephanie: Yeah, that’s one thing I wanted to say. I’m looking forward to getting your transportation equity information, Dave. That’s something we always keep in mind. And I think for us, when we sent out the Facebook ads that were to all of the area within the corridor and then also saw that wide demographic as far as age and other things that we looked at, where people lived, etc., we felt that we did touch base with pretty much all of the groups within the corridor.

    And, you know, that’s something that we talked about at the beginning, too. We always want to be looking at when there’s opportunities to specialize. We have had other studies where we’ve had more underserved populations that we’ve done special outreach for. And, you know, had special community meetings and postcards in other languages and web pages, things like that. So we definitely are always looking at that.

    Hannah: As a part of our business and other stakeholder engagement, we did have some one-on-one conversations with key areas like a hospital on the southern end of the corridor. So talking about how people who visit the hospital use the roadway. And then there is also a mobile home park on the northern end of the corridor. We really wanted to make sure that we were sending mailings to those locations and making sure we heard from them, too.[/scroll-box]

    Check out The Planner’s Guide to Equity in Public Engagement eBook! Our largest peer-to-peer collaborative effort yet, learn the best methods to implementing public engagement that is diverse, inclusive and equitable.


    https://vimeo.com/823188802?share=copy

    [scroll-box]Dave: Were there any issues with asking some of that kind of more sensitive demographic information from people, did it get any pushback? Were people hesitant to answer those questions? What was your kind of reaction to that left?

    Stephanie: I’ve done multiple surveys now with MetroQuest. Usually people answer, I would say over the majority of people do answer those questions, even though we clearly state that it’s, you know, confidential and voluntary. So, yeah, we’ve always gotten pretty good feedback on those questions. So that’s really important for Title six and other reporting. And then overall, looking at the success of our outreach.

    Dave: I mean, there’s so much that you can tell from zip code. Zip code is because specifically when you’re when you’re talking about infrastructure or you’re talking about access, you’re talking about people’s transportation habits.

    And so where people live, where people work, it’s so important to that regardless of their their age or their, you know, their race, these things are are less relevant than where do you live and where do you need to get to? And do we have the infrastructure to support what you need to do?

    [/scroll-box]


    https://vimeo.com/823188819?share=copy

    [scroll-box]

    Dave: Do you think that the broader age distribution was a reflection of the fact that the survey was online?

    This is such an interesting question because five years ago nobody would ask this question because everybody just assumed that the people that were online are all young. And now we’re saying it was the broad age distribution was because it was online. It’s just such a sign of the times.

    Maybe you could make comments between the kind of demographics that you see in your face-to-face compared to the online? And to what extent do you think that the age distribution was how you were engaging?

    Stephanie: Just typically, when we have face-to-face, it’s folks that work and then a lot of people who are elderly just because they have the time, it’s always exciting when we see a younger group at a face-to fac- meeting. But online when we first started doing some stuff, we had concerns about reaching the older or middle-aged audience, and that was really highly represented.

    So we’re glad to see that people are sharing things within the community, talking about it and getting other people. I know that some of our Facebook page or the ad that we had was shared with people within the community. So they were telling word Facebook of so other people could get involved.

    Hannah: I think, you know, we’ve been learning a lot of lessons in the last couple of years. And I think one question that was missing that I have been including or we’ve been including more often is income related questions as well. So, yeah, that isn’t something we saw. But based on the locations, we do believe that we reached a representative group.


    [/scroll-box]


    Our Phase-by-Phase: Unbundling MnDOT’s Winning Public Engagement Strategy webinar is available on-demand! 

     

  • FAQ on The Ultimate Virtual Public Involvement Checklist Webinar

    FAQ on The Ultimate Virtual Public Involvement Checklist Webinar

    Our first webinar of 2023 was a success!  

    Dave Biggs hosted The Ultimate Virtual Public Involvement Checklist webinar to share details on our latest eBook release alongside Emily Margitan, one of the Customer Success Managers here at MetroQuest.  

    MetroQuest partnered with AASHTO, AMPO, TXDOT and COMPASS to compile a list of 101 questions to consider throughout the planning, engagement and reporting phases of every project.  

    In this webinar, we unveil key aspects of our new Checklist for Success and explore how asking the right questions can help your team deliver great virtual public involvement results on every project!  

    Here are a few clips from our live Q&A…  


    https://vimeo.com/796721338

    [scroll-box]Dave: Emily, Our team is new to VPI. What training or support does MetroQuest provide for customers to help them get started?

    Emily: Yeah, that’s a really good question. It’s something I’m quite involved in, in my role. And so, when new companies are onboarded at MetroQuest, we offer virtual training sessions essentially, and we can go through in detail with the software live with the team. Depending on how large the team is, sometimes it’s broken up into a couple of sessions and then we work really closely with those teams.

    So often we might even have typically a kickoff call with senior leadership to really talk about what are their goals, what are they hoping to get out of MetroQuest. And then we do the actual training of the software, a demo, and we go through and often it’s very customized depending on the organization in terms of what they’re looking to get out of MetroQuest.

    And then essentially I’m kind of their primary contact as they get started. I used to work in public engagement and design surveys, and so I love getting to work with teams closely on their surveys they’re working on. And so, you can kind of expect when you’re getting started that we will hold your hand along the way and help you get a sense of the software.

    And then to our support team is fantastic. They are really good at answering questions and a bit of a sneak peek: We have a live chat feature that’s going to be coming up soon! I think our new customers are really going to love that because when you, you know, there’s little things, it’s sometimes writing a whole email out seems really formal, so you can easily quickly pop up the chat and kind of talk to your team in real time.[/scroll-box]


    https://vimeo.com/796806092

    [scroll-box]Dave: What do you think are the biggest barriers to participation? So, maybe I’ll weigh in on this because I’ve got an acronym for this because I’ve been asked this question so many times. My acronym is TACK: Time, Awareness, Connection, and Knowledge. People lack often the time. People are working two or three jobs, you know, their time is of the essence. Public meetings are completely out of the question for a lot of people. So, keeping it short.

    Awareness: they might not even know that this project exists. They might not be connected to the agencies or follow them on Facebook and all that sort of thing. So just awareness raising is so important. Connection means: do they feel like the outcomes of this are going to impact their lives?

    Do they feel connected to it like it’s they’ve got some skin in the game in terms of the outcomes, and then knowledge is do they feel comfortable weighing in? Some people feel like, well, I don’t have any experience with transportation, so I don’t know if my opinions are valid. A lot of people kind of discount their own ability to have a priority about something. And so, giving people the confidence to participate is so important. [/scroll-box]


    https://vimeo.com/796806143

    [scroll-box]Dave: What suggestions do you have regarding hybrid engagement? Hybrid engagement has been the topic of the post-pandemic, if we can call it post-pandemic, period. So very quickly from me… if you’re going to have face-to-face engagement with virtual public engagement, the things to keep in mind are if you’re going to ask questions face-to-face, make sure that they’re the similar or the same questions that you’re asking online so you can actually combine the answers together.

    Oftentimes, with face-to-face engagement, you can go into more detail with people. You can really get the kind of a face-to-face experience and really get more information about the underlying concerns that people have about different options going forward. And so it’s an opportunity to really expand on what you might be hearing in volume online with some more nuance.

    So really take advantage of that discussion time with people to be open to what is it about this that makes you afraid or concerned? What is it about this other option that attracts you and gets the nuance around it? Emily, anything to add about hybrid engagement?

    Emily: I think you said that perfectly, Dave, and in my experience, often projects benefit in most cases from both because you’re going to have those stakeholders that are really, really invested in the project. Maybe there’s someone that lives right next door to where it’s happening and they’re going to want that forum to really get their opinions out and whether that’s, you know, around a table where you’re talking that can be really effective.

    But then you’re going to have people that don’t want to spend their evening coming to a meeting and they want to just quickly do a survey online. So I think, yeah, in most cases, it’s really going to be beneficial in many different ways.[/scroll-box]


    https://vimeo.com/796806165

    [scroll-box]Dave: Dave, if a project is controversial, does VPI open the agency to even more resistance? I’ve got a short amount of time here. I’ve got more to say on this. But essentially, the short answer is virtual public engagement actually does the opposite. By making engagement more difficult, you’re essentially filtering out all the people who aren’t angry at you, who aren’t willing to give up 2 hours to shake their fist at you.

    So, by making it really easy for people to participate, you’re actually expanding the range of people that participate to the people that are less motivated and typically less angry. Especially if you have a controversial project, you want to make it as easy as possible for people to participate so you can hear the full range of opinions and not just the people that are so fired up that they’ll go to any lengths to give you a piece of their mind, as it were.[/scroll-box]


    Access The Ultimate Virtual Public Involvement
    Checklist webinar now!

  • [SURVEY OF THE MONTH] Identifying Transportation Needs in Ashe County, NC

    [SURVEY OF THE MONTH] Identifying Transportation Needs in Ashe County, NC

    The Survey of the Month series is a monthly blog where we highlight the extraordinary work our customers are doing! We feature well-designed surveys and share takeaways that are relevant for anyone interested in making the most out of online engagement using MetroQuest’s survey platform. To see more in the series, visit the blogs here.


    What’s the story? Organizations Working Together to Engage Ashe County Residents and Road Users

    Ashe County logos
    Logos of all six organizations involved in the survey.

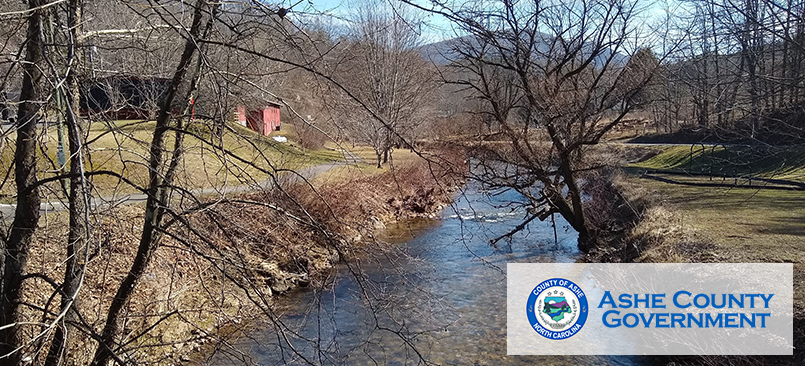
    This month, we feature a survey developed jointly by the North Carolina Department of Transportation (NCDOT), one of our longest subscribers, along with Ashe County and High Country Council of Governments (HCCOG). This survey was truly a team effort and an excellent example of statewide and regional organizations working together to plan for future transportation needs.

    Ashe County is a mountainous region in northwest North Carolina, along the border of Tennessee and Virginia. The centrally located town, West Jefferson, is located about 113 miles northwest of Charlotte, NC and the area is well-serviced by four major highways.

    Comprehensive Transportation Plans, CTPs, are a form of long-range transportation plans. They seek to identify transportation needs and subsequent solutions to address those needs. Input may be gathered at a regional level but often informs statewide planning decisions.


    Anatomy of a Comprehensive Transportation Plan Survey: Seeking Feedback on All Things Transportation

    Like many CTPs, the Ashe County survey sought a wide range of feedback on everything from vehicle use and public transportation to bicycle and pedestrian movement. The project team successfully engaged over 570 people on the survey that remained open from May 11 to June 30, 2022.

    The survey followed a straightforward and logical layout, starting with an inviting and informative Welcome Screen. You may notice a pattern here with surveys starting with a Priority Ranking Screen, and there is a good reason for that! It is a very effective exercise to gather clear and actionable data, which also acts as a simple introductory activity. Then, a Strategy Rating Screen was utilized to gather ratings on 16 statements, and finally, a Map Marker Screen allowed participants to provide location-specific data. As with all MetroQuest surveys, demographic questions are asked on the final Wrap Up Screen.

    We’ll focus on each Screen and highlight some key takeaways for your next survey!


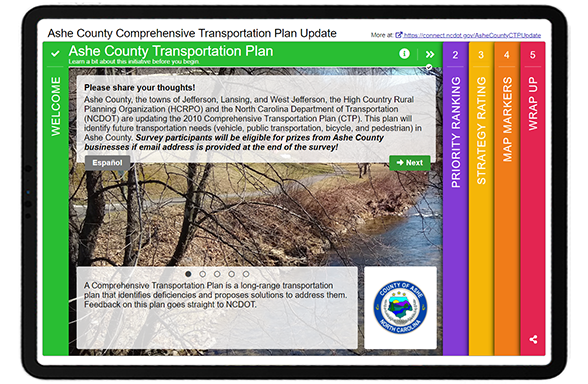
    Screen 1: Welcome

    Similar to our example from last month, bright colors instantly draw you into the survey! They also subconsciously communicate to participants that this will not be another “boring” transportation survey. A wealth of information is shared on this upfront Screen, yet the format ensures it does not appear as a wall of text. The team relayed some key details here, including:

    • Who is conducting the plan/survey
    • What a CTP is
    • How input will be considered
    • The CTP vision statement


    Ashe County Survey_Screen 1


    They also note that those who complete the survey will be eligible for prizes from businesses in Ashe County. When considering a contest for participants, we always recommend offering local prizes, as was done here. When you offer a prize that can be spent from anywhere, such as an Amazon gift card, you increase the risk of ballot box stuffing or bots taking your survey multiple times to win the prize. By keeping your prize as something that can only be useful to someone living in the project area, your risk of ballot box stuffing remains low.

    Notice this Screen also offers a link to the Spanish version of the survey.


    Screen 2: Priority Ranking

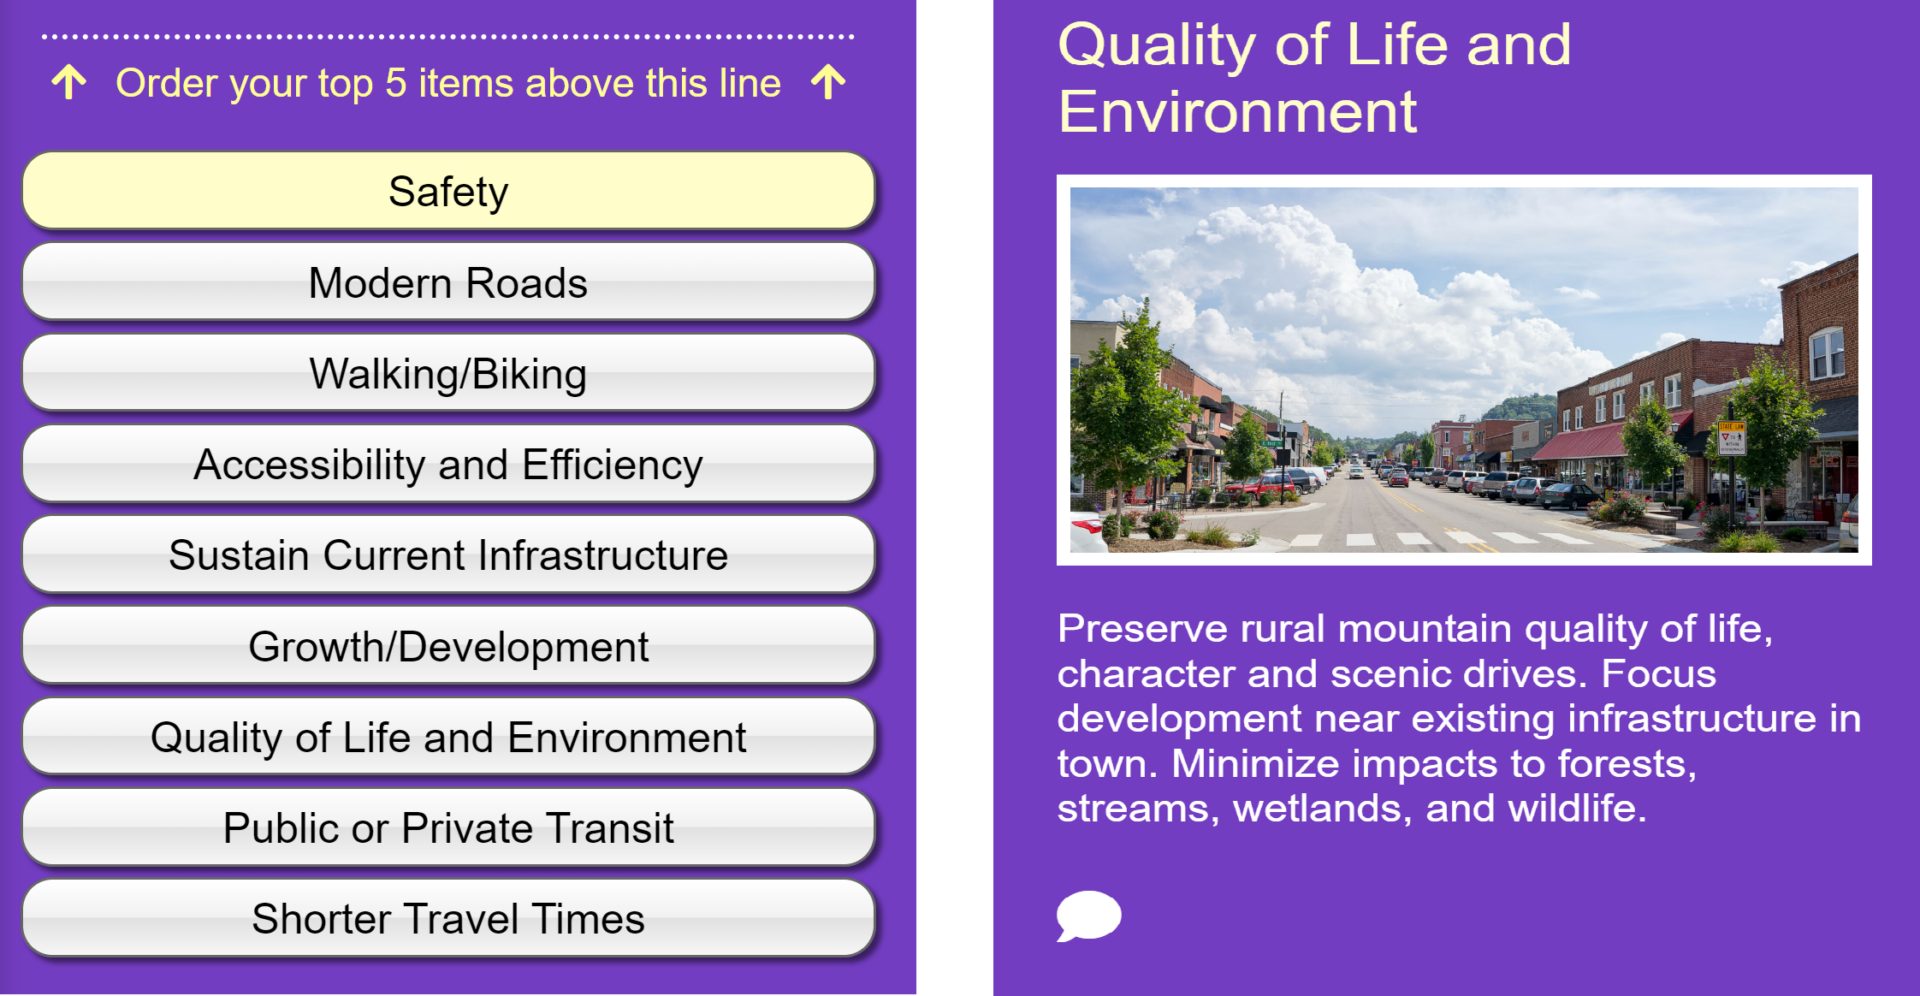
    As noted above, the Priority Ranking Screen offers a great starting point for participants. In this case, they were asked to rank their top five of the following nine priorities as presented in the left image. Each priority is accompanied by an image and a concise yet informative statement, such as this one shown for the Quality of Life and Environment.


    Ashe County_SoTM_Priorities
    [LEFT] List of items to prioritize: safety, modern roads, walking/biking, accessibility and efficiency, sustain current infrastructure, growth/development, quality of live and environment, public or private transit, and shorter travel times.
    [RIGHT] Screenshot of the content and description for the “quality of life and environment” priority.


    Screen 3: Strategy Rating


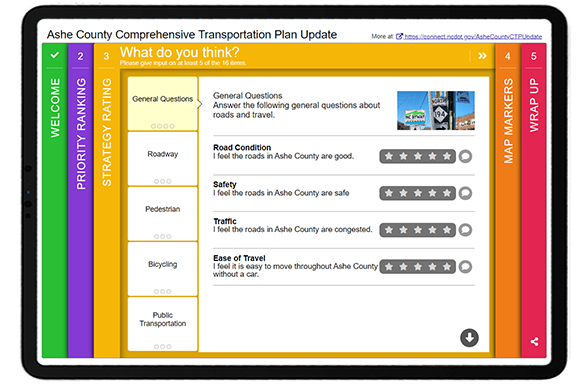
    Ashe County Survey Screen 3


    The Strategy Rating Screen is also one of our most popular activities! It allows you to gather a large volume of quantitative data efficiently. While it works well for strategies, it can also be used for general sentiment statements and gathering opinions on infrastructure options.

    This survey gathered feedback on five main categories:

    • General questions (e.g. overall road condition and congestion)
    • Roadway (e.g. road improvements and widening)
    • Pedestrian (e.g. more sidewalks and improved pedestrian connections)
    • Bicycling (e.g. bike lanes and types of paths)
    • Public Transportation (e.g. expanded use and transit vs. vehicle space)

    * Tip – if you are considering the Strategy Rating Screen but want more of a visual focus, try out our Image Rating Screen. It’s a similar question format that allows for larger images.


    Screen 4: Map Marker

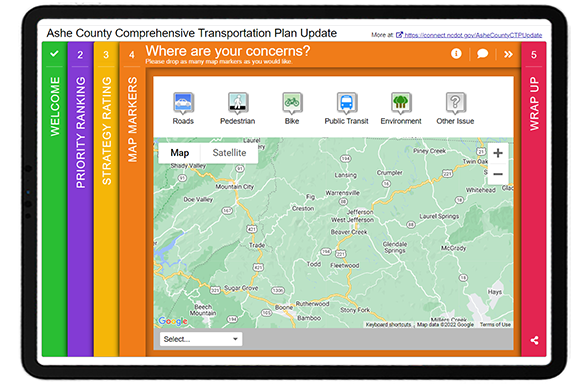
    Continuing with the same topic areas, the Map Marker Screen allowed participants to visually drop markers where they had experienced issues and explain what they encountered in more detail.


    Ashe County Survey Screen 4


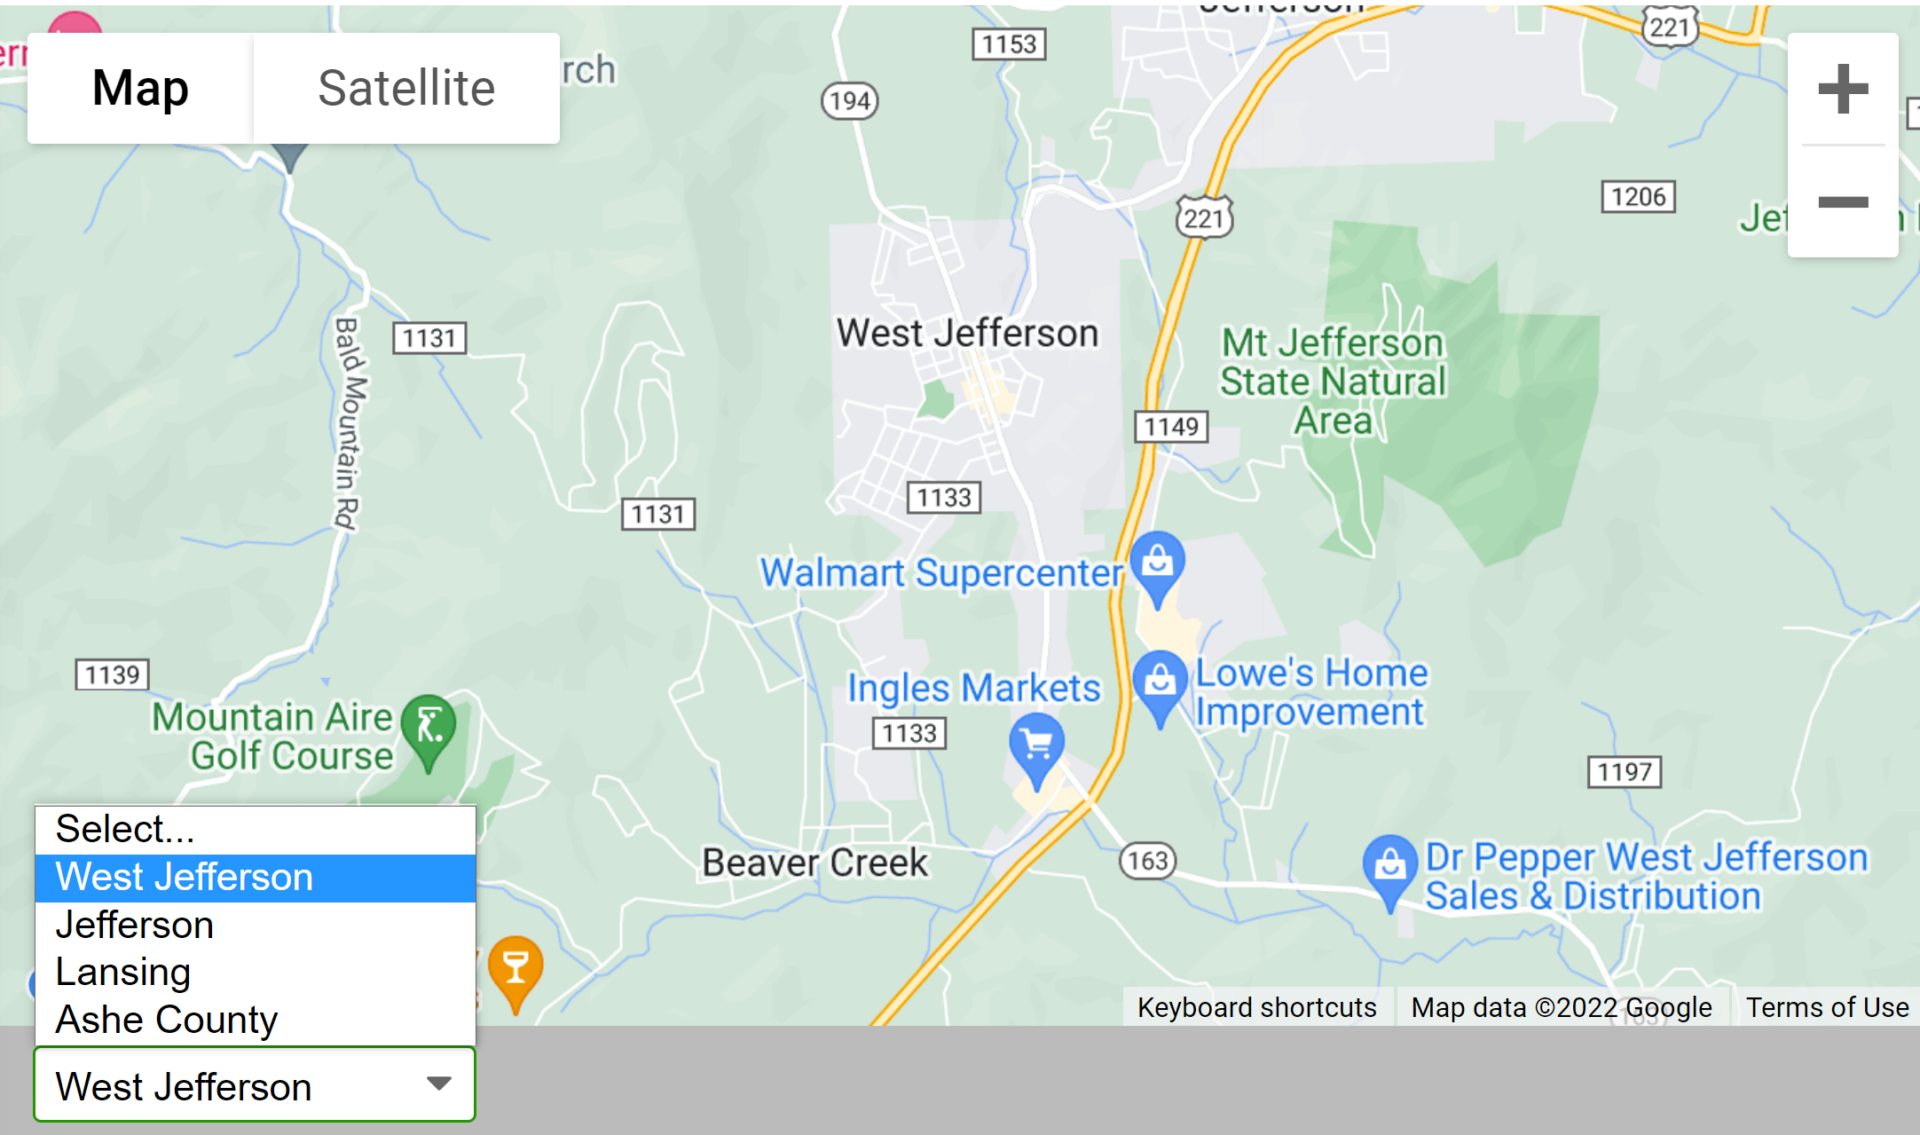
    Ashe County MRKdropdownAdditionally, since the project area encompassed several towns, they used the dropdown menu to allow participants to zoom into Ashe County, Jefferson, West Jefferson and Lansing. Anything you can do to make your survey faster to complete will pay off.


    Screen 5: Wrap Up

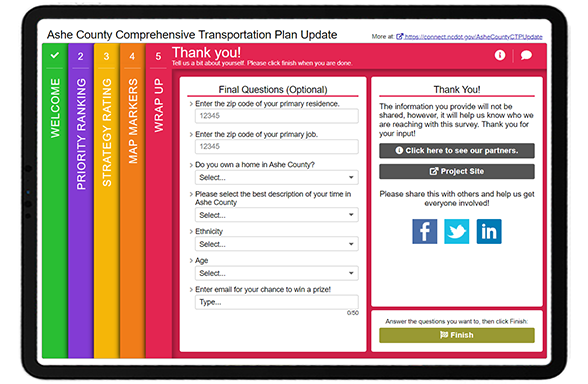
    To wrap things up, the final Screen asked a series of demographic questions. The team followed a number of best practices here, such as:

    • Utilizing dropdown menus to gather quantifiable data and keep the format brief
    • Listing ethnicities in alphabetical order
    • Sticking to just six simple questions


    Ashe County Survey Screen 5


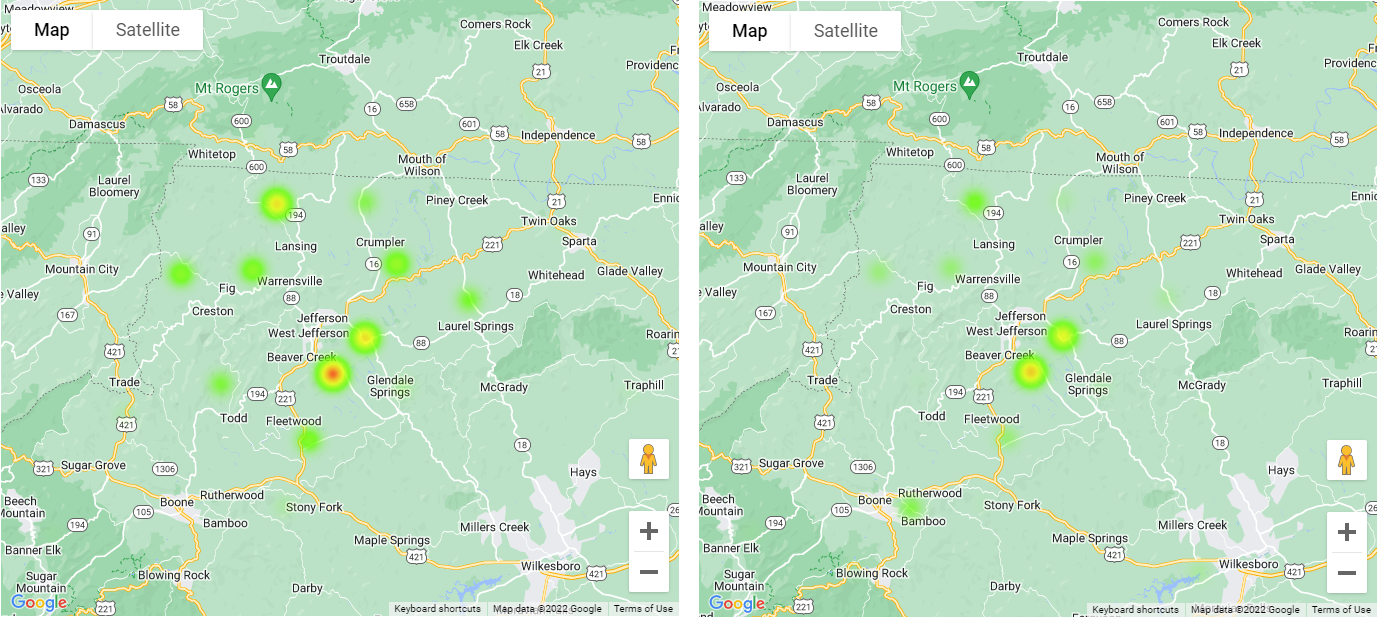
    Additionally, during our latest optimizing webinar, we highlighted our relatively new ZIP/postal code heat map feature. By asking participants to provide ZIP codes for their residence and job, the team could see trends between common commuter routes. Notice the difference in the two heat maps below:


    Ashe County Residential ZIP Codes
    Residential ZIP codes are shown on the left and primary job ZIP codes on the right. Notice how they are similar, yet residents are more concentrated in Beaver Creek and more jobs appear near Boone.


    5 Tips from the Ashe County CTP Update Survey:


    1. If you are offering an incentive, keep it local: As mentioned earlier, this survey included an option for participants to provide their email to be entered into a prize draw. The survey indicates that the prizes are local, reducing the likelihood of non-community members or bots completing the survey just for the prize.
    2. Consider bright and inviting colors: Whether you match your color palette to your branding or choose something bright and cheerful, consider that your survey colors often are the first thing that participants notice. The more they stand out, the more likely your survey will be taken. Keep in mind that surveys are often shared via a thumbnail image on social media, so the colors and Welcome Screen image have a big impact.
    3. Flow through content in a consistent sequence: You will notice when going through this survey that the topics remain the same throughout each Screen, but different activities and questions gather a variety of input. Surveys that are consistent and build on the same topic areas are often more successful. Consider that a survey may be your community’s first time learning about a particular topic, so you want to keep the content focused to avoid information overload.
    4. Ask for home and work ZIP codes: As shown above, the Wrap Up Screen included a place for respondents to provide both their primary home and work location ZIP codes. Coupled with our recent heat map feature for ZIP codes, you can easily see who you hear from and identify whether you need to target your promotion in certain underrepresented areas. Asking for both a home and work location also gives you a sense of common commuter activity.
    5. Order demographic options in alphabetical order: To ensure you are engaging equitably and fairly, always list race or ethnicity options in alphabetical order.


    The NCDOT team and the various regional sub-organizations throughout the state create some excellent MetroQuest surveys. We thank them for the opportunity to highlight this excellent CTP update survey! Make sure to check it out yourself here.


    For more great tips on how to make the most out of MetroQuest reach out for more information or, if you are an existing subscriber, contact our  Vice President, Norma Hogan.

    Check out our latest webinar where we discussed the most effective strategies for promoting and designing surveys that support diverse and equitable participation.


    Webinar_Optimizing Diverse and Equitable Public Engagement

    Optimizing Online Surveys for
    Diverse and Equitable Public Engagement


  • The Future of Electric Vehicles in Transportation Planning: An Interview with Andrea Noel

    The Future of Electric Vehicles in Transportation Planning: An Interview with Andrea Noel

    The planning industry always needs to consider evolving modes of travel, and electric vehicles are climbing up the list. I recently had the opportunity to connect virtually with Andrea Noel, the Planning Supervisor for the Tennessee Department of Transportation (TDOT). The agency most recently developed a plan as part of their commitment to support electric vehicle technologies. Andrea gave us a complete breakdown of the Electric Vehicle Infrastructure Deployment Plan, which will support Tennessee’s mission to create a network of electric vehicle charging stations along key routes in the state.  

    Here at MetroQuest, we were intrigued to learn how the team at TDOT utilized our software for understanding the future of electric vehicles in transportation planning, and excited by the successful engagement efforts made by Tennessee DOT to gather public input on the plan! In our conversation, Andrea shared why MetroQuest was so useful for this project and discussed the strategies they implemented for their public outreach, how the results affected the plan, and what, in her opinion, the future holds for electric vehicles in transportation planning. 

    Continue reading to get all the details…  


    Why did you choose MetroQuest for your Tennessee Electric Vehicle Infrastructure survey?  

    Well, that was easy. We want to use MetroQuest for all our planning surveys because it provides such a good visual for people. With other software, sometimes people can’t answer the question exactly how you had it, or sometimes they don’t even understand the content. 

    “It’s kind of like when you go to the voting station, right? And you’re like, oh, I didn’t read up on that guy. I don’t even know if I should vote for him or not. When you’re taking a survey, it’s similar. MetroQuest really gives you the ability to see it on a map and see where it is.”

    I love that section where you can put a list of things and add a description and picture. I think that helps people answer questions with knowledge. I think that it is important to be able to give participants the information within the survey. That’s the part I love about it the most. I feel like it’s more than just a survey. It’s a way for us to give them information and educate them. 

    What strategies did you use to gather public participation?  

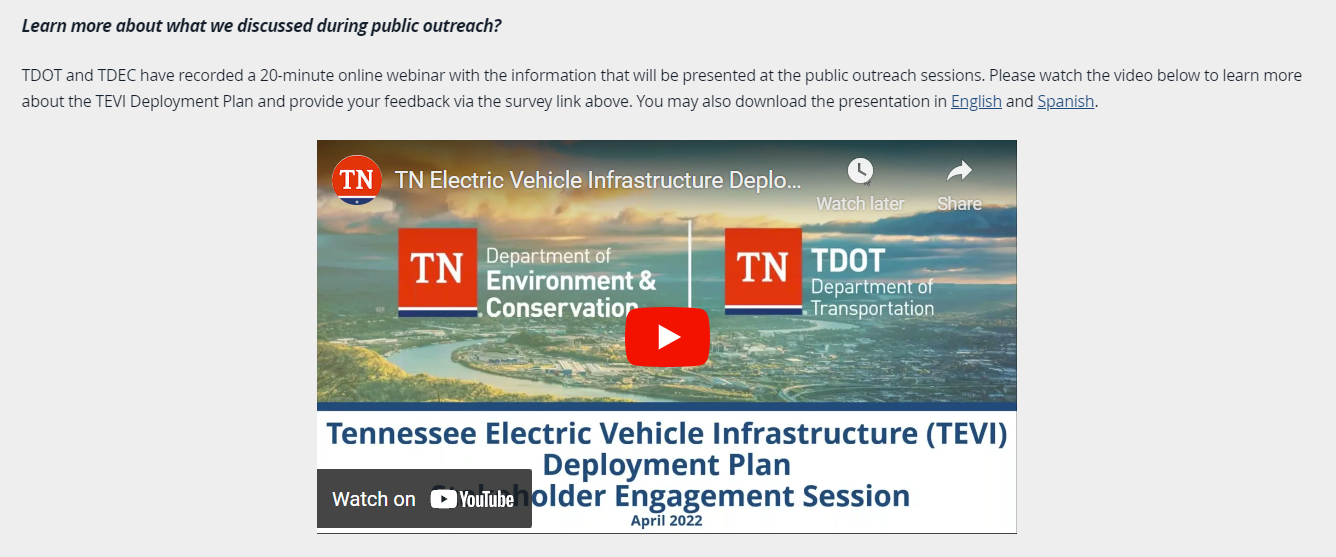
    Our whole public engagement plan was to use several methods for participation. We wanted to be able to go to people in person and also have a survey for those that didn’t show up. We traveled around the state, and we did nine locations in person. Our first step was doing a webinar and putting it on the website. And then we did the survey, which was open and collecting public input from May 1st until May 30th. 

    “We just wanted to have a lot of different things so that everybody that wanted to participate could. We got 1,014 responses in that 30-day period.”


    We did have a social media campaign. We used Facebook, Twitter, and sent out reminders. We also had an email blast. We sent out over 7,000 emails to our stakeholder group. We sent the link to the survey and the dates and locations of where we were going to be.  

    During the in-person session, we had little cards printed with a QR code so they could click on them and be taken to the survey directly. At in-person events, they wanted to ask questions, but we didn’t feel like we were getting the answers we needed. The survey is what really gave us their prioritized choices. 

    What were you hoping to achieve by using MetroQuest? 

    We had two goals. Our first goal was to find out what people wanted when they drove up to a charging station. We gave them a list of ten things and said, “which four things are the most important for you when you go to a charging station?” The top concern turned out to be safety. But then we even broke safety down into, what do you want out of safety? People wanted to know that there would be lights 24 hours a day and cameras in case something happened.  

    “When we start writing the guidance this week, safety is our number one priority. That’s going to be a requirement now because that’s what we got out of the survey. We’ll be putting their priorities into action.”

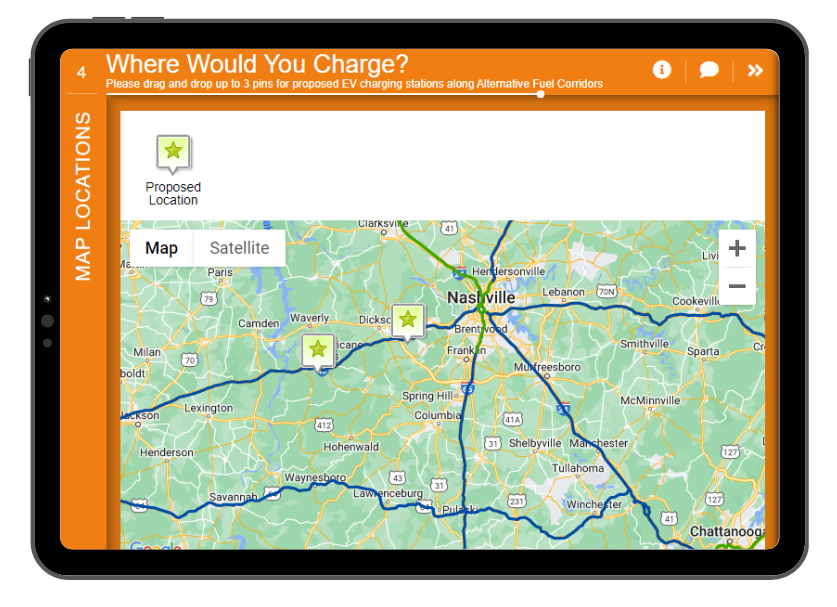
    The second goal was to identify specific locations stakeholders thought would be good for charging stations. On our last screen of the Survey, we had an interactive map activity. We built-in a location buffer because the charging stations must be within a mile of the exit. We buffered the map so that they could only click in a within a mile of that buffer. We wanted to know, where do you want to see the stop? Where would you stop if you were driving from one side of the state to the other? 


    How did the public participation results impact your plan priorities?  

    We didn’t even think about the plan. We didn’t think about the guidance. All we did was think about how to engage the public first. As the month went along, we looked at in-person and online comments and saw a lot of safety concerns. At the next meetings, we would say if safety were your first priority, what exactly does that mean to you? We were able to delve deeper into it. No one had any preconceived decisions or notions; we let the public decide for us what those priorities would be. 

    What results did you achieve on launching the survey, and what were the outcomes that came from the data?  

    The survey closed on May 30th, and during the first two weeks of June, we analyzed the data, which was easy because MetroQuest had already given us the map showing where people took the survey to see if it was relevant to where we had our in-person meetings. 

    We did find that the highest participation levels were also where we had our in-person meetings. We think going in person and promoting the survey helped boost those numbers.  

    Looking at the data, we discovered only 2% of participants identified themselves as being from the freight industry. I’m attending a statewide freight advisory group meeting to present again about the plan. We will meet them in person and ask for their opinions to put into the guiding document. 

    Having the Survey data helped us focus on who we think we missed.  

    What do you think the future holds for Electric Vehicles in transportation planning?  

    I don’t think it’s going away. We have to think about how it’s going to change how we plan because people can move differently now. We’re going to have to start thinking about where people are going to charge their electric vehicles. What are they going to be near when they charge? Are they going to stop and have dinner?  

    In five years, things are going to look so much different. As planners, we have to keep our minds open to the next thing because in likelihood, these chargers are not going to be here in 20 years. They’re going to be outdated in five, and then we’re going to have to be thinking about the next thing. We need to really start looking at our plans as being like five-year increments, more so than we used to do. 


    Congratulations to Andrea and the entire team at TNDOT! We’re so inspired by your public engagement efforts and looking forward to seeing how your impressive survey results shape Tennessee’s electric vehicle infrastructure planning!  

    For more ideas on successful public outreach, read our past interview with Adrienne Heim, the Public Information Officer for San Francisco Municipal Transportation Agency: An Interview with Adrienne Heim: Engagement Strategies, Tips and Techniques to Help enhance Your Public Outreach. Need help reaching diverse crowds? Read our latest blog 5 Equitable Community Engagement Tactics: What to Expect from #VPET22.  

  • 4 Survey Examples to Inspire your Next Transportation Plan Study

    4 Survey Examples to Inspire your Next Transportation Plan Study

    Community surveys can be a mixed bag in terms of effectiveness. Practitioners in planning, and transportation planning in particular, can have a difficult time catching the attention of their community when there are so many other things competing for their attention. But when done well, online community engagement can have a profound and meaningful impact on your project. With an eye toward the best examples of online surveys that achieved great results, let’s take a look at 4 different survey examples that will inspire your next transportation plan study. If you know what you’re looking for, feel free to jump ahead to the type of survey you need: 

    Planning Ahead: Survey Examples for Long Range Transportation Plans

    Long range transportation plans are all about learning the growth patterns and opinions of the community now, and gathering insight into how projects can meet growing demands of the future. 3 elements to consider when developing an online survey for LRTPS: 

    1. Gathering input early in the process. This will help generate interest and knowledge in the project, as well as help your planners identify community priorities. 
    2. Maintaining communication with the surveyed population over time. This could be done through post-survey reports, announcements… or even a follow up survey. 
    3. Giving context! Particularly because the results of the survey won’t be enacted for years to come, give context around existing plans, the latest update, and what you’ll do with the information afterward.

    In Treasure Valley, located in Southwest Idaho, the Community Planning Association (COMPASS) foresaw rapid population growth in their area over the next 30 years, and thus needed a way to understand how their citizens were currently using the transit system, as well as fine-tune a transit option that would suit the population now, as well as while it grew.  This survey example is actually a 3-in-1 example. COMPASS used a series of three surveys to first identify the public’s opinions on the future; get opinions on 4 scenarios derived from the results of the first survey; and finally do a deep dive into the scenario that proved most popular in the second survey.

    If you’re curious about how these surveys worked out (spoiler alert: very, very well) visit COMPASS’ case study for the full story!

    Mobility Options: Survey Example for Route Scenario Planning 

    How do you show different scenarios to the community, while conveying all the pros, cons, and tradeoffs that need to be made for each one? Scenario planning can be complicated, especially when it comes to gathering public input and identifying the option with the most public support! 

    3 elements to consider when developing an online survey for scenario planning 

    1. Showing the benefits and drawbacks of each option clearly. Your participants need to clearly understand the stakes.  
    2. Cutting out irrelevant details for clarity. What details do participants need to know to make an informed decision?  
    3. Anticipating additional options. Sometimes the community has different ideas for the region! Give participants a chance to provide input on their priorities in general. 

    Texas Department of Transportation (TxDOT) needed to ease the congestion around the city of Seminole, a major hub and important transportation corridor. The roadway provides access for the region’s agricultural industry as well as the energy sector, and faced mounting pressure and increased use. TxDOT wanted to gauge community properties and identify the best option out of the several that the agency had identified. 

    This survey example is a great one because it approaches the problem of conveying scenarios by giving participants two different activities to consider the same three scenarios. Take a look at the example survey below to see how that helps illustrate the options clearly and effectively.  

    Updating the Future Vision: Survey Example for Metropolitan Transportation Plan

    Federal mandates around updating Metropolitan Transportation Plans (MTP) mean that this form of transportation planning can take up a lot of resources. Particularly with a public engagement element, a well–designed online survey can make the process easier. 

    3 elements to consider when developing an online survey for metropolitan transportation plans

    1. Setting expectations for participants. With regular plan updates necessary, creating routine or consistent engagement opportunities can improve participation rates over time! 
    2. Efficiently utilizing resources. With the regularity of MTP updates, consider dedicating some resources into developing the skills and tools you’ll need time after time. 
    3. Developing branding. If you’ll be regularly engaging the same community, it’s a good idea to establish a consistent and memorable brand—even if it’s just colors and a logo. 

    In Louisiana, the Capital Region Planning Commission (CRPC) in Baton Rouge focuses a large part of its resources on updating the Metropolitan Transportation Plan every four years. By regularly updating a vision of future transportation, they’re able to coordinate with local governments and key stakeholders to ensure that projects support existing priorities in the region. 

    This survey is beautifully designed, with well thought out placement of key information and interactive methods of gathering input. The team was familiar with the survey platform and used their expertise to build a very engaging survey, including a budget game to demonstrate resource tradeoffs, and a map to collect geospatial data around the region’s biggest transportation needs.


    Environmental Factors: Survey Example for Planning and Environmental Linkages
     

    With a focus on environmental aspects, Planning and Environmental Linkages (PEL) studies are a crucial part of transportation planning, particularly because of its impact on the National Environmental Policy Act (NEPA) environmental review process.  

    3 elements to consider when developing an online survey for PEL studies 

    1. Establishing data requirements. As an inter-agency study, it’s important to keep on top of each agency’s particular data needs.   
    2. Designing surveys with the outcome in mind. PEL studies have direct impact on how agencies plan transportation projects!  
    3. Developing realistic timelines. Although PELs minimize duplication of efforts between planning and NEPA processes, the additional stakeholders involved can complicate deadlines.  

    The Michigan Department of Transportation, working with AECOM, created this survey for a PEL study around Grand Rapids and Wyoming. The purpose was to evaluate improvements for a section of the US-131 around the conditions and safety of the corridor, as well as local needs, community development and economic growth.  

    The survey was developed in response to comments received during the initial study process. The team used clever methods to maintain data integrity throughout the survey, including limiting certain answers to drop-downs or multiple-choice, and designing the complex questions to feel short and not-overwhelming. 


    For more information, the Federal Highway Administration has some excellent resources on the 
    Planning and Environment Linkages page.


    What types of surveys would you like to see examples of next? Let us know in the comments! 


    To learn more about using online surveys to support your next transportation project, contact us for more survey examples or watch our recent webinar on-demand: 

    The Art & Science of Effective Online Surveys for Planning

    The Art & Science of Effective Online Surveys for Planning 

    The road to success with online surveys is part art and part science. This webinar explores both by unbundling the most successful MetroQuest surveys and what made them so effective!