The planning industry always needs to consider evolving modes of travel, and electric vehicles are climbing up the list. I recently had the opportunity to connect virtually with Andrea Noel, the Planning Supervisor for the Tennessee Department of Transportation (TDOT). The agency most recently developed a plan as part of their commitment to support electric vehicle technologies. Andrea gave us a complete breakdown of the Electric Vehicle Infrastructure Deployment Plan, which will support Tennessee’s mission to create a network of electric vehicle charging stations along key routes in the state.
Here at MetroQuest, we were intrigued to learn how the team at TDOT utilized our software for understanding the future of electric vehicles in transportation planning, and excited by the successful engagement efforts made by Tennessee DOT to gather public input on the plan! In our conversation, Andrea shared why MetroQuest was so useful for this project and discussed the strategies they implemented for their public outreach, how the results affected the plan, and what, in her opinion, the future holds for electric vehicles in transportation planning.
Continue reading to get all the details…
Why did you choose MetroQuest for your Tennessee Electric Vehicle Infrastructure survey?
Well, that was easy. We want to use MetroQuest for all our planning surveys because it provides such a good visual for people. With other software, sometimes people can’t answer the question exactly how you had it, or sometimes they don’t even understand the content.
“It’s kind of like when you go to the voting station, right? And you’re like, oh, I didn’t read up on that guy. I don’t even know if I should vote for him or not. When you’re taking a survey, it’s similar. MetroQuest really gives you the ability to see it on a map and see where it is.”
I love that section where you can put a list of things and add a description and picture. I think that helps people answer questions with knowledge. I think that it is important to be able to give participants the information within the survey. That’s the part I love about it the most. I feel like it’s more than just a survey. It’s a way for us to give them information and educate them.
What strategies did you use to gather public participation?
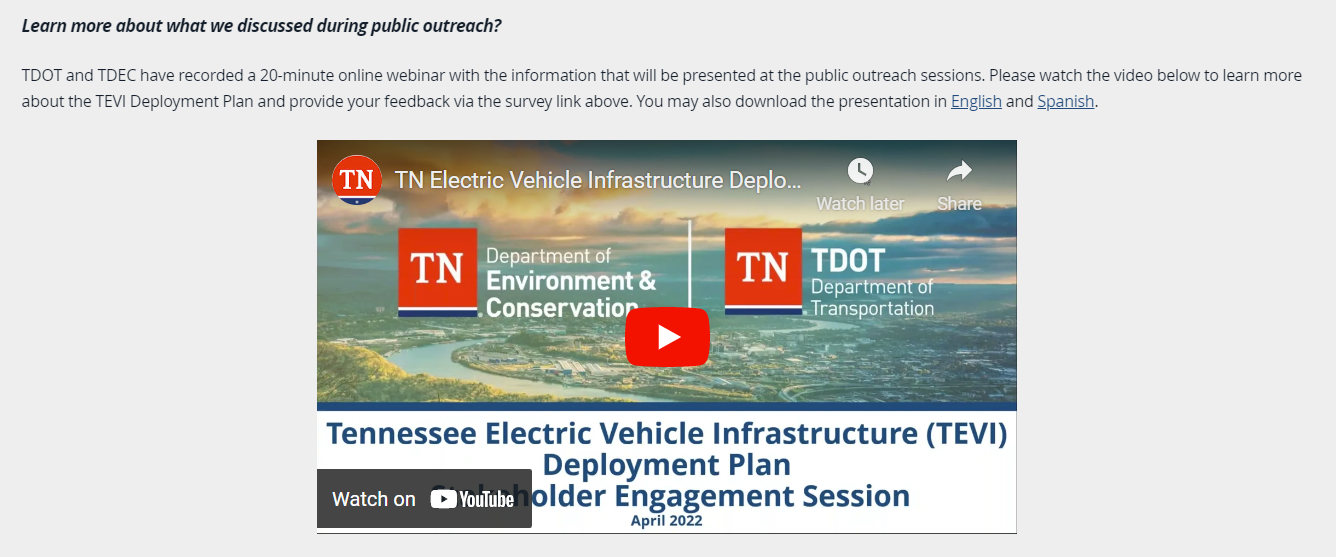
Our whole public engagement plan was to use several methods for participation. We wanted to be able to go to people in person and also have a survey for those that didn’t show up. We traveled around the state, and we did nine locations in person. Our first step was doing a webinar and putting it on the website. And then we did the survey, which was open and collecting public input from May 1st until May 30th.
“We just wanted to have a lot of different things so that everybody that wanted to participate could. We got 1,014 responses in that 30-day period.”
We did have a social media campaign. We used Facebook, Twitter, and sent out reminders. We also had an email blast. We sent out over 7,000 emails to our stakeholder group. We sent the link to the survey and the dates and locations of where we were going to be.
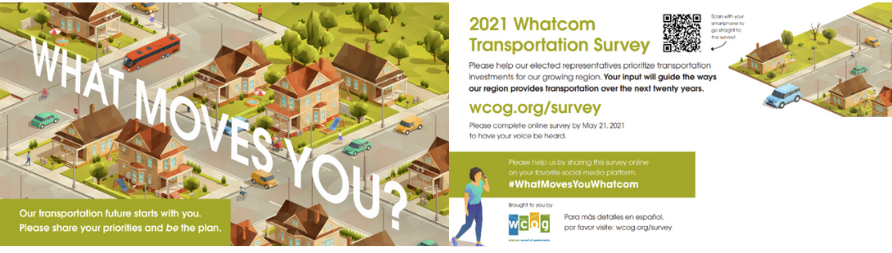
During the in-person session, we had little cards printed with a QR code so they could click on them and be taken to the survey directly. At in-person events, they wanted to ask questions, but we didn’t feel like we were getting the answers we needed. The survey is what really gave us their prioritized choices.
What were you hoping to achieve by using MetroQuest?
We had two goals. Our first goal was to find out what people wanted when they drove up to a charging station. We gave them a list of ten things and said, “which four things are the most important for you when you go to a charging station?” The top concern turned out to be safety. But then we even broke safety down into, what do you want out of safety? People wanted to know that there would be lights 24 hours a day and cameras in case something happened.
“When we start writing the guidance this week, safety is our number one priority. That’s going to be a requirement now because that’s what we got out of the survey. We’ll be putting their priorities into action.”
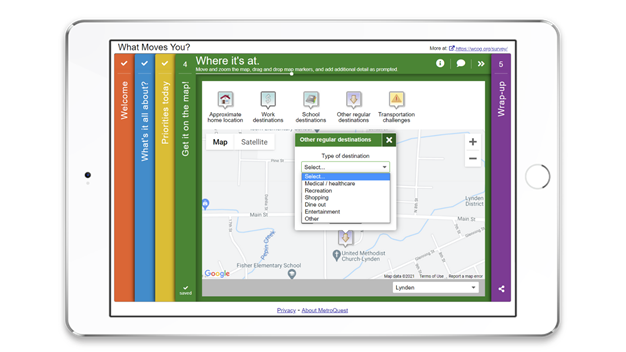
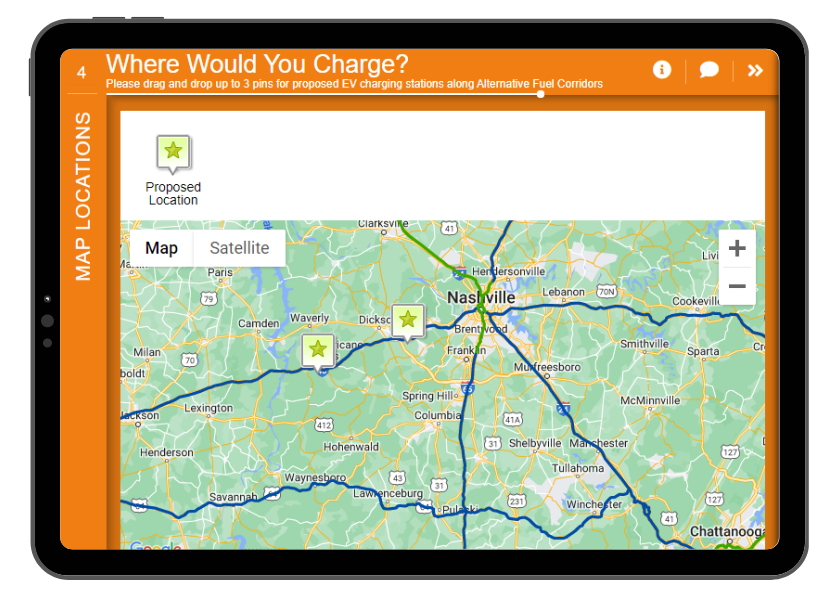
The second goal was to identify specific locations stakeholders thought would be good for charging stations. On our last screen of the Survey, we had an interactive map activity. We built-in a location buffer because the charging stations must be within a mile of the exit. We buffered the map so that they could only click in a within a mile of that buffer. We wanted to know, where do you want to see the stop? Where would you stop if you were driving from one side of the state to the other?

How did the public participation results impact your plan priorities?
We didn’t even think about the plan. We didn’t think about the guidance. All we did was think about how to engage the public first. As the month went along, we looked at in-person and online comments and saw a lot of safety concerns. At the next meetings, we would say if safety were your first priority, what exactly does that mean to you? We were able to delve deeper into it. No one had any preconceived decisions or notions; we let the public decide for us what those priorities would be.
What results did you achieve on launching the survey, and what were the outcomes that came from the data?
The survey closed on May 30th, and during the first two weeks of June, we analyzed the data, which was easy because MetroQuest had already given us the map showing where people took the survey to see if it was relevant to where we had our in-person meetings.
We did find that the highest participation levels were also where we had our in-person meetings. We think going in person and promoting the survey helped boost those numbers.
Looking at the data, we discovered only 2% of participants identified themselves as being from the freight industry. I’m attending a statewide freight advisory group meeting to present again about the plan. We will meet them in person and ask for their opinions to put into the guiding document.
Having the Survey data helped us focus on who we think we missed.
What do you think the future holds for Electric Vehicles in transportation planning?
I don’t think it’s going away. We have to think about how it’s going to change how we plan because people can move differently now. We’re going to have to start thinking about where people are going to charge their electric vehicles. What are they going to be near when they charge? Are they going to stop and have dinner?
In five years, things are going to look so much different. As planners, we have to keep our minds open to the next thing because in likelihood, these chargers are not going to be here in 20 years. They’re going to be outdated in five, and then we’re going to have to be thinking about the next thing. We need to really start looking at our plans as being like five-year increments, more so than we used to do.
Congratulations to Andrea and the entire team at TNDOT! We’re so inspired by your public engagement efforts and looking forward to seeing how your impressive survey results shape Tennessee’s electric vehicle infrastructure planning!
For more ideas on successful public outreach, read our past interview with Adrienne Heim, the Public Information Officer for San Francisco Municipal Transportation Agency: An Interview with Adrienne Heim: Engagement Strategies, Tips and Techniques to Help enhance Your Public Outreach. Need help reaching diverse crowds? Read our latest blog 5 Equitable Community Engagement Tactics: What to Expect from #VPET22.