Category: [TIPS]

  • [SURVEY OF THE MONTH] Envisioning Sustainable Transportation for the San Joaquin Region

    [SURVEY OF THE MONTH] Envisioning Sustainable Transportation for the San Joaquin Region

    The Survey of the Month series is a monthly blog where we highlight the extraordinary work our customers are doing, along with some takeaways that are relevant for anyone interested in making the most out of online engagement using MetroQuest’s survey platform! To see more in the series, visit the blogs here.

    This month, we are featuring a survey with a unique approach to informing its participants: through the use of videos! Follow along as we introduce you to a survey developed by the San Joaquin Council of Governments (SJCOG) and the consulting team at Cascadia Partners.

    The Envision 2050 survey was launched through MetroQuest during summer 2021 to gather feedback on the 2022 Regional Transportation Plan (RTP) and Sustainable Communities Strategy (SCS) for San Joaquin County, California. This long-range vision and investment plan focuses on the region’s future transportation needs and sustainability targets.


    What’s the story? Planning for a Sustainable Transportation Future

    SJCOG oversees transportation, housing and habitat conservation for the San Joaquin region, which comprises several cities in California east of San Francisco, namely Stockton, Lodi, Manteca, Tracy, Ripon, Escalon, and Lathrop.

    Under the project name Envision 2050, SJCOG is updating their 2022 RTP and SCS, a process undertaken every four years to inform a 30-year land use and transportation plan. In addition to identifying future infrastructure and housing investments, this process has a particular focus on sustainability. The plan must also outline how the region can meet federal and state air quality standards and reduce greenhouse gas emissions.

    The project team used MetroQuest as an essential component of their public participation plan for this comprehensive initiative.

    The Envision 2050 survey sought input from the community on priorities for the region’s future, focusing on four different scenarios for how the region could grow:

    1. Stay the Course
    2. Remake Centers & Corridors
    3. 20-minute Neighborhoods
    4. Commuter Villages

    The survey, offered in English and Spanish, shared information on the different scenarios through short videos and gathered feedback on residents’ level of agreement to each overall scenario and a series of features for each scenario.

    The survey successfully gathered input from over 400* participants and provided valuable data to inform which scenario(s) and strategies would be recommended to the SJCOG Board for the 2022 RTP/SCS.

    Learn more about Envision 2050 and view the survey results on SJCOG’s project website.


    Anatomy of a Comprehensive Land Use Survey: Gathering Feedback on Future Scenarios

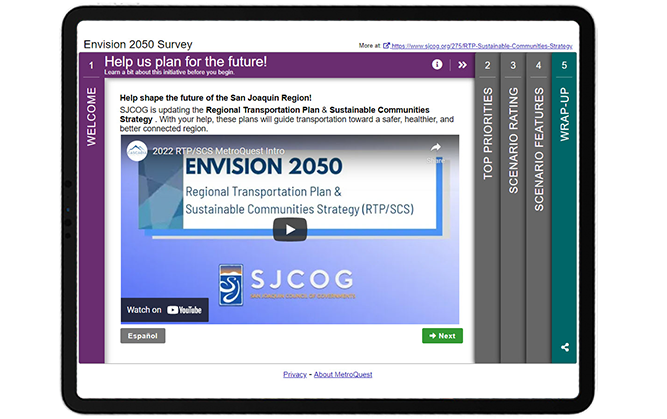
    Upon opening the survey, visitors are greeted with a video, embedded front and center on the screen. The video explains how input will be considered and introduces the initiative. This unique approach allows the survey to remain light on text while still providing important background information.

    This approach of starting with a video is particularly advantageous if your project requires a bit more extensive background information up front, and is generally a good practice to include in the Welcome Screen which delivers the first impression of the survey to visitors. Most people are more likely to click on a video rather than read a wall of text, increasing the likelihood of visitors continuing to Screen 2 of the survey!


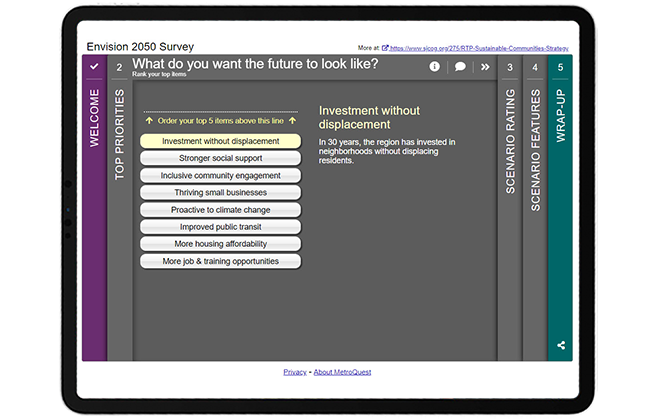
    Like many MetroQuest surveys, participants are introduced to the interactive part of the survey through a Priority Ranking Screen. This simple exercise asks participants to rank their top five of eight items. This activity is especially useful for long-range planning projects as it provides precise data on the priorities of the community. SJCOG’s survey asks for respondents to rank priorities such as improved public transit and more housing affordability among other topics. In many cases, it can be beneficial to include images next to each priority to make this Screen more welcoming and easier to navigate, as well as to appeal to visual learners.


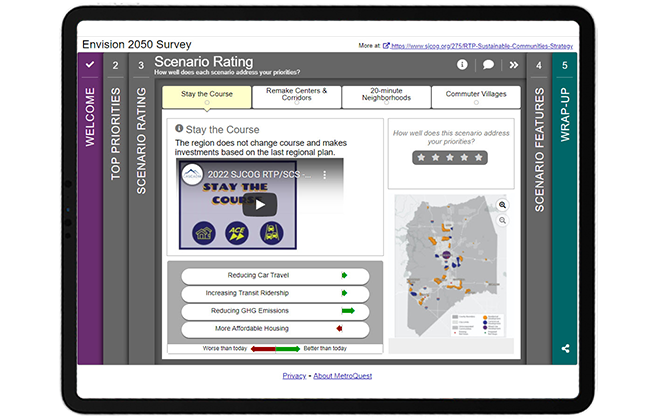
    Screen 3 utilizes MetroQuest’s unique Scenario Rating Screen format which provided a perfect platform for the project team to present all four possible future scenarios. Each of the four tabs on this Screen shares context and information through a brief video description of the scenario, arrow indicators showing how the scenario would impact the community, and a map presenting land-use changes. The most important piece on each tab is the five-star rating scale, where participants can rate whether the scenario addresses their priorities. The engagement team did several things very well on this Screen and on the Survey overall: we will discuss this in more detail later in this blog post.


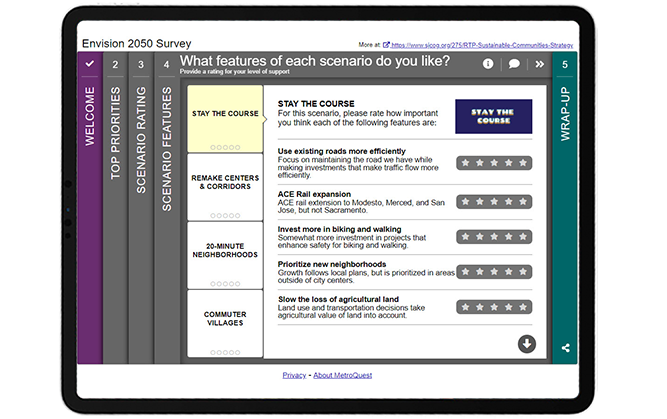
    Following the Scenario Rating Screen, participants are presented with the Strategy Rating Screen which in this case was used to rate various features of the four scenarios presented on the earlier Screen. By using the same consistent names for each scenario, this Screen transitions seamlessly from Screen 3, avoiding any confusion as can often be the case with surveys asking for feedback on various options. Each feature includes a sentence-long description to help explain the impact it would have on the community. You will notice that the images in the top right of this Screen retain the same branding from the videos on the previous Screen. The visual and language consistency throughout the survey is an excellent example of how well-executed, clear content can make a huge difference in helping participants understand a survey and provide valuable feedback.


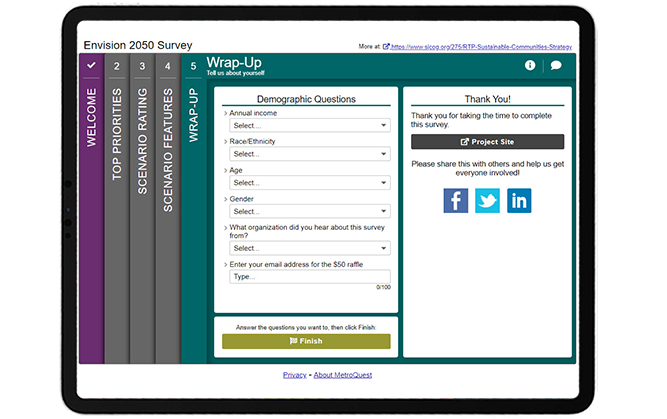
    The last Screen completes the survey with four simple dropdown questions asking for demographic information on income, race/ethnicity, age and gender. It also asks how participants heard about the survey, which can be valuable information to inform future engagement initiatives.


    Try the survey yourself! Complete this demo version of the Envision 2050 survey to try the survey live. Your responses will not impact the survey results. Don’t forget to come back to this tab to keep reading the next section below where we share some helpful takeaways!


    5 Tips from the Envision 2050 Survey: Engaging Videos and Consistent Content Makes all the Difference!

    The project team successfully used MetroQuest to design a long-range comprehensive survey that was engaging and informative yet quick to complete. Long-range planning is complex and its materials wordy but the use of videos throughout helped participants make an informed decision before providing feedback. Additionally, planning for the future can often feel abstract and far away. To allow participants to better imagine the reality of each scenario, the videos included on the Scenario Rating Screen were narrated in the voice of someone from the future. These types of features are just a few examples of what set this survey apart and contributed to an overall interactive participant experience.

    Here are 5 takeaways from this survey to keep in mind when you design your next survey:

    1. As mentioned above, this survey featured five embedded videos, all under one minute in length. The inclusion of videos eliminates the need for a significant amount of text, adding to the interactive and engaging tone of the survey. By keeping the videos short, the SJCOG team successfully ensured their survey remained quick to complete, increasing the likelihood of receiving high-quality feedback. Additionally, the inclusion of text in the videos allows the survey to remain accessible for the hearing impaired. Embedding videos is explained on our support website.
    2. Consistency was key with this survey! Since many participants learn about an initiative at the time of taking a survey, especially in this age of virtual engagement, it is crucial to keep terminology and naming consistent and simple to avoid any confusion. Consistent naming of the four scenarios throughout the survey and consistent branding with differentiated colors for each scenario helps tie everything together. These small design elements can be the difference between someone understanding the survey and providing accurate feedback or someone getting confused and giving up on the survey prematurely.
    3. One of the primary features of the Scenario Rating Screen (Screen 3 in this survey) and a unique feature of MetroQuest is the green and red arrow indicators that show how each scenario impacts the community differently. This survey makes great use of this feature by showing how every scenario would impact four important factors: reducing car travel, increasing transit ridership, reducing GHG emissions and more affordable housing. Participants could weigh their preference for each scenario by looking at whether the factors would be worse or better than today.
    4. Also on the Scenario Rating Screen, the project team included map images showing different zoning areas and boundaries for each future scenario. By utilizing a consistent map format that was sized and formatted the same way in each of the four tabs, participants can easily flip between scenarios to see how the map changes. This too helps participants identify which of the scenarios most aligns with the future they wish to see.
    5. The fourth survey Screen utilizes the Strategy Rating Screen, gathering ratings on several features for each of the four future scenarios. This Screen continued to use consistent naming and branding to ensure a smooth transition from the previous Screen and that respondents could differentiate between the options. Including concise, action-oriented descriptions for each feature allows for well-educated feedback and, subsequently, quality data!


    Congratulations to the project team at SJCOG and Cascadia Partners for creating a fun and interactive MetroQuest survey! Their use of videos brought the future of the San Joaquin region to life and most importantly helped their team collect important community input.

    For more great tips on how to make the most out of MetroQuest, contact our Customer Experience team or reach out for more information!


    * This survey was a target of what is known as ballot-box stuffing, an infrequent but persistent issue where duplicate or fraudulent responses are submitted to skew results or increase changes of winning a monetary incentive offered to survey takers. In this case, it was likely the latter, as a $50 raffle was offered to participants. In total, over 4,000 participants interacted with the survey but many had to be filtered from the final data set, resulting in approximately 400 valid participants. If your organization is considering offering an incentive for your survey respondents, we recommend using local prizes that only someone in your community could use. We have found that non-location-specific rewards such as cash or a gift card to a nation-wide or online retailer often encourage ballot-box stuffing. Rest assured, if ballot box stuffing should occur with your survey, MetroQuest has steps to address it to ensure data integrity.


    Want to learn more about how MetroQuest supports community outreach on your next transportation plan? Check out our recent webinar:
    The Key TO Great Public Engagement Results:
    How KYTC Engaged 8300+

    The Kentucky Statewide Transportation survey collected more than 140,457 public responses and comments in just over a month! In this webinar, the team shares the complete process that led to this public engagement success.


    WATCH WEBINAR


  • [SURVEY OF THE MONTH] How Virginia DOT is Solving Traffic and Safety Challenges with MetroQuest

    [SURVEY OF THE MONTH] How Virginia DOT is Solving Traffic and Safety Challenges with MetroQuest

    The Survey of the Month series is a monthly blog where we highlight the extraordinary work our customers are doing, along with some takeaways that are relevant for anyone interested in making the most out of online engagement using MetroQuest’s survey platform! To see more in the series, visit the blogs here.

    This month, we are highlighting a Virginia Department of Transportation (VDOT) survey that is part of the Woodbridge Area STARS Studies. VDOT identified significant traffic backups and road congestion in the Woodbridge Area during the morning and evening peak times. To identify solutions for alleviating the problems, the study assesses potential safety and operational improvements for the interchange of I-95 and Route 123.

    What’s the story? Comprehensive Transportation Solutions to Relieve Congestion in Woodbridge

    According to the project website, data from a 2019 study showed that over 300,000 vehicles a day use the I-95 and Route 123 interchange. VDOT identified the need for improvement and launched a study to assess reconfiguring ramps, extending lanes, modifying and relocating traffic signals, access management, as well as transit enhancements to improve traffic flow on the interchange. This study is part of a larger initiative called STARS; Strategically Targeted Affordable Roadway Solutions. The objective of the STARS program is to develop comprehensive and cost-effective transportation solutions to relieve congestion bottlenecks and solve critical traffic and safety challenges throughout the state of Virginia.

    They created MetroQuest Surveys in English and Spanish to gauge community priorities and collect opinions around the suggested solutions.

    To learn more about the project, please visit the Woodbridge Area STARS Studies website.

    Anatomy of a Corridor Survey: Using MetroQuest to Understand Community’s Preferences

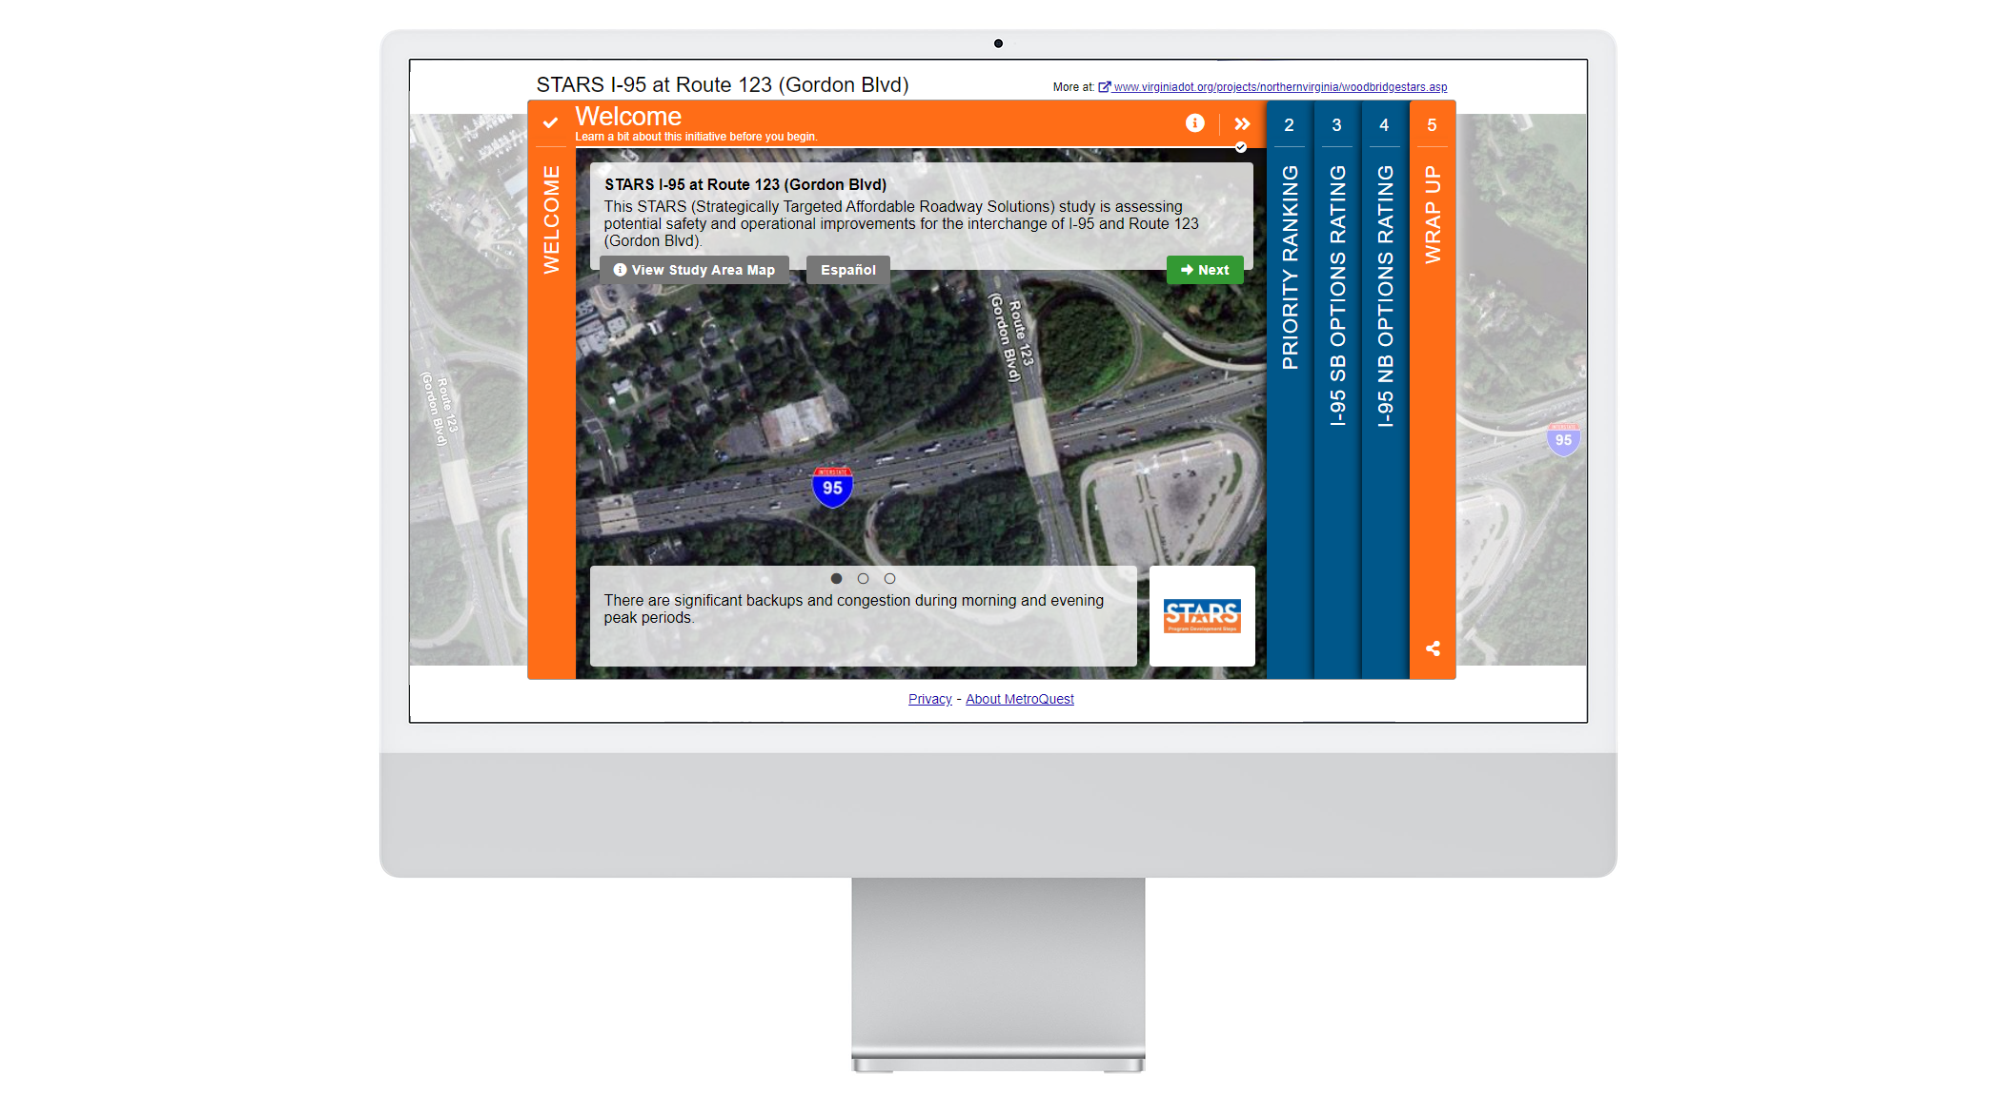
    The I-95 and Route 123 Survey starts with the Welcome Screen, containing an aerial photograph of the interchange. This is a fantastic way to captivate the visitors as they can concisely read the study’s background information to quickly grasp its intention and its relevance to their lives.


    Like many other successful MetroQuest Surveys, the Priority Ranking Screen follows next and is used to identify the visitor’s priorities within the study area. Visitors are asked to rank their top 5 out of 9 possible items. The priorities include significant factors such as congestion, safety, active transportation accessibility, travel time reliability and express lane improvement. Each priority includes a brief and practical explanation.

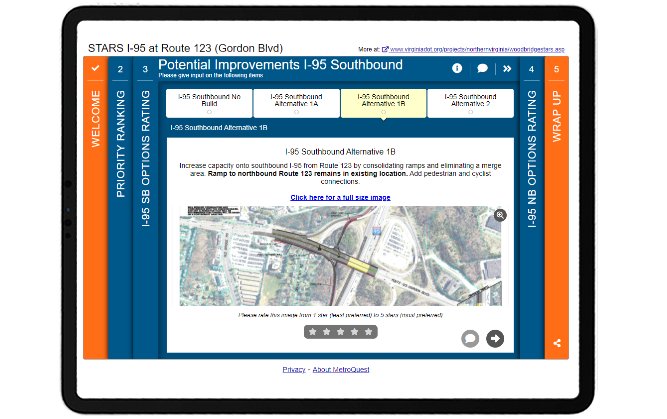
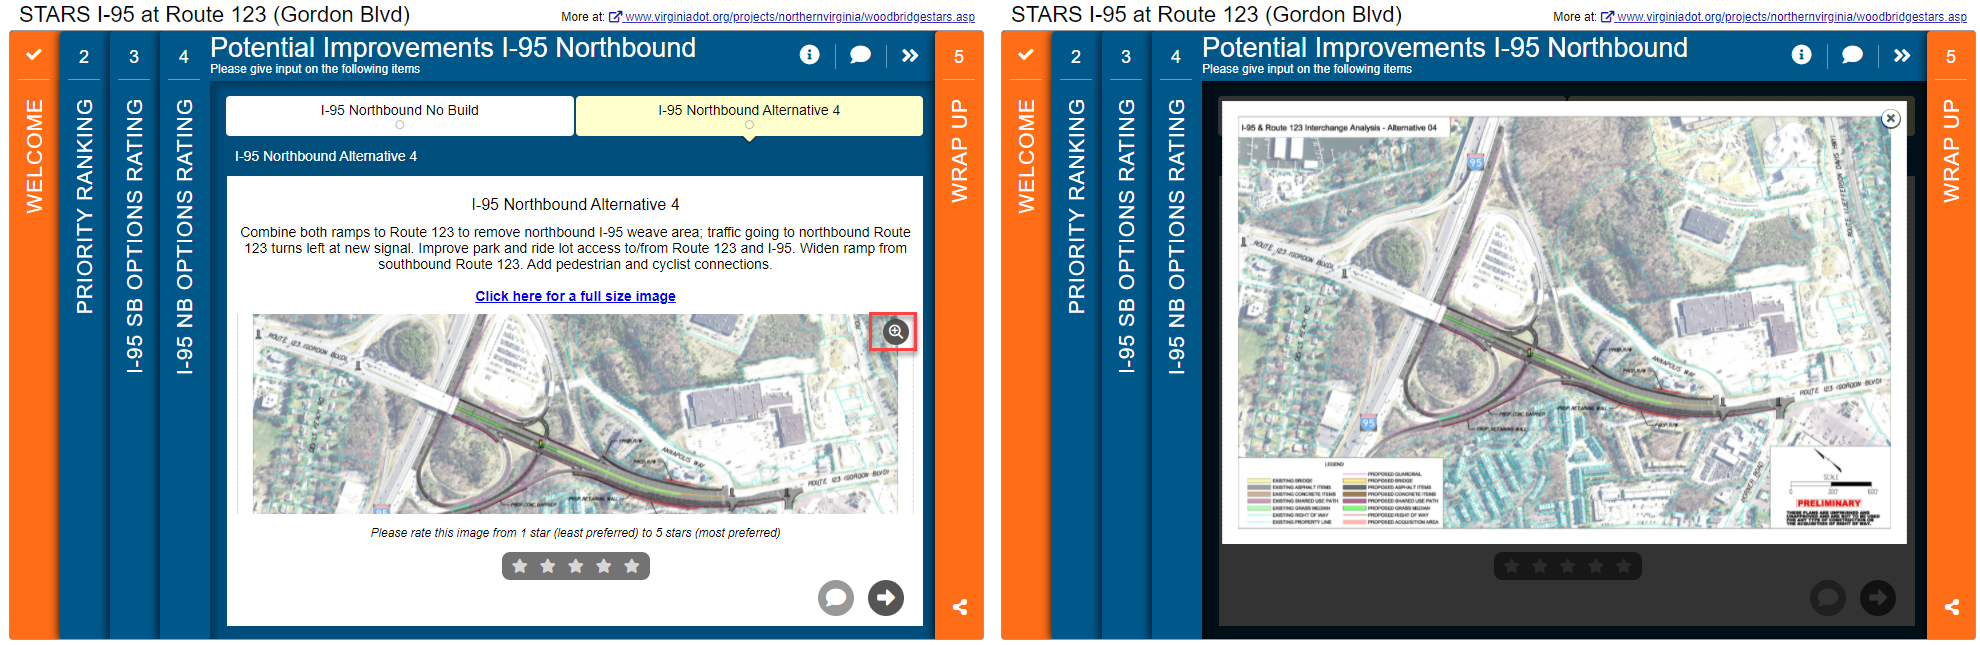
    Two subsequent Image Rating Screens are utilized to present potential improvements for I-95 southbound and northbound. Each option has an image, a description of the improvement required and the predicted outcome. Participants are asked to rank each potential improvement on a 5-point scales and provide input as possible solutions with various outcomes.


    MetroQuest Survey is designed to be non-linear, meaning that visitors can jump around, move backward to re-read and change their answers. The combination of the non-linear design and the Image Rating Screen plays a significant role in VDOT’s Survey, allowing the visitor to inspect and compare various suggested options in any order they prefer and make an informed decision before providing input.

    Please feel free to try the MetroQuest Survey. This is a demo version that will not affect the survey results.

    5 Tips from VDOT’s STARS I-95 and Route 123 Survey: Simple Yet Effective Ways to Collect Valuable Input

    The STARS I-95 and Route 123 Survey breaks down complex material into comprehensible material by educating visitors, asking them to first rank their priorities before going into more detail into the priorities with possible solutions and various outcomes. VDOT engaged over 1200 participants by using multiple channels of outreach, with campaigns such as news releases to the media, targeted paid Facebook advertisements, organic Twitter posts, and email blasts.

    Below are 5 key takeaways from their survey:

    1. The Welcome Screen draws visitors into the survey with an appealing aerial photograph of the study area and contextual information. The aerial image and the extended background features catch the visitor’s attention without being overly distracting. The rotating sliders at the bottom of the screen are used to convey essential project information.
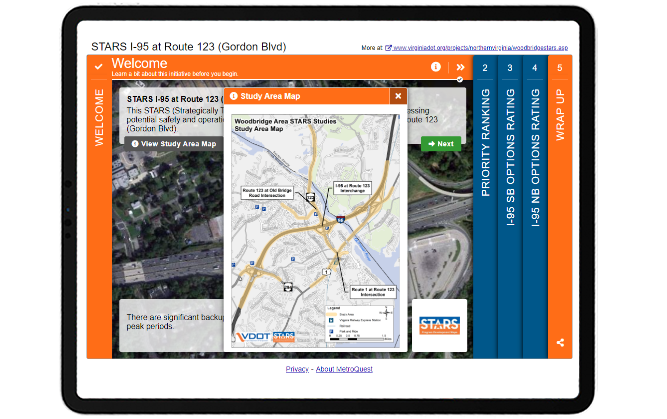
    2. On the Welcome Screen, the extra popup is adequately utilized to include the study area map to inform visitors visually where the study area is. Using image maps are effective when the information you need to convey is better presented visually than in text. Image maps deliver a large amount of information in a small space and serve to make them more interactive.VDOT_STARS-I-95_Welcome Screen
    3. As mentioned earlier, the I-95 and Route 123 study is part of a larger program called STARS, which involves planners, traffic engineers, safety engineers and roadway engineers to jointly implement innovative and practical solutions. The STARS branding logo and the branding colors and the branding colors, orange and blue, are used to elicit a sense of pride in the region and are used throughout the Survey for brand recognition.
    4. The Image Rating Screens include an image, text-based description of required work and the outcomes. This is an excellent use of the Screen features to allow participants to view the differences between the alternatives so that they can provide informed input. The visitors have two options to zoom into the images to view more details:
      a) When the magnifying glass icon on the top right corner of the image is clicked, visitors can view a larger image without leaving the Survey. Keeping the participants in the Survey until the end will help you achieve a higher completion rate.VDOT Survey screen 4with the magnifying glass iconb) The hyperlink text “Click here for a full-size image” opens a new tab in the browser to open a much larger image that fills up the screen. In this case, it is essential to include the hyperlink as the participants are presented with complicated map images with legends to digest.
    5. We do not typically highlight the Wrap Up Screen, but in VDOT’s Survey, the simplicity of their team’s demographic questions, used to collect necessary information for their study, is one of the key takeaways! They ask simple yes/no questions about whether they live or work near the study area and the home and work zip codes. To ensure your Survey reaches a diverse population, it is recommended to include demographic questions such as gender, age, race, and income. We often notice that most surveys ask for personal information such as email addresses and home addresses, but you should try as much as possible to avoid collecting personal data. Asking for the participant’s email address as a demographic question is a turn-off for the participants who believe they are doing you a favor by answering your Survey. This practice also assures the anonymity of survey responders.

    Congratulations to the team at VDOT for another successful MetroQuest Survey with an outstanding turnout for their corridor study!

    For more great tips on how to make the most out of MetroQuest, contact your Customer Experience manager or reach out for more information!

    Want to learn more about how MetroQuest supports community outreach on your next transportation plan? Check out our recent webinar:


    The Art and Science of Virtual Public Engagement for Transportation Planning

    The Art and Science of Virtual Public Engagement for Transportation Planning

    The road to success with online surveys is part art and part science. This webinar explores both by unbundling the most successful case studies and what made them so effective. Learn how to create delightful surveys that engage 1000s and deliver the results you need to support a wide range of transportation plans!


  • [SURVEY OF THE MONTH] Our City, Our Voices – Comprehensive Planning for today and the future with the City of Nanaimo

    [SURVEY OF THE MONTH] Our City, Our Voices – Comprehensive Planning for today and the future with the City of Nanaimo

    The Survey of the Month series is a monthly blog where we highlight the extraordinary work our customers are doing, along with some takeaways that are relevant for anyone interested in making the most out of online engagement using MetroQuest’s survey platform! To see more in the series, visit the blogs here.

    This month, we want to highlight a comprehensive plan in an earlier stage of planning for Nanaimo, a harbour city on the east coast of Vancouver Island in British Columbia, Canada. LANARC Consultants are helping the City and its Mayor with an initiative to engage the community to receive great ideas and collectively create a vision and road map for their city’s future!

    What’s the story? A path to the future, together!

    The City of Nanaimo currently has a population of 100,000. By 2045, they estimate 140,000 people will live, recreate and work there. Nanaimo’s Mayor and Council introduced REIMAGINE NANAIMO, an initiative to collectively imagine how the spaces and places of the city can evolve to better meet the needs of the natural environment and the people.

    REIMAGINE NANAIMO is part of a multi-phase comprehensive plan. The initial phase gathered ideas by sharing information and listening to resident’s views about the city’s future. Now, the city is developing options for achieving its shared vision and is evaluating ways to support the goals.

    The Survey had incredible outreach campaigns working with influencers on various social media platforms to reach diverse demographics. They engaged 1539 participants with 20906 data points. Because of the Survey’s fun and informative components, which we will talk about below, REIMAGINE NANAIMO achieved an impressive participation rate of 64% meaning at least 1 out of 2 visitors shared their input; a typical Survey obtains around 20 to 30% participation rate. They could not be happier with the results!

    To learn more about the project, please visit the project website here.

    Anatomy of a Comprehensive Plan Survey: Priorities, Scenario Exploration, and Scenario Building

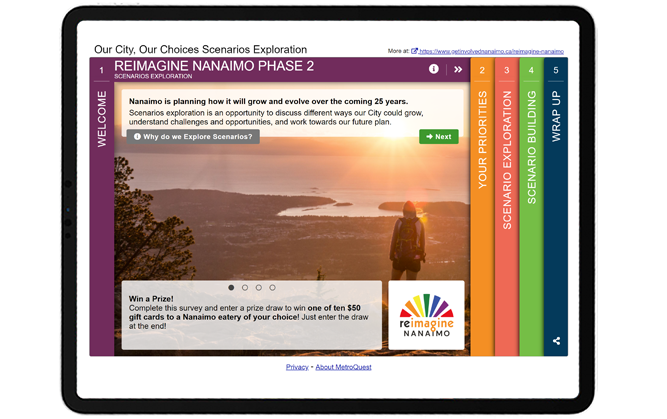
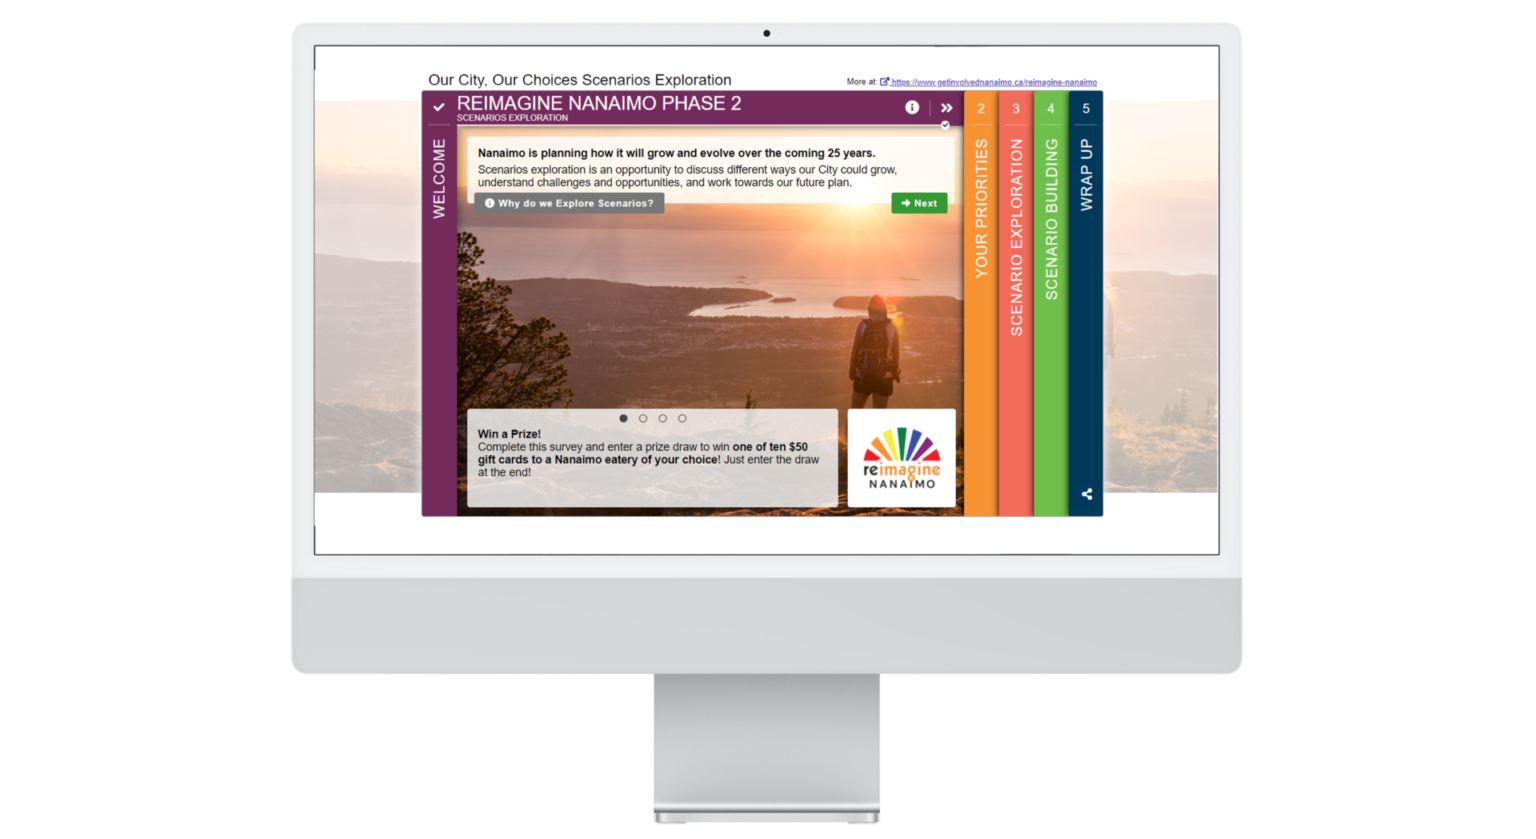
    When visitors open the Survey, they are welcomed by the beautiful scenery of a hiker overlooking the city, a short introduction of their project and information on the significance of their input on the Welcome Screen.


    Anatomy of a Comprehensive Plan Survey: Priorities, Scenario Exploration, and Scenario Building


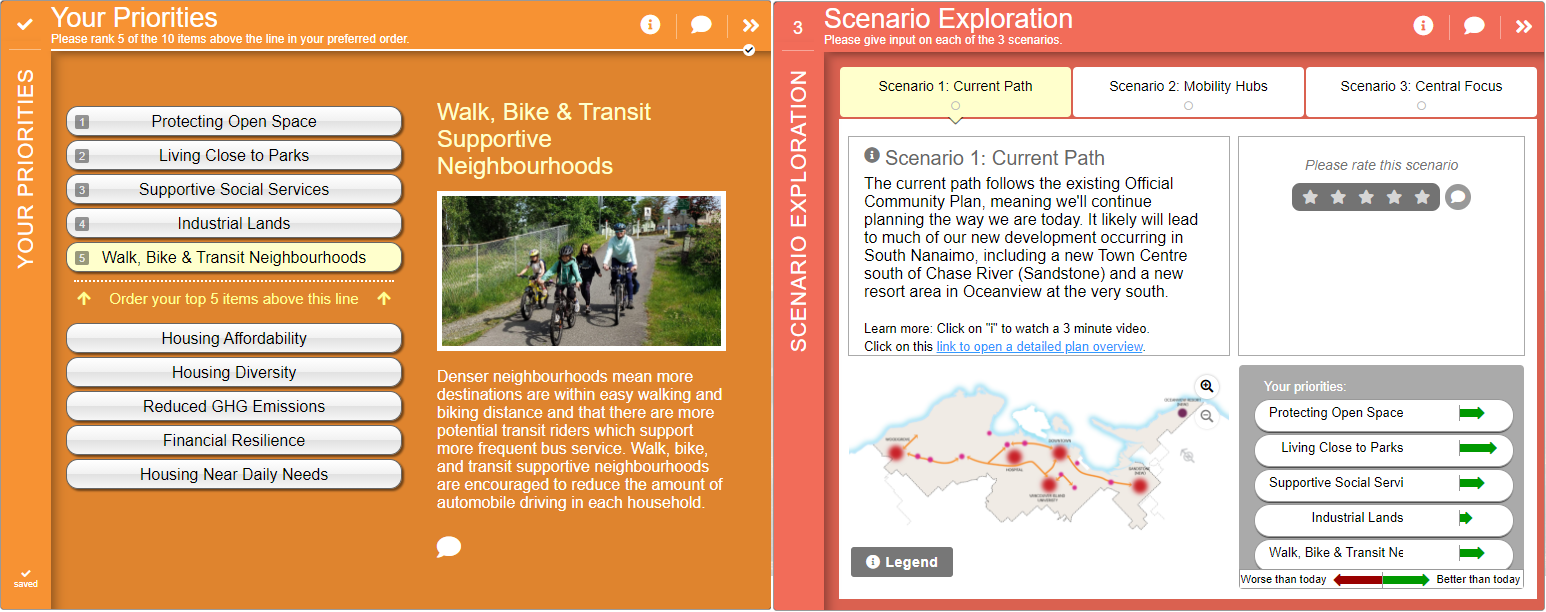
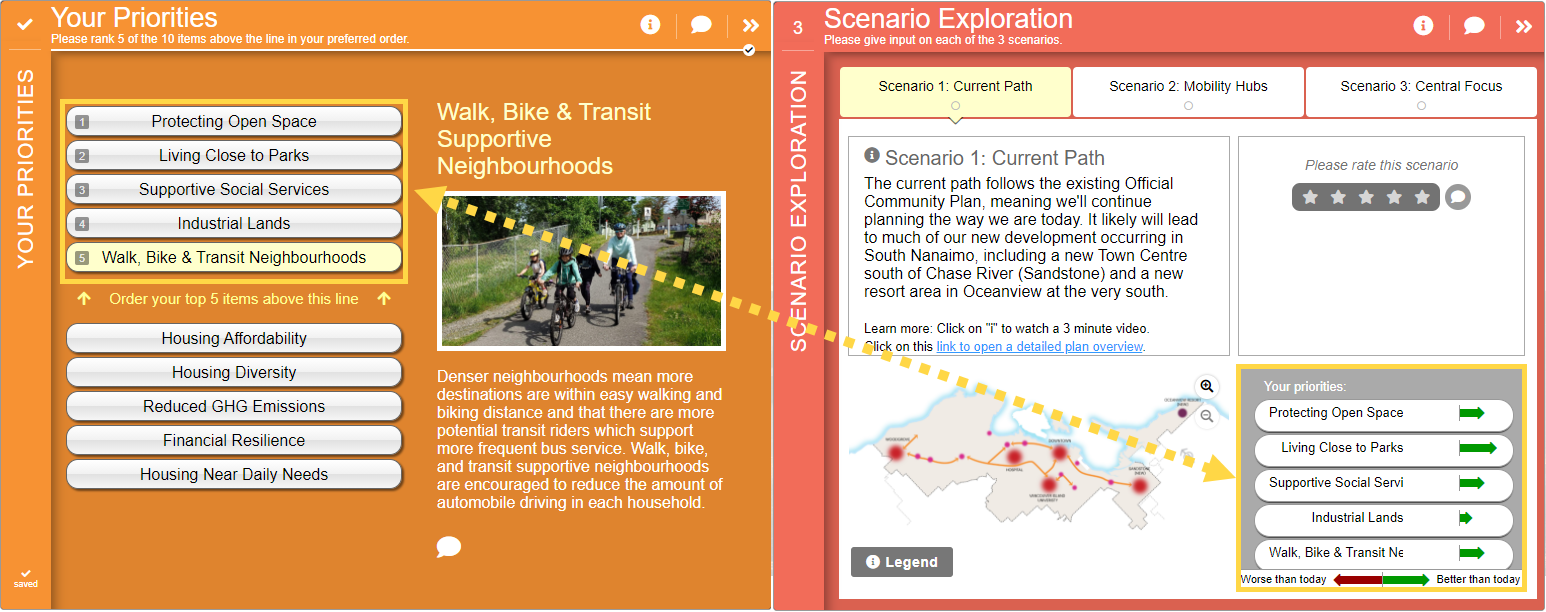
    On the following Priority Ranking Screen, participants are asked to rank their top 5 priorities out of a list of 10 related to transportation, economy, housing and natural environment. The selected top 5 priorities are shown on the following Screen, the Scenario Rating Screen, where participants are asked to explore 3 different scenarios: Current Path, Mobility Hubs and Central Focus.


    By showing the priorities with as metrics, participants can discern which scenario performs best given their priorities and make informed decisions! The participants can familiarize themselves with the project by viewing the detailed plan overviews in PDF and short videos.


    On the next Screen, the Map Marker Screen, the participants are asked to provide input on the types of destinations that they feel are missing in Nanaimo by dropping makers on a Google map. The marker types to choose from were “Tall Buildings”, “Infill Neighbourhoods”, “Shops & Services”, “Community Amenities”, “Support Services”, “Active Trans & Transit” and “Other”. Each marker has dropdown options and a comment box for the participants to provide more in-depth input.

    Finally, the Wrap Up Screen asks a few demographic questions, thanks the participant and allows them to enter in a prize draw for a local eatery.

    We encourage you to try the Survey by clicking here. This is a demo version that will not affect the survey results.

    5 Tips from the ‘Our City, Our Choice: Scenarios Exploration’ Survey: Simple call-to-action with informative videos and additional resources

    Nanaimo is a beautiful place and the decision makers care about community engagement and the public’s role in shaping the city’s future. They put together an engaging MetroQuest Survey with many takeaways. Below are just 5 tips from their survey that you can use on your next project:

        1. On the Welcome Screen, the visitors are greeted with an extended background image of the breathtaking scenery of Nanaimo. The positive impression created by the captivating visuals encourages the visitors to continue their survey participation . The positive survey experience results in a higher survey completion rate!
        2. Location-specific survey participation incentive. You may have considered providing incentives for the public to complete the survey in the form of a reward draw for anyone who enters their contact information. LANARC Consultants and the city offer a reward “one of ten $50 gift cards to a Nanaimo eatery of your choice”. It’s recommended to consider using a reward that only community members can use, such as to a local retailer, to avoid ballot box stuffing!
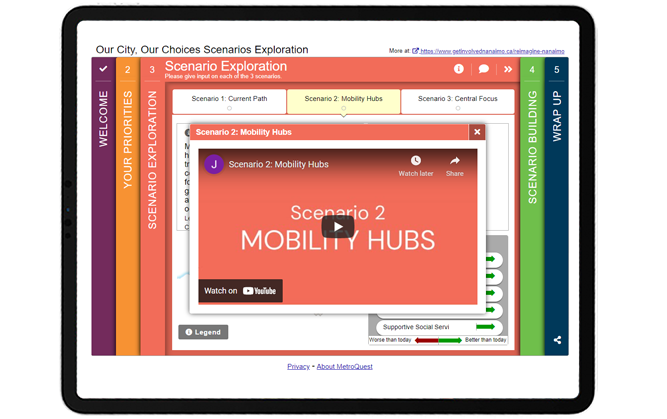
        3. Short educational videos and other resources were presented in the Scenario Rating Screen. You can accommodate different learning styles by providing a variety of resources such as videos, PDFs and images. A study found that the human brain processes an image 60,000 times faster than text. By including visually appealing resources into your survey, participants can process the information and data better and more quickly!
        4. Connected indicators to help participants make informed decisions. Explaining scenarios can be a complex undertaking, making the Scenario Rating Screen one of the more time-consuming Screens. After identifying prioirites in the first screen, connecting the indicators in the scenario exploration screen helps participants understand how various indicators perform on the different scenarios, emphasizing which scenario would likely work better in terms of their selected priorities.


      1. Lastly, each marker has easy-to-answer dropdown options on the Map Marker Screen. Participants simply need to click on an option from the list of answers. This reduces the length of the survey and makes it concise, which in turn means more data will be provided. Another advantage of dropdown questions is that they are designed to create easily quantifiable data.

    Congratulations to LANARC Consultants and the City of Nanaimo for an engaging survey using new features and demonstrating best practice for effective online engagement!

    For more great tips on how to make the most out of MetroQuest, contact your Customer Experience manager or reach out for more information!

    Want to learn more about how MetroQuest supports community outreach on your next transportation plan? Check out our recent webinar:

    The Pivotal Role of Public Involvement in the Surface Transportation Bill

    In this webinar, equity and transportation planning experts from Kansas DOT and HDR discuss post-padnemic recovery, the surface transportation bill, and how agencies can prepare a winning strategy!


  • 4 Survey Examples to Inspire your Next Transportation Plan Study

    4 Survey Examples to Inspire your Next Transportation Plan Study

    Community surveys can be a mixed bag in terms of effectiveness. Practitioners in planning, and transportation planning in particular, can have a difficult time catching the attention of their community when there are so many other things competing for their attention. But when done well, online community engagement can have a profound and meaningful impact on your project. With an eye toward the best examples of online surveys that achieved great results, let’s take a look at 4 different survey examples that will inspire your next transportation plan study. If you know what you’re looking for, feel free to jump ahead to the type of survey you need: 

    Planning Ahead: Survey Examples for Long Range Transportation Plans

    Long range transportation plans are all about learning the growth patterns and opinions of the community now, and gathering insight into how projects can meet growing demands of the future. 3 elements to consider when developing an online survey for LRTPS: 

    1. Gathering input early in the process. This will help generate interest and knowledge in the project, as well as help your planners identify community priorities. 
    2. Maintaining communication with the surveyed population over time. This could be done through post-survey reports, announcements… or even a follow up survey. 
    3. Giving context! Particularly because the results of the survey won’t be enacted for years to come, give context around existing plans, the latest update, and what you’ll do with the information afterward.

    In Treasure Valley, located in Southwest Idaho, the Community Planning Association (COMPASS) foresaw rapid population growth in their area over the next 30 years, and thus needed a way to understand how their citizens were currently using the transit system, as well as fine-tune a transit option that would suit the population now, as well as while it grew.  This survey example is actually a 3-in-1 example. COMPASS used a series of three surveys to first identify the public’s opinions on the future; get opinions on 4 scenarios derived from the results of the first survey; and finally do a deep dive into the scenario that proved most popular in the second survey.

    If you’re curious about how these surveys worked out (spoiler alert: very, very well) visit COMPASS’ case study for the full story!

    Mobility Options: Survey Example for Route Scenario Planning 

    How do you show different scenarios to the community, while conveying all the pros, cons, and tradeoffs that need to be made for each one? Scenario planning can be complicated, especially when it comes to gathering public input and identifying the option with the most public support! 

    3 elements to consider when developing an online survey for scenario planning 

    1. Showing the benefits and drawbacks of each option clearly. Your participants need to clearly understand the stakes.  
    2. Cutting out irrelevant details for clarity. What details do participants need to know to make an informed decision?  
    3. Anticipating additional options. Sometimes the community has different ideas for the region! Give participants a chance to provide input on their priorities in general. 

    Texas Department of Transportation (TxDOT) needed to ease the congestion around the city of Seminole, a major hub and important transportation corridor. The roadway provides access for the region’s agricultural industry as well as the energy sector, and faced mounting pressure and increased use. TxDOT wanted to gauge community properties and identify the best option out of the several that the agency had identified. 

    This survey example is a great one because it approaches the problem of conveying scenarios by giving participants two different activities to consider the same three scenarios. Take a look at the example survey below to see how that helps illustrate the options clearly and effectively.  

    Updating the Future Vision: Survey Example for Metropolitan Transportation Plan

    Federal mandates around updating Metropolitan Transportation Plans (MTP) mean that this form of transportation planning can take up a lot of resources. Particularly with a public engagement element, a well–designed online survey can make the process easier. 

    3 elements to consider when developing an online survey for metropolitan transportation plans

    1. Setting expectations for participants. With regular plan updates necessary, creating routine or consistent engagement opportunities can improve participation rates over time! 
    2. Efficiently utilizing resources. With the regularity of MTP updates, consider dedicating some resources into developing the skills and tools you’ll need time after time. 
    3. Developing branding. If you’ll be regularly engaging the same community, it’s a good idea to establish a consistent and memorable brand—even if it’s just colors and a logo. 

    In Louisiana, the Capital Region Planning Commission (CRPC) in Baton Rouge focuses a large part of its resources on updating the Metropolitan Transportation Plan every four years. By regularly updating a vision of future transportation, they’re able to coordinate with local governments and key stakeholders to ensure that projects support existing priorities in the region. 

    This survey is beautifully designed, with well thought out placement of key information and interactive methods of gathering input. The team was familiar with the survey platform and used their expertise to build a very engaging survey, including a budget game to demonstrate resource tradeoffs, and a map to collect geospatial data around the region’s biggest transportation needs.


    Environmental Factors: Survey Example for Planning and Environmental Linkages
     

    With a focus on environmental aspects, Planning and Environmental Linkages (PEL) studies are a crucial part of transportation planning, particularly because of its impact on the National Environmental Policy Act (NEPA) environmental review process.  

    3 elements to consider when developing an online survey for PEL studies 

    1. Establishing data requirements. As an inter-agency study, it’s important to keep on top of each agency’s particular data needs.   
    2. Designing surveys with the outcome in mind. PEL studies have direct impact on how agencies plan transportation projects!  
    3. Developing realistic timelines. Although PELs minimize duplication of efforts between planning and NEPA processes, the additional stakeholders involved can complicate deadlines.  

    The Michigan Department of Transportation, working with AECOM, created this survey for a PEL study around Grand Rapids and Wyoming. The purpose was to evaluate improvements for a section of the US-131 around the conditions and safety of the corridor, as well as local needs, community development and economic growth.  

    The survey was developed in response to comments received during the initial study process. The team used clever methods to maintain data integrity throughout the survey, including limiting certain answers to drop-downs or multiple-choice, and designing the complex questions to feel short and not-overwhelming. 


    For more information, the Federal Highway Administration has some excellent resources on the 
    Planning and Environment Linkages page.


    What types of surveys would you like to see examples of next? Let us know in the comments! 


    To learn more about using online surveys to support your next transportation project, contact us for more survey examples or watch our recent webinar on-demand: 

    The Art & Science of Effective Online Surveys for Planning

    The Art & Science of Effective Online Surveys for Planning 

    The road to success with online surveys is part art and part science. This webinar explores both by unbundling the most successful MetroQuest surveys and what made them so effective!