Earlier this summer, we introduced the Survey of the Month blog where we shine the spotlight on a particularly great example of a MetroQuest survey that was created by one of our users. These surveys lend themselves well to highlight take-aways applicable to other users and surveys. Transportation planning has always been on the forefront of MetroQuest customers’ minds, and we are excited to highlight a corridor study survey to inspire you with the fantastic work other agencies and firms have done!
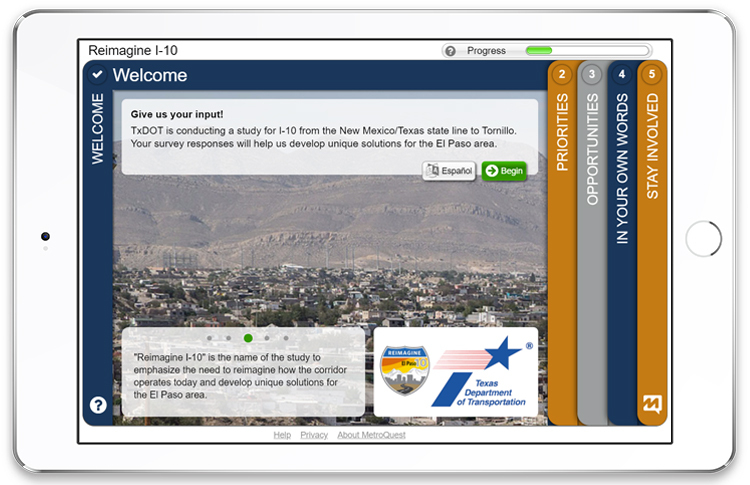
This corridor study was created by the Texas Department of Transportation (TxDOT). The planning study focuses on a segment of the I-10, namely from the Texas-New Mexico border to Tornillo, and uses a MetroQuest survey to inform and survey the public in an engaging way. Read on to learn what they did and what you can take away from their survey!
What’s the story? Understanding Future Transportation Needs of an Important Corridor
TxDOT created the “Reimagine I-10″ survey to kick off an advanced planning study for a part of the I-10, which is the southernmost cross-country highway in the American Interstate Highway System. The highway spans major cities from California, Arizona, and Texas, to New Mexico, Louisiana and Florida. The study was created to analyze and evaluate current and future transportation needs for a specific section of the I-10, the Greater El Paso corridor.
The study area contains five US and Mexican ports of entry and is undergoing significant growth and development yet has limited alternative route options due to its unique geography. This puts additional pressures on an already busy corridor.
Therefore, Reimagine I-10 was created as a feasibility study to find options to relieve pressures on the corridor and look at operational, corridor wide, and technological improvement options. Within each of these three levels of considerations, various solutions were studied.
For more background information, please visit the website.
Anatomy of a Survey: How the Reimagine I-10 Study Makes the Most of MetroQuest’s Capabilities
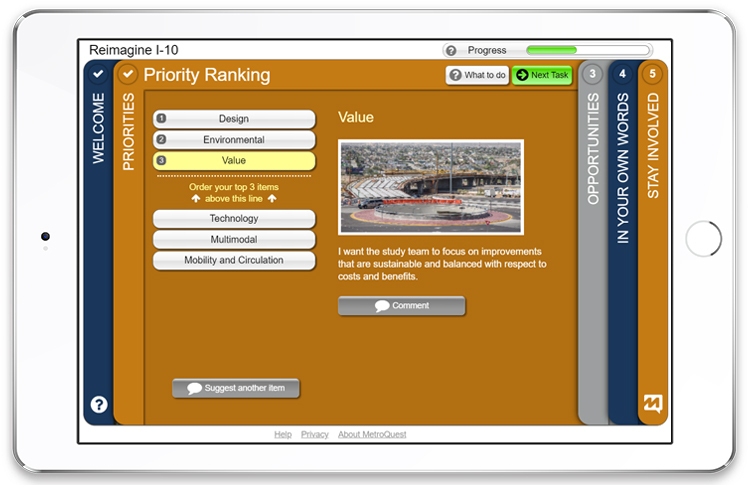
The Reimagine I-10 MetroQuest survey contains 5 Screens: after introducing the project and providing background information, the survey provides participants with the opportunity to decide what TxDOT should consider when developing potential improvements. They are asked to rank their top three priorities from a randomized list of six, namely Technology, Multimodal, Environmental, Mobility and Circulation, Design and Value. This first activity helps TxDOT understand participants’ priorities and, in addition, sets the stage for the second exercise.
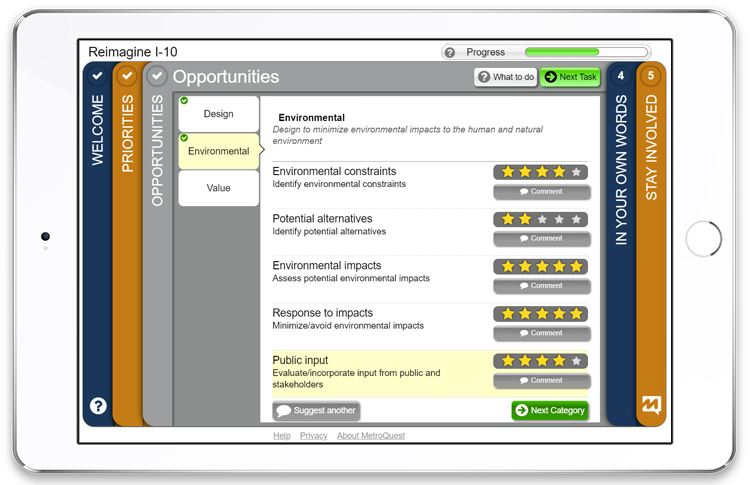
On the follow-up Screen, participants are asked to provide more details on the priorities they chose on the first Screen, and rate strategies associated with each priority on a 1-5 scale. Between three and five strategies are presented for each of the categories previously picked as top priorities. Connecting the two Screens like this gives participants a tailored experience – more on this later!
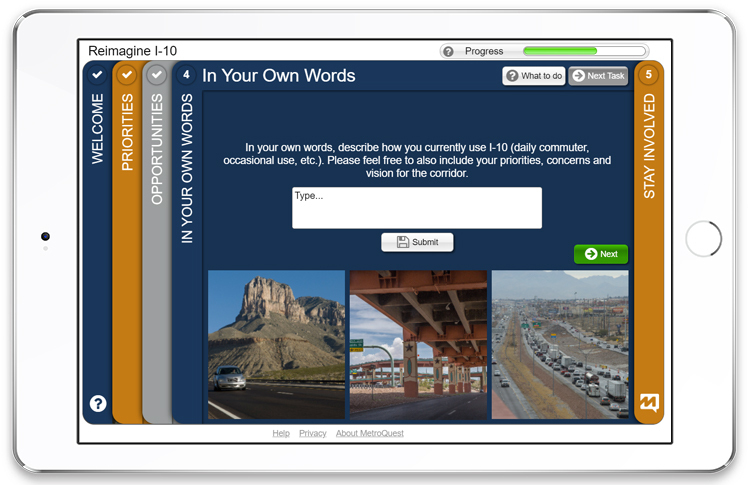
On the third Screen, participants are asked to describe in their own words how they currently use the I-10 Greater El Paso Corridor, be it for commuting, occasional use or similar. The free form textbox also allows participants to list priorities, concerns, their vision or bring up other items the survey hasn’t covered. In typical fashion, the survey ends with a few demographic questions and a thank you message.
5 Tips from Reimagine I-10: Using MetroQuest’s Linked Screens to Make a Tailored Experience and Gather Meaningful Data
The Reimagine I-10 survey makes the most of MetroQuest by creating a customized and straight-forward experience. Below are five takeaways from the survey:
On the Priority Ranking Screen, TxDOT limited the list of possible priorities to six and asked participants to rank just their top three. By limiting the number of priorities that can be selected, they ask that participants really consider what is truly important to them. The lower number also has a second benefit when using connected screens.
The Priority Ranking Screen is connected to the Strategy Rating Screen, meaning the priorities that a participant identifies as their top choices in the first activity are presented as the categories in the second activity. This gives the participant a tailored experience, as it asks them for additional input on their top three categories. Not only does this give the survey a tailored feel, but it also saves time, gives a more straight-forward experience, and collects more meaningful data.
On the strategies, TxDOT opted to include a comment button for each of the strategies which is a great opportunity to ask for more input on topics already identified as important to the participant.
The strategies purposefully have both a title and a short description. Titles allow for an initial level of understanding at a quick glance while longer descriptions go into more detail on items that are interesting to participants.
The third activity TxDOT chose is the Vision Statement Screen which allows for text input. This Screen is a great choice as it captures ideas and concerns, and the result are put into a useful word cloud in the Data Center. This can be particularly useful at an early stage of a project as it allows for blue sky thinking which may lead to new ideas, strategies, or opportunities.
For more tips on how to make the most out of MetroQuest, contact your Customer Experience manager or reach out for more information!
Want to learn more about how MetroQuest supports your projects to help plan for your community’s transportation future? Check out our recent webinar!
Indianapolis MPO’s Formula for Actionable Public Input on Bike, Ped & Transit
In this webinar, Jen Higginbotham at Indianapolis MPO shares her step-by-step formula for engaging the public in alternative transportation planning using both online engagement and traditional involvement methods!
In June, we introduced the Survey of the Month blog: a particularly great example of a MetroQuest survey created by one of our users. We’re excited to share the take-aways to help with your next public engagement survey! While MetroQuest subscribers have no shortage of great public engagement surveys of all plans and project types, this month we’re showcasing a transportation survey to inspire your next MetroQuest survey!
We are excited to highlight a Metropolitan Transportation Plan (MTP) in North Carolina, for a Goldsboro Urban Area project under the subscription of the North Carolina Department of Transportation (NCDOT), in cooperation with Kimley-Horn. Read on to learn more about an exceptionally well-done MetroQuest survey for the ever-important purpose of transportation planning!
What’s the story? Updating Goldsboro’s 30-year plan to meet competing needs
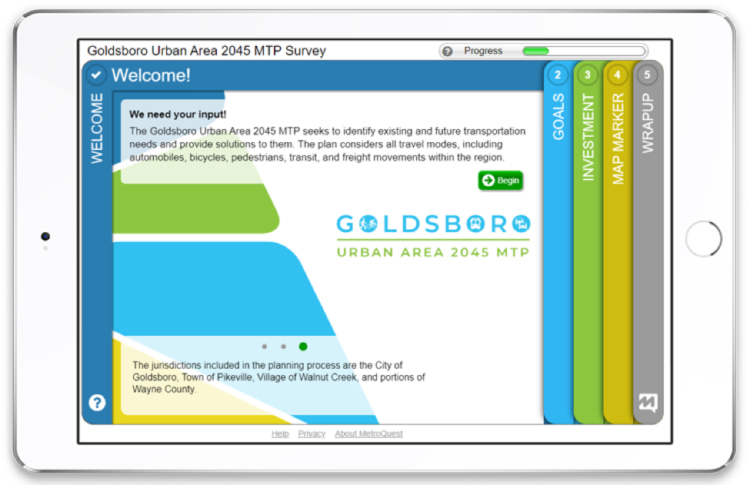
The Goldsboro Urban Area 2045 MTP (Goldsboro MTP) was created to identify current and future transportation needs as well as solutions to address them. The plan is inclusive of all modes of transportation, including driving, biking, walking, transit, and freight movement, to guide multimodal improvements to the current network. The data generated by Goldsboro MTP’s community outreach campaigns will be used to update the previous plan, which was adopted in 2014.
Goldsboro MTP is a collaborative effort involving a Steering Committee, stakeholders, staff and elected officials, the NCDOT, as well as the Federal Highways Administration. Public input was gathered through the Committee, using both stakeholder interviews and workshops, as well as the MetroQuest survey. This allowed for input from residents of the City of Goldsboro, Village of Walnut Creek, Town of Pikeville, and Wayne County to understand regional feelings and concerns regarding transportation in the area. This feedback, along with stakeholder discussions and technical analysis, allowed the team to make a comprehensive multimodal plan that improved existing roadwork as well as meet growing demand for all types of multimodal facilities.
Anatomy of an MTP Survey: How NCDOT Brilliantly Uses MetroQuest to Understand Residents’ Priorities
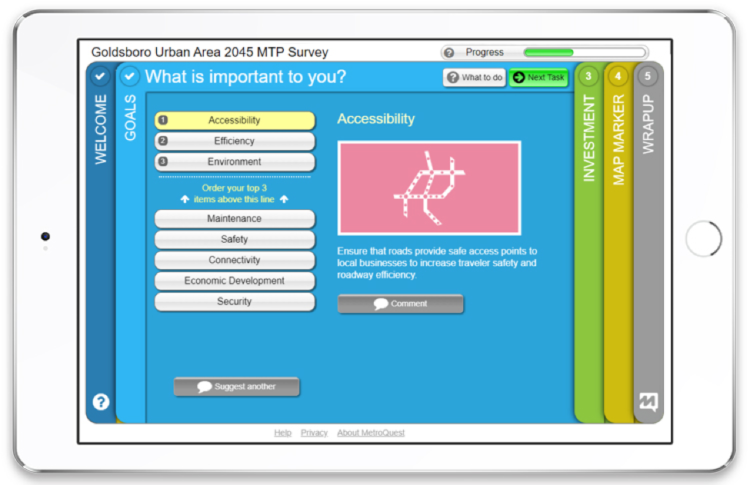
The Goldsboro MTP survey contains 3 main data collection activities: after introducing the project and providing background information, the first Screen provides a randomized list of eight possible goals, namely Maintenance, Accessibility, Environment, Security, Efficiency, Connectivity, Safety, and Economic Development, and the participant is asked to rank their top three in order of importance. This activity was designed to help set the direction of the multimodal transportation plan by understanding the residents’ top priorities. Safety was identified as the number one priority – in particular, facilities for bicyclists and pedestrians that make biking and walking safer were important to respondents.
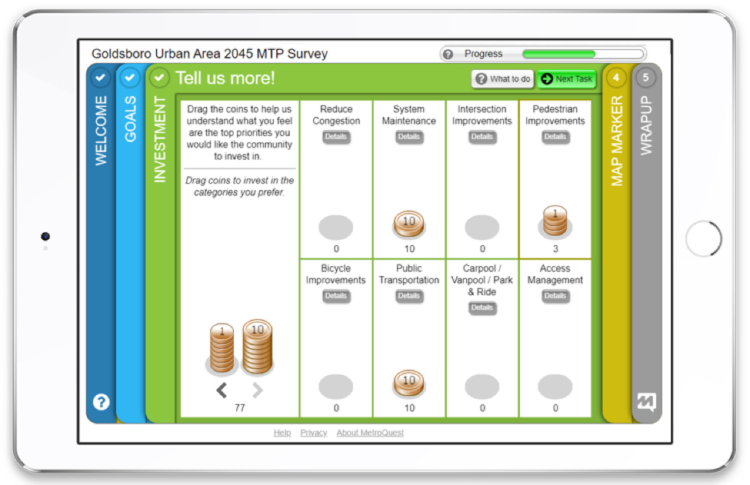
On the second Screen, participants are presented with a stack of coins equaling an imaginary 100 dollars and are asked to distribute any or all coins into eight categories of projects: Reduce Congestion, System Maintenance, Intersection Improvements, Pedestrian Improvements, Bicycle Improvements, Public Transportation, Carpool/Vanpool/Park & Ride, and Access Management. This interactive gamification of a budget prioritization for the MTP not only helps to further define priorities, but also visually presents the reality that funds are limited and not all types of projects can be prioritized equally or at the same time. By gamifying the complexity of tradeoffs, the Goldsboro MTP Survey educates the participant and, therefore, collects more informed input. More on this later! Pedestrian Improvements was the category that the most hypothetical funds were allocated to.
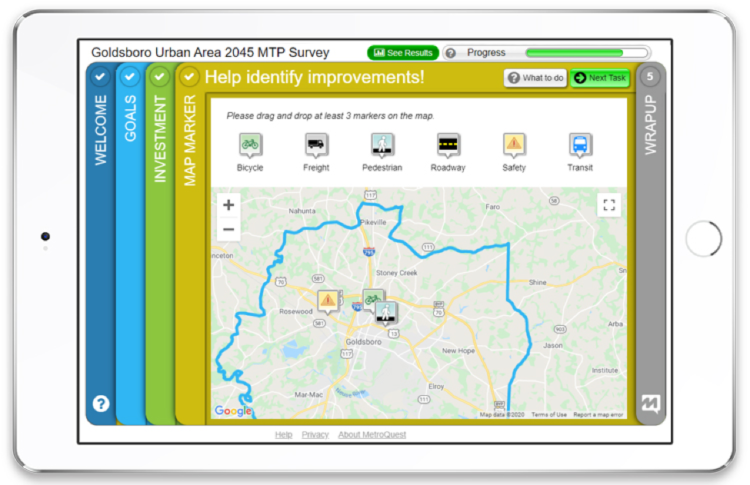
To help identify improvements spatially, the next Screen asks participants to identify infrastructure needs by dragging markers to specific locations on a map and answering the corresponding drop-down questions. The marker topics are Bicycle, Freight, Pedestrian, Roadway, Safety, and Transit, and each follow up question asks the participant what is needed at the location, or to identify what the issue is. In typical fashion, the survey ends with a few demographic questions, which helps agencies and firms understand the demographic composition of the survey respondents, as well as a thank you message.
5 Tips from Goldsboro MTP: How to Make a Compelling Online Public Engagement Survey for Transportation Planning
The Goldsboro MTP survey makes the most of MetroQuest by combining data collection with education, leading to informed input and planning that supports community priorities. Below are 5 takeaways from their survey:
Upon landing on the survey, the participant immediately sees the branding of the project, from the project logo colors used throughout the survey from the logo included in the background. It makes the project recognizable and ties in the survey as part of the MTP. Besides –a designer worked hard on the colors and logo to make it visually appealing, so why not take advantage of that?
The Priority Ranking Screen is a great Screen to use for your first interactive activity as it provides a nice “warm-up” for participants and generates incredibly useful data on what is important to participants. To ensure it is a straight-forward activity, the survey spotlights priority items, in this case different MTP goals, using simple and concise language that is easy and quick to understand.
Supporting each item on the Priority Ranking Screen with an imagehighlights the topic, provides additional context and clarification, and appeals to visual learners. However, it can be challenging to find the right images to enhance items, and they can visually clutter up the Screen. The team behind the Goldsboro MTP survey solved this beautifully by using icons that are easily understood and compliment the titles and descriptions seamlessly.
The coin exercise is a great way to drill down on participant priorities in a fun and meaningful way. It allows participants to play with a fictional budget and understand limitations and tradeoffs. If your project has already allocated certain funds, this can be indicated with silver coins that cannot be moved. If coins are too close to real money for your liking, stars are also an option.
The “Details” Pop Up in the coin game is used wisely in the Goldsboro MTP Survey to present examples of projects under each specific category. For example, under “Bicycle Improvements”, it states that placing coins into this category signifies an interest in investing in bicycle facilitation projects such as bike lanes and greenways. By providing more information and examples, participants are better equipped to make an informed decision, leading to more meaningful data without having to provide a level of specificity that does not typically exist at this phase of a project.
For more great tips on how to make the most out of MetroQuest, contact your Customer Experience manager or reach out for more information!
Want to learn more about how MetroQuest supports community outreach on your next transportation plan? Check out our recent webinar:
Brilliant Public Engagement by Women in Transit Planning
In this webinar, Adrienne Heim and Tracey Lin from the San Francisco Municipal Transportation Agency (SFMTA) show us exactly how they exceeded agency expectations by engaging 8,100 residents, collecting meaningful public input to build a data-driven transit extension study!
Prior to the COVID-19 pandemic, the most common challenge reported by planning agencies was “low participation.” This was particularly evident during public meetings, where the average attendance was just 9 people!
Today, as agencies nationwide are required to comply with mandates and consequently forced to postpone, cancel, or suspend previously scheduled public meetings, many have shifted their outreach efforts exclusively to online platforms. Despite the adjustment, this transition has enabled thousands of planners to reach a larger and broader audience for only a fraction of the cost of the traditional town hall methods.
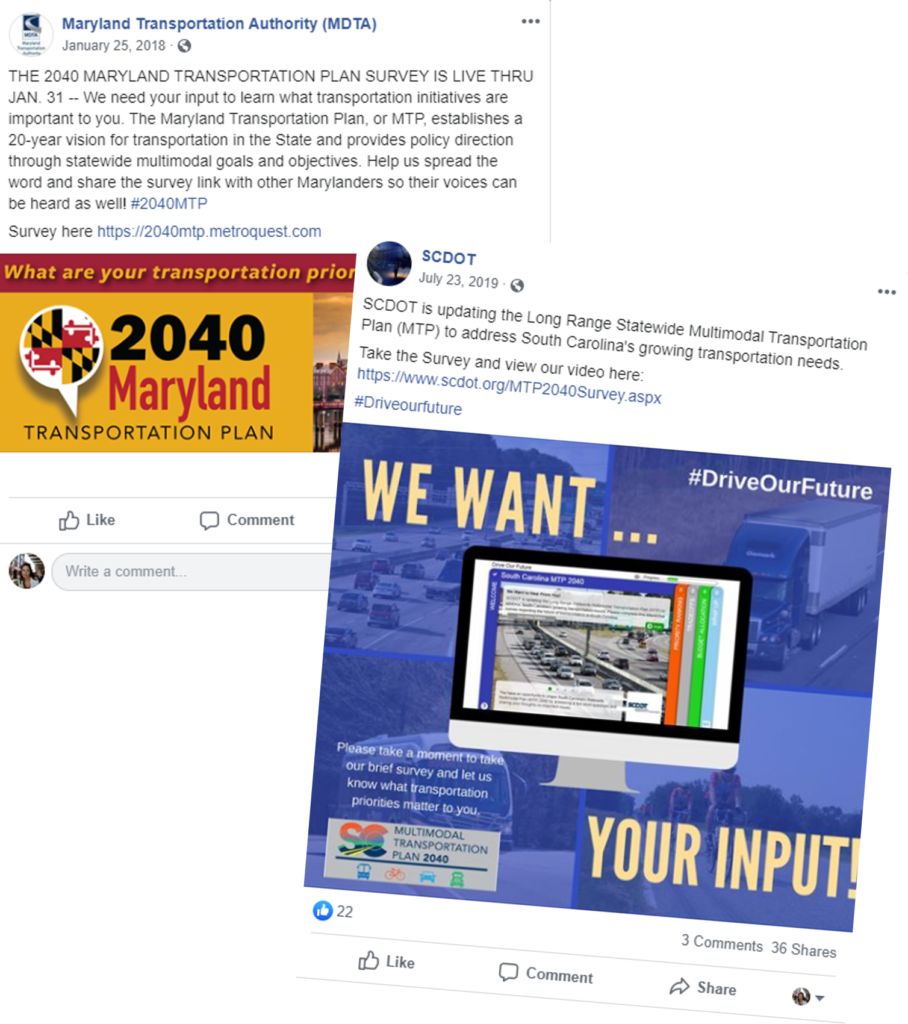
With this change and increasing considerations around online engagement, diversity, and equity, we want to share a successful strategy that we’ve seen repeatedly utilized by our MetroQuest clients. If you want to grow those 9 public meeting attendees into thousands of online public input participants, read on for a how to guide! We’re here to share some of the latest tips on how to maximize the impact of your Facebook presence in order to improve the results of your community engagement campaigns.
Effectively Advertise Community Engagement with Social Media
There are many online advertising tools that are inexpensive and compliment modern survey tools like MetroQuest perfectly. By pairing smart public input software with cost-effective online advertising, agencies have successfully engaged thousands of participants online at a significantly lower price than the conventional advertising methods. The tool Nextdoor is a great example; agencies such as the City of Austin have successfully used it to engage over 5000 residents. Another great tool is Facebook, particularly its paid advertising option called “boosted” posts.
The benefit of using online advertising over traditional methods are wide-ranging, but most importantly it is more cost-effective and allows for a much broader reach. Rather than spending thousands of dollars on print material, digital advertising for community engagement means that you can commission a poster or digital ‘flyer’ and pay the service provider to distribute it. The costs vary by provider, but currently Facebook has some of the lowest “cost per interaction” than any other social media platform.
With solutions like Facebook boosted posts in your toolbox, you can also target your promotions to ensure that you’re reaching your public participation goals. Plus, given that many of your residents are already spending time on Facebook, your reach and impact is improved just by moving onto platforms where your audience already spends their time.
5 Tips for Using Facebook for Excellent Community Engagement
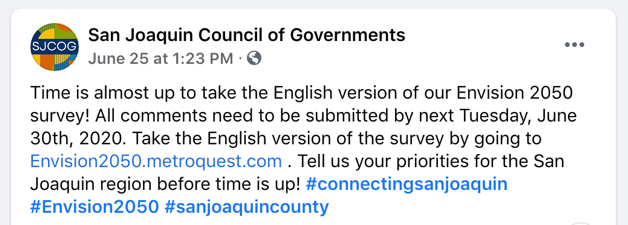
Most likely, social media is already a part of your engagement strategy—great! The first step to online promotions is using your ‘organic’ reach, meaning posting regular updates on your project or agency’s Facebook page so that people who already like or follow your page get updates consistently and instantly!
Here are some tips and reminders for effective posting on Facebook, but they can also be applied to other social media platforms like Nextdoor or Twitter:
Create hashtags specific to the project and include them in each post. Encourage people to use them when they’re talking about the project on their own accounts! Hashtags help residents find, follow, and contribute to the conversation. It also allows you to keep an eye on what is being said about the project.
Review the reactions you receive to your posts and respond to comments where appropriate. Interacting with engaged users goes a long way in helping them stay engaged and feel heard!
The posts’ tone should be relevant, simple, and avoid jargon or acronyms. Be sure that you’re matching the tone of the survey itself! A simple worded survey will help keep participants engaged throughout. If posting more than once, ensure your posts are complimentary to each other and consistent in tone and message.
Create a follow up post that includes a final call to action shortly before the survey closes. Include some initial results or successes to encourage people to share their opinion and have their voice heard as well!
Use images – pictures of people are especially attention-grabbing! You can also use digital flyers that have more information about the project and survey.
How to Create a Facebook Boosted Post to Promote Your Project
First, in order to create a boosted post, your agency needs to have a Facebook page (or at least a page for the project that you’re promoting a survey for), and you have to have permission to post and advertise on the page. For the post itself, you have two options: boost an existing post, or create a new post to boost.
To create a post and then boost it, follow these steps. If you already have an existing post to boost, start from Step 3!
Go to your Facebook Page. You do not need to have a dedicated page for the project.
To create a post, click into the “Create Post” text field and start typing. You may add images, links, hashtags, etc. Click “Post” once you’re done. You can also select “Publishing Tools” for additional options, such as scheduling the post to publish at a later time.
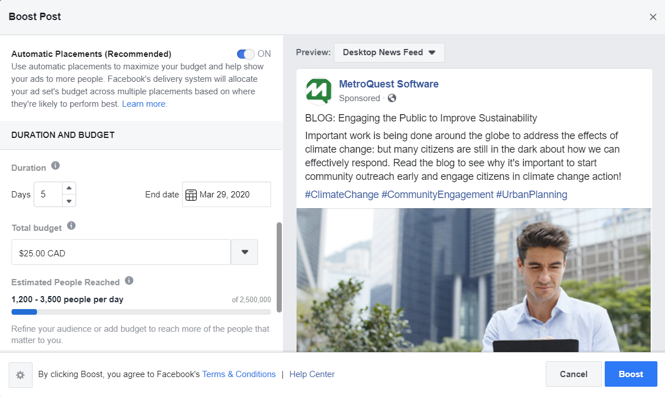
If you already have an existing post to boost, start here. To boost a post, locate the post and then select “Boost Post” at the bottom-right corner.
Follow the instructions to fill in the details of your advertisement, which include:
Audience: Choose a recommended audience or create a new audience based on specific characteristics. For example, you can select people who already like your page, extend it to their network of friends, or select a new audience based on age, location, interest, and so on.
Total Budget: Select a recommended budget or provide a custom budget. Don’t use all your allotted budget at once; you can always boost a second post to capture more input from certain demographics as needed.
Duration: Select one of the suggested time frames or provide a specific end date. The post’s daily budget is created based on total budget and duration that you set here.
Payment Method: Review your payment method. If you need to, you can change or update it.
When you’re finished, select “Boost”.
Once your campaign is running, check in periodically to monitor the results! To view the results for a boosted post:
Go to your Facebook Page
Select the Ad Center tab and then select “All Ads”
Find the ad and select “View Results”
Monitor results in the Ad Center to see how many clicks you’re getting. Survey software like MetroQuest can provide more accurate info on how many people who visit the webpage also complete the survey. If you included it in your survey, MetroQuest’s data center will provide demographic information on people who filled out the survey. By using the two tools together, you can work to improve the performance of your online community engagement and ensure that you’re receiving input from a broad and representative demographic and adjust your outreach efforts as appropriate.
For example, check your MetroQuest Data Center a few weeks into the survey going up, and review the demographic information of respondents. If you see that the majority of the respondents are from the same demographic, you can promote the survey to the underrepresented communities through an additional Facebook boost.
If there are certain communities that your agency wants to hear from for a particular project, identify whether they were a significant part of your MetroQuest survey results and target them in subsequent Facebook boosted posts. Use zip codes and geographic location to make sure that your survey results come from the most representative and diverse range of respondents possible. Get creative! Social media platforms like Facebook, and software for public engagement like MetroQuest, are elements in your toolbox that you can use to achieve the best possible results for your community engagement campaigns!
More on Boosted Facebook Posts for Successful Online Engagement
To learn more about creating posts on Facebook, please click here.
For more information on boosting posts on Facebook, please review the help content on the topic here.
The cost for advertising with Facebook is minimal. It’s also simple and fast, and it allows agencies to reach a broad audience, beyond its current followers on Facebook.
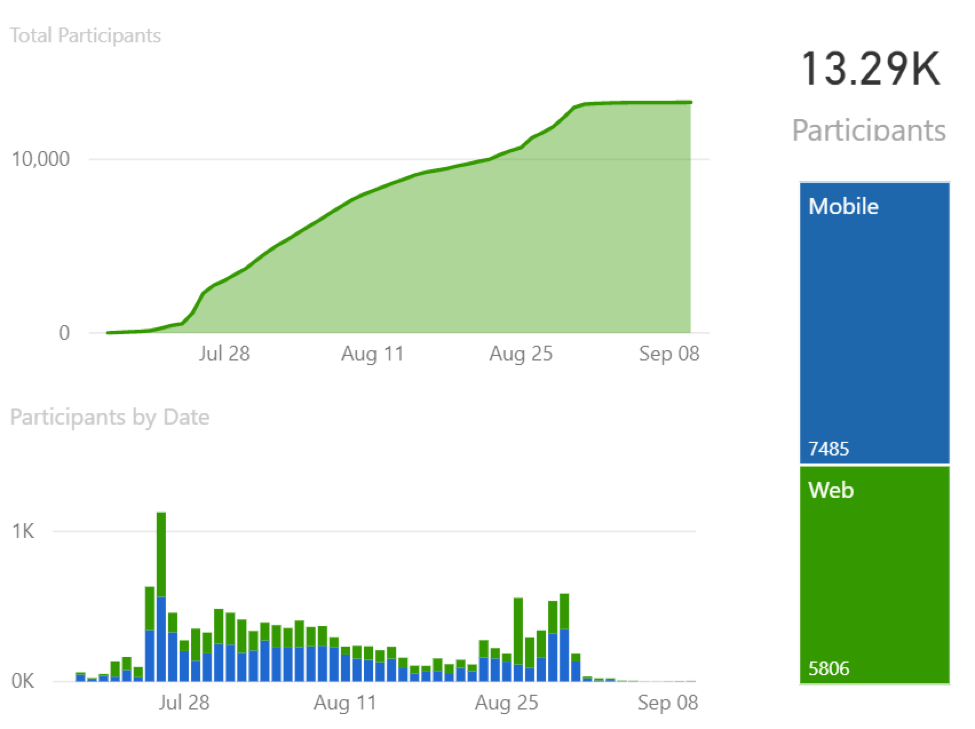
Not convinced? I’ll be sharing a post shortly on how the South Carolina Department of Transportation engaged 13,000 people with Facebook boosted posts!
SCDOT Engaged 13,000+ Residents on a Tiny Budget
Can’t wait? Hear Nicole Riddle, Public Involvement Coordinator (& Biologist) at the SCDOT, discuss their strategy and success with paid Facebook posts in our on-demand webinar. Join me in congratulating Nicole on her outstanding public engagement success!
We’re excited to introduce the Survey of the Month: an exceptionally well-done example of a MetroQuest survey created by one of our users. We’re consistently impressed with the amazing public engagement surveys that MetroQuest subscribers launch to gain valuable public input for their plans. We want to share their inspiring work!
Going forward, every month we’ll show you how one agency or firm put together an outstanding survey and highlight a few takeaways to inspire YOU to create equally engaging surveys!
This month, we’re thrilled to introduce a Comprehensive Pedestrian Plan for Elizabeth City, in collaboration with MetroQuest subscriber Kimley-Horn and Associates and the North Carolina Department of Transportation (NCDOT). Jonathan Whitehurst and his team at Kimley-Horn created an amazing MetroQuest survey to identify obstacles and solutions to building a more walkable city as part of a strategic plan to stimulate community growth.
What’s the story behind WalkEC? It’s Elizabeth City’s First Comprehensive Pedestrian Plan
Elizabeth City’s “Vision 2020” was a community planning initiative that aimed to create economic and community development. Initially, a dedicated committee worked together to create a strategic plan that could guide Elizabeth City’s upcoming developments using data from research and focus groups, reaching all segments of the community. With these, the committee previously recommended that increased sidewalk connections would provide better access to health and social services, trails in nature, parks, and other destinations, elevating Elizabeth City’s ability to serve and support the community.
As a continuation of this larger community strategy, “WalkEC” is a Comprehensive Pedestrian Plan that will set priorities for new sidewalks, multi-use paths, and street crossings. It will also review policies and programs to ensure that the community can make the best use out of the new infrastructure. Jonathan Whitehurt worked together with Elizabeth City and NCDOT to create the WalkEC MetroQuest survey for this plan, looking for actionable community input that would allow them to identify obstacles and create community-backed solutions!
Anatomy of a Survey: How WalkEC’s MetroQuest Survey Gathers Actionable Public Input
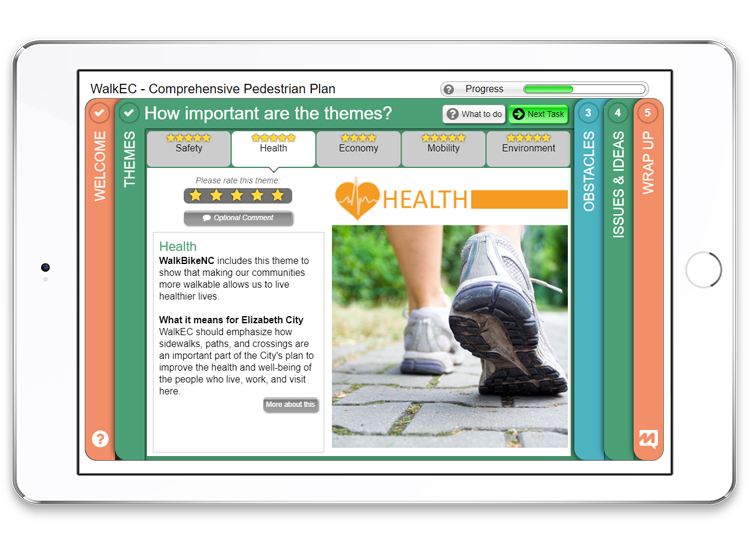
WalkEC’s survey has great flow from screen to screen, first identifying how the community prioritizes five themes, then identifying potential obstacles to achieving those goals, and finally creating a space for citizens to safely suggest solutions.
In more detail, the survey starts by presenting some background information to help provide context and let citizens know how their input will be used: namely, to help ensure that the community will be able to make “the best use of these new investments.” It then dives into the first interactive data collection activity, presenting five themes from the statewide North Carolina bicycle and pedestrian plan, called WalkBikeNC.
Participants are asked to rate each theme on a 5-point scale and can submit optional comments on each. The five themes are: Safety, Health, Economy, Mobility, and Environment. Understanding how important each of these state-identified themes are to Elizabeth City residents will help shape the pedestrian plan around the topics that are most valuable to them.
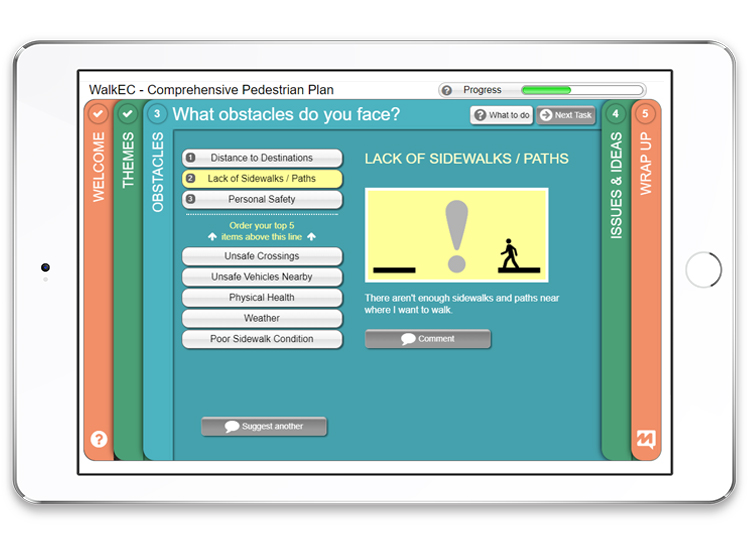
In the second activity, participants are asked to rank the 5 biggest obstacles that prevent them from walking or from walking more frequently. Because one goal of the comprehensive plan is to help the community utilize pedestrian infrastructure, it is important to the Elizabeth City team to make sure that they identify concerns and attempt to solve them where possible.
The list of obstacles includes: Personal Safety, Poor Sidewalk Conditions, Lack of Sidewalks/Paths, Physical Health, Unsafe Crossings, Weather, Distance to Destinations, and Unsafe Vehicles Nearby. Understanding obstacles to walking will help Elizabeth City to become safer, more enjoyable, and more accessible.
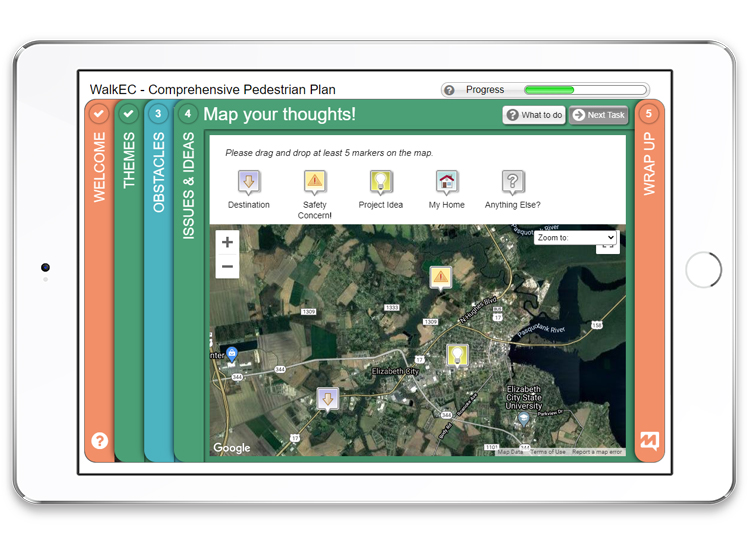
Finally, before asking a few demographic questions, participants are asked to map their thoughts and show issues and ideas spatially by dropping markers onto a virtual map. Jonathan and his team configured markers that people can use to show the location of their Safety Concerns, Project Ideas, and Destinations, as well as showing where they live (My Home) and providing additional ideas (Anything Else). This survey screen gives participants the option to show exactly where they want more pedestrian infrastructure, where they feel unsafe, and where sidewalks, trails, or crosswalks are needed. By giving participants the option to share these in a clean map (without existing markers that cause bias), Elizabeth City is giving each citizen an equal opportunity to have their voice be heard.
If you’d like to try a demo of the survey, click the button below. This will not affect Elizabeth City’s survey results, so feel free to click around.
The accompanying project website can be found here. This survey is currently live, and we are looking forward to seeing great public engagement results!
5 Tips from Elizabeth City: How to Make an Effective Online Survey for Public Involvement with MetroQuest
The survey the team created is fantastic in many ways. They made the most out of MetroQuest by translating the goals of their comprehensive plan into an accessible survey that could collect actionable information from the broader community.
How did they make their survey so engaging? Below are 5 aspects to keep in mind as you build your next MetroQuest survey to ensure that yours is just as successful.
In a brief introduction, convey the goals of your plan and show participants how their input will have impact. There’s no need to go into great detail—that’s what the project website is for—but knowing that their input is valued and will be acted upon will motivate participants.
Use a simple call-to-action so that participants have an immediate and obvious next step. The example WalkEC uses in the introduction screen is simple yet effective: “We want to hear from you!”
Enhance your text with icons and relevant images – it draws the participant in, makes the survey more fun and visual, and encourages the participant to connect to the questions and identify their priorities. For example, the second screen of the survey uses a picture of two children at a crosswalk to illustrate the theme of Safety. Help participants link the concepts in the survey to their everyday lives!
Keep all text short and precise and use simple language instead of jargon. WalkEC is a Comprehensive Pedestrian Plan. While citizens might not know what that type of plan is, they’ll certainly understand that the city is looking to “help ensure our community makes the best use of these new investments.” Follow this rule of thumb in the survey itself, too. For example, when discussing barriers to walking, this survey explains “distance to destination” plainly as “it would take too long to walk from point A to point B.” Simple, everyday language like this helps participants think about their everyday concerns more easily, all the while subtly educating the public and helping you to collect informed input!
Allow for specific and quick answers. Notice that the questions in WalkEC are drag-and-drop or can otherwise be answered in one click! For example, the map uses icons that can be dropped onto different areas, with drop downs that pop up to capture additional information. This makes answering the survey fast and easy, instead of forcing participants to verbalize and type out all their answers. This also makes it easier to aggregate the data afterwards. Win-win!
Congrats to Jonathan and the entire team at Kimley-Horn & Associates, the North Carolina Department of Transportation, and Elizabeth City for creating a fun interactive experience for WalkEC!
For more great tips on how to make the most out of MetroQuest, contact your Customer Experience manager or reach out for more information!
Want to learn more about MetroQuest? Check out our recent webinar:
Optimizing Online Engagement for Planning with MetroQuest
Online tools are a critical part of the planner’s public engagement toolbox, especially as we look for safe, effective methods to engage during the COVID-19 pandemic. Find out which options result in positive, actionable community input for your urban and transportation plans.
For government agencies, “online public engagement” encompasses a particularly wide array of tools and services – from chat bots on websites to digital town halls.
The American Association of State Highway and Transportation Officials, for instance, tell us in a recent report that “the practice of using social media is not only routine, it is considered in many ways a key factor in public engagement.”
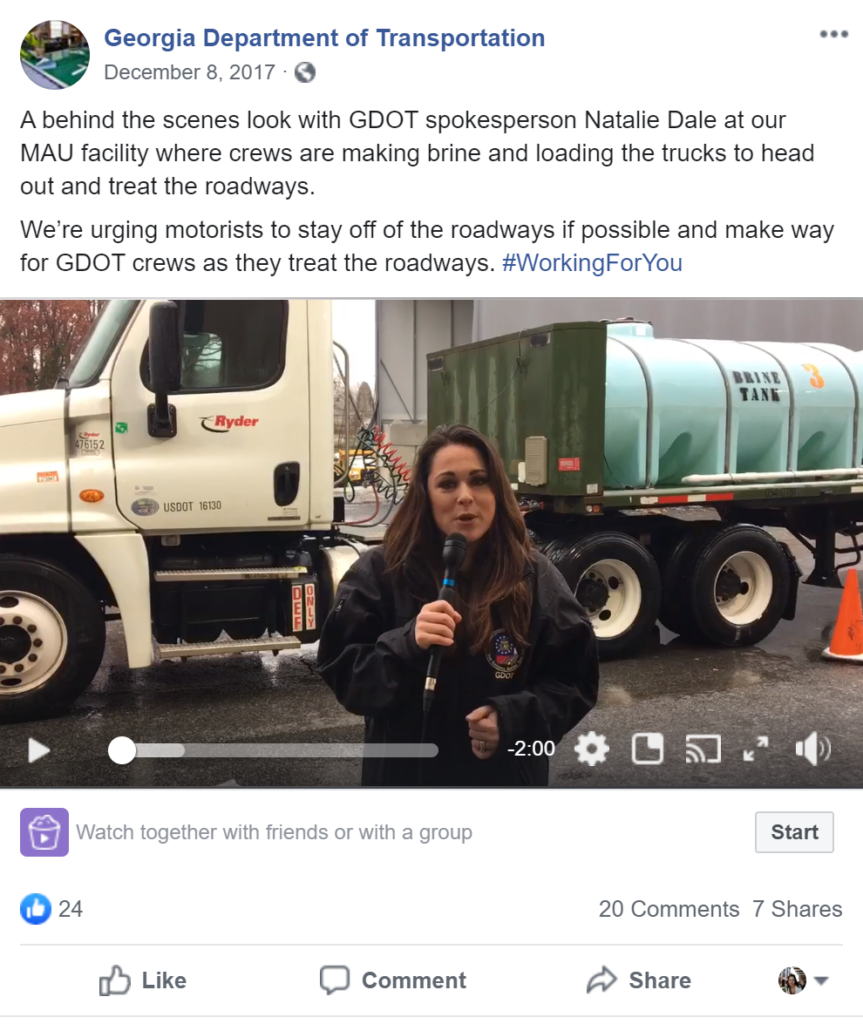
Indeed, state and local governments use social media to alert the public of major events, like transportation disruptions. It’s also used for casual storytelling with photos and videos. The Georgia Department of Transportation (GDOT), for example, uses Facebook to bring the public “Behind the Scenes,” featuring employees engaged in interesting activities like treating roads with brine to keep motorists safe.
With so many online tools and options for public engagement – from social media to community forums, each used by various departments of government – it can become challenging for our friends in the planning department to get access to the right solution. Why? They have unique requirements not always well understood by decision makers and influencers in other departments. Let’s help provide clarification.
Planners have unique public engagement objectives. They need to collect informed community input on complex topics to support their urban and transportation plans.
Urban and transportation planning projects tend to be critical make-or-break points in an agency’s relationship with the public. These projects directly affect quality of life and represent major public investments. Ineffective public engagement can have grave implications – scrutiny from decision makers, important plans not getting approved, public backlash, bad press, ousting of elected officials, and delays in critical infrastructure – all detrimental to the wellbeing of our communities. The importance of public engagement for planning is clear.
So, what makes for effective public engagement? Since 1997, we at MetroQuest have dedicated our life’s work to answering this question. Collaborating with all the industry associations and thousands of AICP certified professionals, we’ve learned that planners need public engagement to deliver unique outcomes so they can stand confidently before councils and demonstrate support for plans, backed by credible data that proves that their plan represents true public priorities and preferences.
1. Planners need high levels of public participation.
Our planning friends require very high levels of public participation across a broad demographic, not just from the same small group of beneficiaries or naysayers. Ideally, thousands of people across a broad demographic provide input. To move forward with oftentimes bold recommendations, planners need to make the case to decision makers that the broader public is behind their plan.
2. Public input must be informed by weaving in education.
Planners need to educate the public about complex issues before providing input – yet residents won’t read long PDF project documents full of planning jargon. Education must be woven into the online engagement experience as microlearning, ideally with visualizations and interactivity, so the public can quickly learn about project nuances and tradeoffs, improving the quality of their input.
3. The experience must be private for input that’s free of bias.
To uncover true public priorities, planners require input from residents that is not influenced by the stronger, louder voices in the community. This means that the online engagement experience needs to offer privacy to support input that is free from bias, bullying, and intimidation. This is particularly critical to broaden the reach to traditionally underrepresented groups.
4. A wealth of quantifiable input is needed for data-driven planning.
To be actionable, public input must be specific and primarily quantitative. Obtaining a wealth of largely quantifiable data points (50,000+) drives better decisions in planning, more so than qualitative input (via comments). Planners make risky and expensive planning decisions with long term impact. Clear, quantifiable input gives them confidence to build bold plans.
5. Input from the public must be defensible to get plans approved.
Collecting bias-free informed input from thousands of participants in the form of quantifiable data is what planners require to defend their plans. Indeed, getting multi-million-dollar plans approved by committees and elected officials takes data-driving planning backed by broad community support.
With declining participation at public meetings, planners have turned to online engagement to meet these unique objectives. Online tools offer the most cost-effective and resource-efficient way to broaden public participation. But, with so many digital options already available within their agency, do our friends really need another tool?
Can’t an online forum do the trick? How about a SurveyMonkey?
For answers to these questions, let’s explore how various online tools stack up against the unique requirements of our friends in the planning department.
Social media is a terrific communication tool, but it was never designed for public input in planning.
Social media is used by just about every government agency as an effective communication tool for announcements, soundbites, and casual storytelling, as we saw with GDOT. Social media – from free to boosted posts, from Facebook to Twitter – also offers one of the most cost-effective ways to broaden reach to promote other public input options like public meetings and online surveys. For example, South Carolina DOT recently used Facebook boosted posts to get over 13,000 residents to take their MetroQuest survey … for less than the cost of a single public meeting!
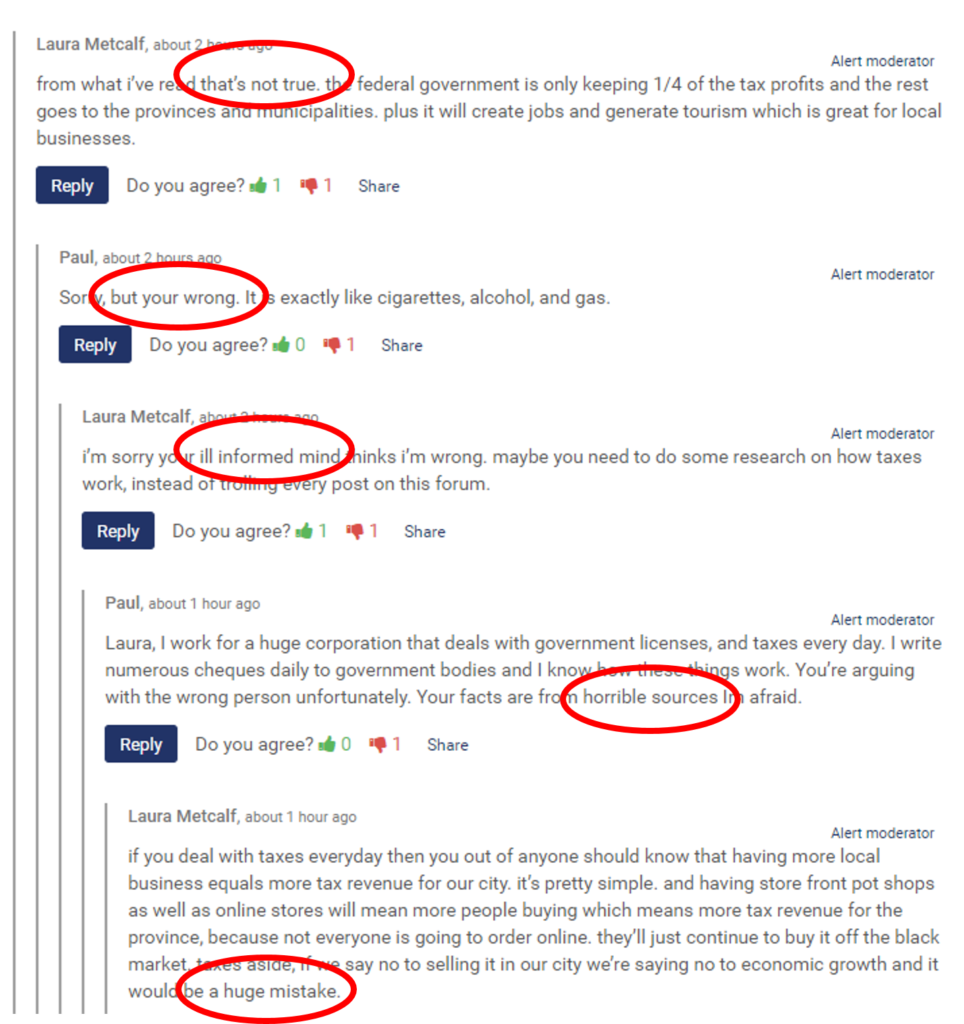
That said, social media alone is ineffective at collecting quantifiable public input to inform plans. Likes and retweets cannot support complex planning decisions. Social media posts by residents are difficult to analyze and can steer towards contentious topics outside the scope of planning projects. And let’s not forget that posts and comments are public, permanent, and polarizing. While definitely part of the planner’s toolbox for promoting public engagement opportunities, social media in and of itself is not used for quantifiable public input by planners.
Forums require registration, while comments are public, subject to bias and intimidation, and difficult to quantify.
Online forums (and other ideation tools) can be useful early on in a planning project to identify public priorities from vocal members of the community. They can uncover concerns and ideas not previously considered. While indeed a useful tool in the planner’s toolbox, online forums miss the mark in many ways.
Requiring the public to “register to join” has proven to reduce participation by up to 95%! And not unlike public meetings and social media, the open nature of comments can bias public input and tend to polarize views. Participation is particularly intimidating for residents who are learning English as a second language. And with reams of qualitative comments, including banter and tribal arguments, it’s difficult for planners to summarize the results for decision making.
While open-ended comments can be helpful in characterizing public sentiments, planners need structured data, summarized visually, that can be digested in minutes by busy decision makers.
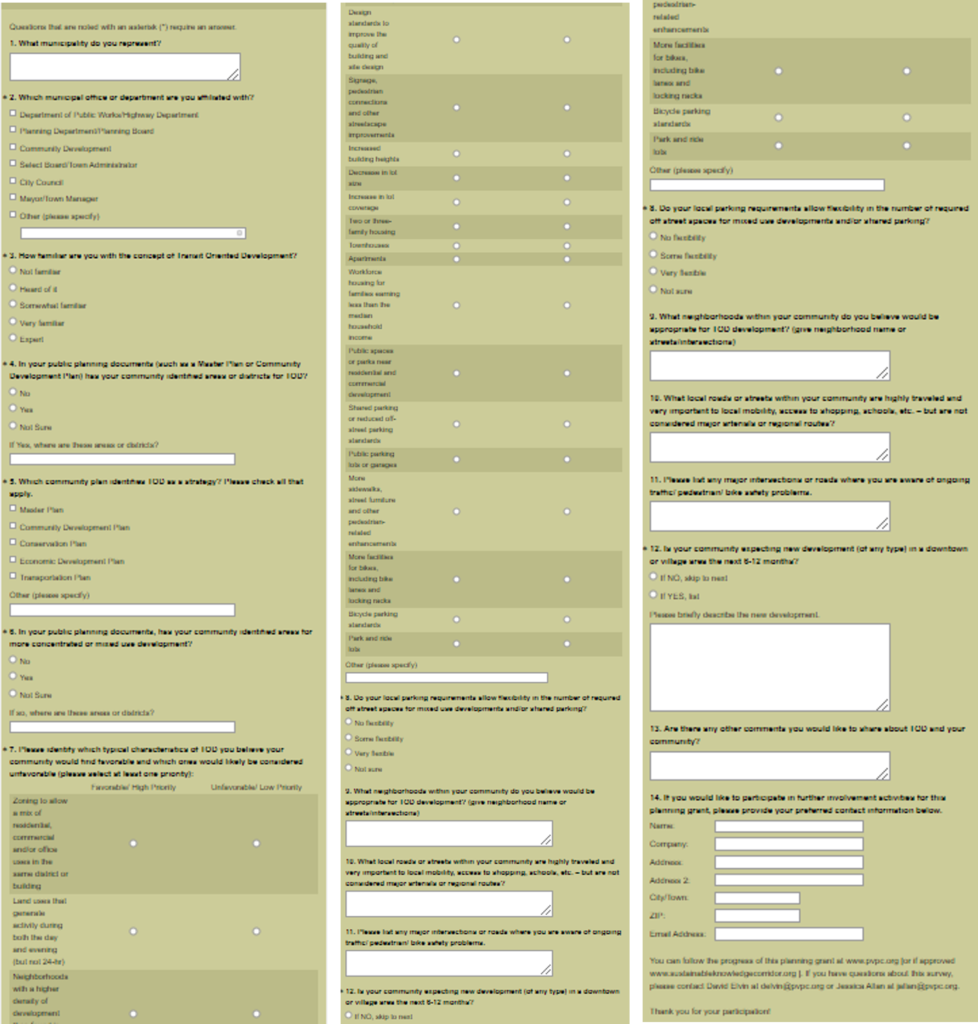
Text-based surveys are boring, yield low participation, and are hardly educational.
Online surveys can be a great way to defeat the shortcomings of online forums. After all, each survey respondent gets the same private online experience, free of bias and intimidation. The data collected using multiple-choice questions is quantitative and easy to graph. Indeed, SurveyMonkey can be a great tool to quickly collect public input!
That is, until you need to engage the public on a complex planning project. When it comes to multifaceted initiatives – like comprehensive plans or transportation projects – simple survey data can fail when scrutinized by public officials. Text-based surveys don’t convey project nuances. People don’t read a PDF to learn about a project, then take a long survey that feels like homework. It’s no wonder that public response rates for text based surveys range from 10 to 15%, resulting in usually less than 100 participants. Would you take this survey?
For planning departments, success in public engagement typically means over a thousand participants from diverse demographics, each contributing 30 to 100 data points (priorities ranked, map markers dropped, images rated, etc.) – that means over 30,000 data points of unbiased public input to satisfy decision makers.
Over the past 20+ years, the team at MetroQuest has pioneered digital public engagement for planners – we’re intimately familiar with their unique objectives. So how can we help our friends to make the case that they need MetroQuest – the only specialized online engagement solution designed for planners? Let’s turn the spotlight on a 2020 success story.
GDOT collected nearly 50,000 data points to inform its 85 Corridor Study!
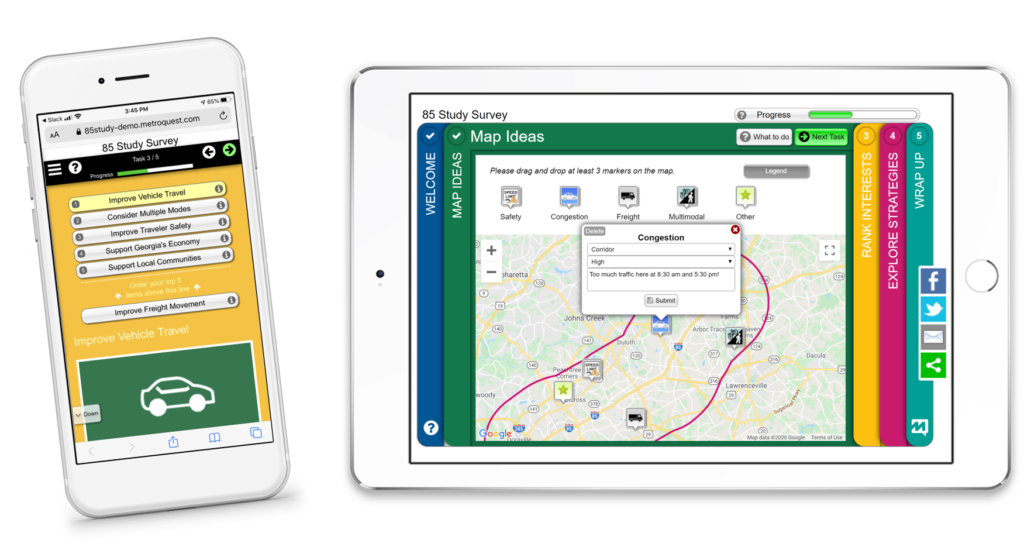
The Georgia Department of Transportation is conducting a comprehensive corridor study along I-85, between I-285 and I-985. The corridor is roughly 18 miles long, with 6 travel lanes, 16 interchanges, and serves approximately 300,000 vehicles daily. In the first phase of the study, the Office of Planning engaged the public to get input on how to reduce congestion, enhance traffic operations, and improve safety. Let’s look at a demo of their MetroQuest survey:
GDOT increased public participation to over 2,550 survey respondents!
For a corridor study, attendance at a typical public meeting might include 10 people, while a text-based online survey might reach 50 or 100. The planning team at GDOT successfully broadened reach, offering their MetroQuest survey in English, Spanish, Korean, and Vietnamese, to gain valuable public input from 2,550+ residents! Several unique MetroQuest features made such high public participation possible.
No Registration. MetroQuest doesn’t require registration and leaves demographic questions to the end. Planners don’t need participant names and contact information since personal responses are not expected. Eliminating upfront registration drives up participation rates from the standard 10-15% upwards to 50-80% with MetroQuest.
5-Minute Experience. Public participation drops drastically (by over 90%) when planners ask the public for more than 5 minutes of their time. GDOT launched a great MetroQuest survey that took just 5 minutes to complete. It was fast and easy for residents to provide input with a click, drag, and drop, minimizing lengthy typing.
Project-Specific Input Fast. Planners need time-bound feedback at specific stages of planning projects. GDOT engaged 2,500+ people in three months with their MetroQuest survey live from December 5, 2019 to March 2, 2020. All the public input stayed within project scope, with specific questions seeking public influence on key project outcomes.
Any Device. MetroQuest surveys are responsive and optimized for mobile. GDOT was able to engage Georgians across all their devices – from any smart phone, tablet, laptop, or computer connected to the internet – without the struggle of pinching and zooming. With MetroQuest, it’s common for 50 to 70 percent of respondents to participate from the convenience of their mobile devices, anytime, anywhere.
“Fun” Drives Social Sharing. Visually engaging surveys, packed with colorful images, are readily shared via social media, which dramatically broadens demographic reach. GDOT used MetroQuest’s social sharing buttons to encourage participants to share the survey.
Microlearning helped GDOT planners collect informed public input!
Completing an interesting, interactive survey that informs while collecting feedback is a rewarding experience. MetroQuest offers visualizations and interactive elements that feel more like games than surveys. Comments such as, “Great survey, wonderful project. So fun, I learned so much”, showed us that participants loved the experience. Georgians “learned while answering” with education weaved into the experience in microlearning moments, giving planners confidence that the input was informed.
Microlearning. In their MetroQuest survey, GDOT welcomed Georgians with a succinct overview of the 85 Study. Participants then ranked priorities with short descriptions. While rating strategies, they learned how to increase capacity and improve safety. People gained appreciation for the scope and scale of the project, while providing input.
Planning Templates. MetroQuest uses gamification to educate the public in minutes using survey templates designed for planning. Participants visualize the pros and cons of different scenarios, stack coins to allocate budgets, rate images (like ranking five kinds of bike lanes to realize nuances), gain appreciation for competing tradeoffs, drop markers on maps, and use dynamic slider bars to fund projects using taxes and fees.
Input from the public for the 85 Corridor Study was 100% free of bias!
The 2,550+ Georgians who took the MetroQuest survey each had an identical public engagement experience – a clean map for their ideas, identical priorities to rank, and the same strategies to rate. The 1000th participant used the same uninfluenced input mechanism as the 1st participant, unaware of prior community input.
Clean Map. Some tools allow residents to drop markers on public web maps – the problem is that input becomes biased by all the markers previously added by others. A cluttered map also makes it difficult for participants to see where to place their markers, particularly on smart phones. GDOT used MetroQuest to collect over 25,200 map marker attributes, free of bias, while making the experience quick and easy.
Private Experience. GDOT planners used MetroQuest for direct, one-way public input to uncover true community preferences, free of peer influence, social intimidation, and toxic banter. Each survey experience was identical and private.
Nearly 50,000 data points were collected to inform the 85 Study!
The Office of Planning now has nearly 50,000 data points to support data-driven improvements to the 18-mile stretch on the I-85. This quantifiable data includes 25,000 spatial map marker attributes and 24,000 strategy ratings – it will help in recommending projects that meet the true needs of local stakeholders who depend on the corridor.
Comments in Context. GDOT planners added comment boxes in their MetroQuest survey to add context for the quantitative questions they asked. They collected over 6,000 comments to bring color and commentary to supplement the data.
Charts & Graphs. Using the MetroQuest Data Center, GDOT planners are exploring charts and graphs to build their study reports. Colorful visualizations of all the quantitative public input will support their recommendations, impress the Board, and build confidence for project approvals.
We’d like to congratulate the team at GDOT for their outstanding online public engagement success! You’ve gained tremendous public support for your 85 Study. Thank you for subscribing to MetroQuest – our team looks forward to seeing many more surveys from GDOT this year.
We hope that GDOT’s success story will inspire other agencies to endow their planners with North America’s only online public engagement solution purpose-designed for planning. When more members of the public participate in planning we get more livable cities and we’re able to move more people. We all benefit!
Optimizing Online Engagement for Local Government with MetroQuest
Online tools are a critical part of the public engagement tool box. This webinar highlights how local governments are optimizing online engagement for the best results.
The City of Austin recently used MetroQuest, in partnership with national planning and design consulting firm, Kimley-Horn & Associates, to engage over 5,100 participants online! Their outstanding success is based on two factors: a great outreach plan and a fantastic MetroQuest survey that turned visitors into survey respondents. Before discussing the latter in my next post, we’ll turn our attention to one major aspect of their engagement strategy: their use of Nextdoor.
What is Nextdoor?
In a nutshell, Nextdoor is a social media platform connecting people based on their geographic locations, with the intent to “empower neighbors to build stronger, safer, and happier communities.” Using Nextdoor’s engagement tools, public service agencies including planning, utilities, police, and other local authorities can communicate with residents within their specific area or neighborhood.
Nextdoor members, meaning residents of a specific area, are automatically subscribed to receive messages from agencies that serve them, making it a simple yet effective tool to add to any agency’s engagement toolbox.
If your government agency doesn’t already have an account, you can sign up to use Nextdoor here! Nextdoor even offers a very thorough step-by-step guide on how to sign up, add users, manage the account, and view results.
How can your agency use Nextdoor for public engagement?
NextDoor’s main method of communication with your agency’s neighborhood members is via posts. There are four types of posts on Nextdoor for agencies.
Messages: these are the most common way to communicate with residents and can be used to invite them take your online surveys. Photos (of your surveys) or documents may be added to attract attention.
Polls: these are a quick way to ask for feedback on basic topics. Each member can vote only once. To gather more robust feedback or for more complex plans, a MetroQuest survey might be a better option. Nextdoor polls can help generate interest in your longer surveys by highlighting a single question to get people invested.
Events: these may include notices of public meetings, workshops, or other events that complement your online engagement efforts.
Urgent Alerts: these are exactly that – and are more applicable to public safety or emergencies.
When making a post, you can choose one of the above types, as well as indicate the target audience (more on that below). There is also an option to send a message directly to “Nextdoor Leads,” who are typically the most engaged members or the founding members of the neighborhood on Nextdoor. It’s also possible to share the message directly to other platforms including Facebook and Twitter for even greater reach and impact.
Here are 6 tips to effectively promote your public survey with Nextdoor!
What does it take to write an engaging Nextdoor post? Let’s explore six tips that can help you drive participation for your next MetroQuest survey.
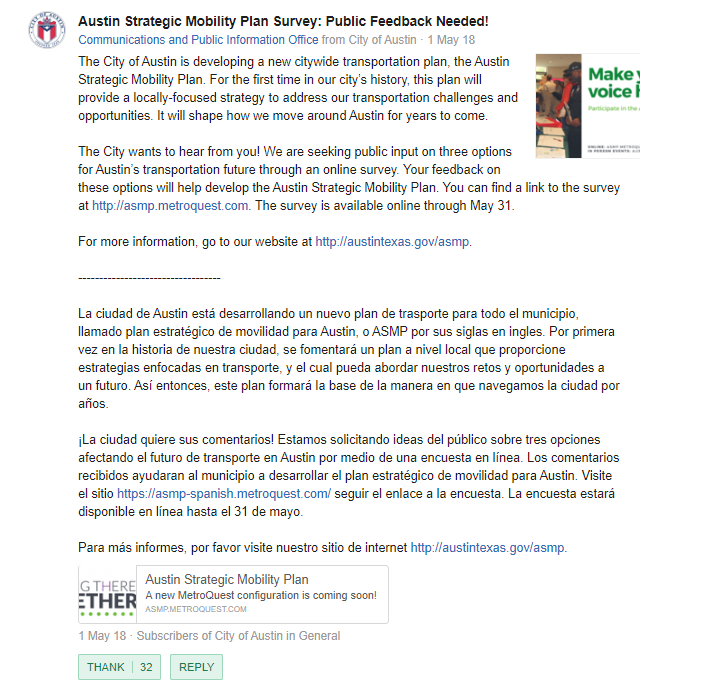
Messages include a subject line as well as body copy. Use the subject line to include an eye-catching, urgency-creating call to action. Here’s a great example: Austin Strategic Mobility Plan Survey: Public Feedback Needed!
A major benefit of Nextdoor is the ability to choose the audience for each post – options include the entire service area/region, or a subset such as specific service areas or specific neighborhoods. Monitor the post results and use follow-up posts to target specific zip codes that received fewer initial impressions, or continue to be underrepresented in the survey.
Similar to the MetroQuest survey itself, the post’s tone should be precise, relevant, and simple, and should avoid jargon or acronyms.
Include a direct link to the MetroQuest survey to make it easy for people to immediately provide input, before they get distracted.
Use an image! Pictures of happy people taking the survey on a phone or iPad can be compelling. So can an image of the survey itself.
Create a follow-up post that includes a final call to action shortly before the survey closes. A “last chance” post always garners attention.
Tips are useful … but seeing them in action is even more practical. Stay tuned! In my next blog post, I’ll share how the City of Austin engaged over 5,100 residents by promoting their MetroQuest survey on Nextdoor. Here’s a teaser. Check out this powerful multi-lingual post:
Can’t wait? Liane Miller, AICP and Senior Business Process Consultant with Austin’s Transportation Department, tells all in her on-demand webinar: Online Public Engagement Playbook. Join me in congratulating Liane on her outstanding public engagement success by commenting below!
![[SURVEY OF THE MONTH] Uncovering Future Transportation Needs with Reimagine I-10, TxDOT’s Corridor Feasibility Study](https://metroquest.com/wp-content/uploads/SURVEY-OF-THE-MONTH-Uncovering-Future-Transportation-Needs-with-Reimagine-I-10-TxDOT’s-Corridor-Feasibility-Study-e1598045812413.png)

![[SURVEY OF THE MONTH] Compelling Online Public Engagement for a Metropolitan Transportation Plan Update Survey](https://metroquest.com/wp-content/uploads/Goldsboro_Survey_of_the_Month.png)



![[SURVEY OF THE MONTH] A MetroQuest Survey Identifies Community Priorities for WalkEC, a Comprehensive Pedestrian Plan](https://metroquest.com/wp-content/uploads/Woman-Laptop-WalkEC-Survey-Screen_blog-header.jpg)