5 Reasons Planners Need a Unique Online Public Engagement Toolbox

For government agencies, “online public engagement” encompasses a particularly wide array of tools and services – from chat bots on websites to digital town halls.
The American Association of State Highway and Transportation Officials, for instance, tell us in a recent report that “the practice of using social media is not only routine, it is considered in many ways a key factor in public engagement.”
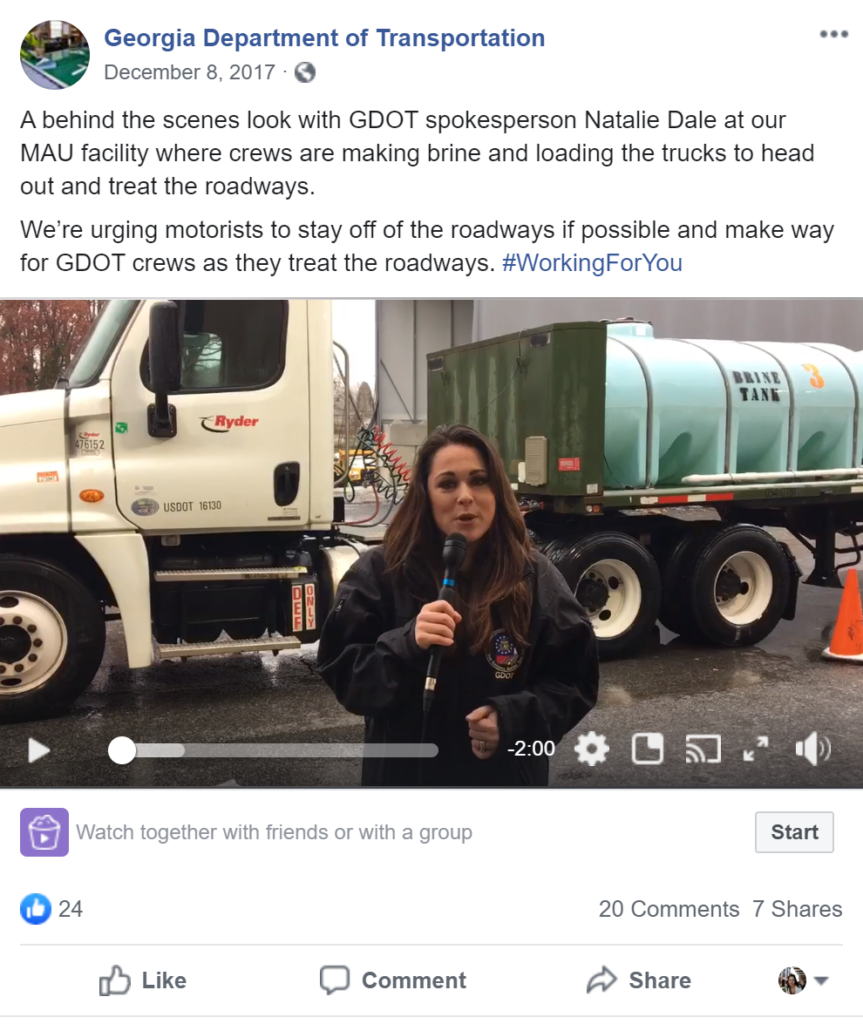
Indeed, state and local governments use social media to alert the public of major events, like transportation disruptions. It’s also used for casual storytelling with photos and videos. The Georgia Department of Transportation (GDOT), for example, uses Facebook to bring the public “Behind the Scenes,” featuring employees engaged in interesting activities like treating roads with brine to keep motorists safe.
With so many online tools and options for public engagement – from social media to community forums, each used by various departments of government – it can become challenging for our friends in the planning department to get access to the right solution. Why? They have unique requirements not always well understood by decision makers and influencers in other departments. Let’s help provide clarification.
Planners have unique public engagement objectives. They need to collect informed community input on complex topics to support their urban and transportation plans.
Urban and transportation planning projects tend to be critical make-or-break points in an agency’s relationship with the public. These projects directly affect quality of life and represent major public investments. Ineffective public engagement can have grave implications – scrutiny from decision makers, important plans not getting approved, public backlash, bad press, ousting of elected officials, and delays in critical infrastructure – all detrimental to the wellbeing of our communities. The importance of public engagement for planning is clear.
So, what makes for effective public engagement? Since 1997, we at MetroQuest have dedicated our life’s work to answering this question. Collaborating with all the industry associations and thousands of AICP certified professionals, we’ve learned that planners need public engagement to deliver unique outcomes so they can stand confidently before councils and demonstrate support for plans, backed by credible data that proves that their plan represents true public priorities and preferences.
1. Planners need high levels of public participation.
Our planning friends require very high levels of public participation across a broad demographic, not just from the same small group of beneficiaries or naysayers. Ideally, thousands of people across a broad demographic provide input. To move forward with oftentimes bold recommendations, planners need to make the case to decision makers that the broader public is behind their plan.
2. Public input must be informed by weaving in education.
Planners need to educate the public about complex issues before providing input – yet residents won’t read long PDF project documents full of planning jargon. Education must be woven into the online engagement experience as microlearning, ideally with visualizations and interactivity, so the public can quickly learn about project nuances and tradeoffs, improving the quality of their input.
3. The experience must be private for input that’s free of bias.
To uncover true public priorities, planners require input from residents that is not influenced by the stronger, louder voices in the community. This means that the online engagement experience needs to offer privacy to support input that is free from bias, bullying, and intimidation. This is particularly critical to broaden the reach to traditionally underrepresented groups.
4. A wealth of quantifiable input is needed for data-driven planning.
To be actionable, public input must be specific and primarily quantitative. Obtaining a wealth of largely quantifiable data points (50,000+) drives better decisions in planning, more so than qualitative input (via comments). Planners make risky and expensive planning decisions with long term impact. Clear, quantifiable input gives them confidence to build bold plans.
5. Input from the public must be defensible to get plans approved.
Collecting bias-free informed input from thousands of participants in the form of quantifiable data is what planners require to defend their plans. Indeed, getting multi-million-dollar plans approved by committees and elected officials takes data-driving planning backed by broad community support.
With declining participation at public meetings, planners have turned to online engagement to meet these unique objectives. Online tools offer the most cost-effective and resource-efficient way to broaden public participation. But, with so many digital options already available within their agency, do our friends really need another tool?
Can’t an online forum do the trick? How about a SurveyMonkey?
For answers to these questions, let’s explore how various online tools stack up against the unique requirements of our friends in the planning department.
Social media is a terrific communication tool, but it was never designed for public input in planning.
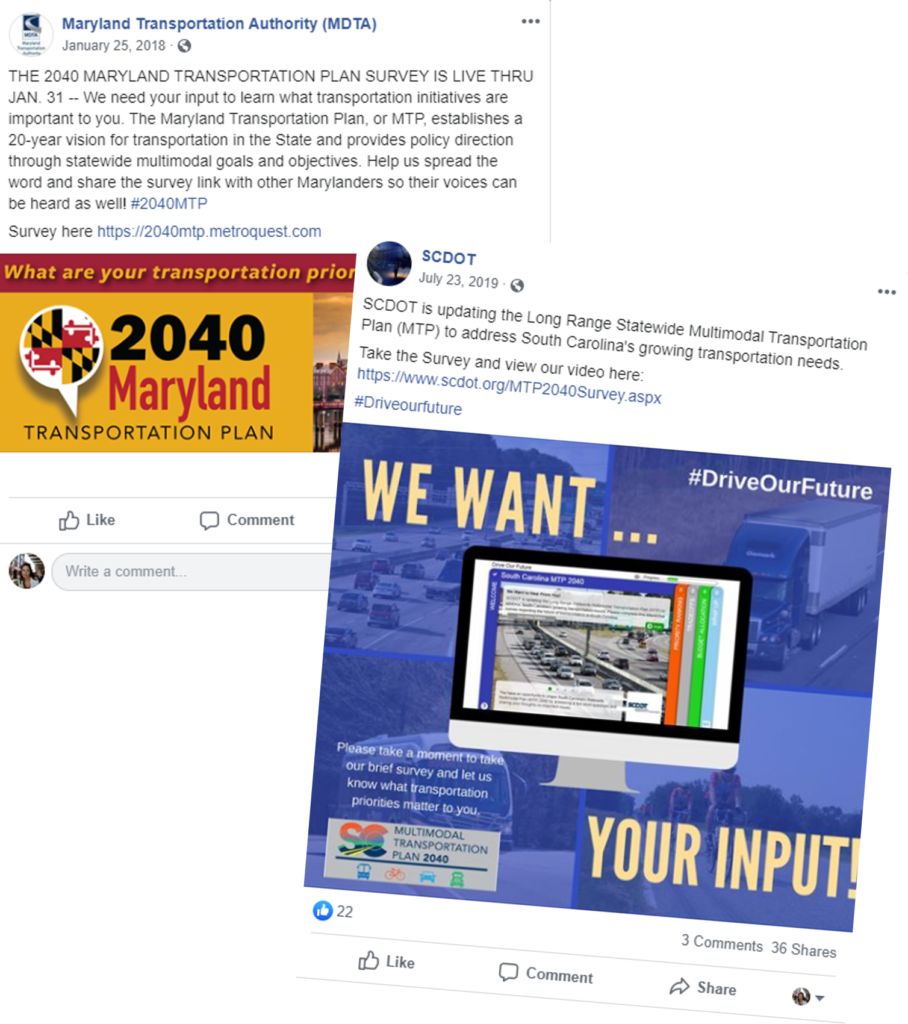
Social media is used by just about every government agency as an effective communication tool for announcements, soundbites, and casual storytelling, as we saw with GDOT. Social media – from free to boosted posts, from Facebook to Twitter – also offers one of the most cost-effective ways to broaden reach to promote other public input options like public meetings and online surveys. For example, South Carolina DOT recently used Facebook boosted posts to get over 13,000 residents to take their MetroQuest survey … for less than the cost of a single public meeting!
That said, social media alone is ineffective at collecting quantifiable public input to inform plans. Likes and retweets cannot support complex planning decisions. Social media posts by residents are difficult to analyze and can steer towards contentious topics outside the scope of planning projects. And let’s not forget that posts and comments are public, permanent, and polarizing. While definitely part of the planner’s toolbox for promoting public engagement opportunities, social media in and of itself is not used for quantifiable public input by planners.
Forums require registration, while comments are public, subject to bias and intimidation, and difficult to quantify.
Online forums (and other ideation tools) can be useful early on in a planning project to identify public priorities from vocal members of the community. They can uncover concerns and ideas not previously considered. While indeed a useful tool in the planner’s toolbox, online forums miss the mark in many ways.
Requiring the public to “register to join” has proven to reduce participation by up to 95%! And not unlike public meetings and social media, the open nature of comments can bias public input and tend to polarize views. Participation is particularly intimidating for residents who are learning English as a second language. And with reams of qualitative comments, including banter and tribal arguments, it’s difficult for planners to summarize the results for decision making.
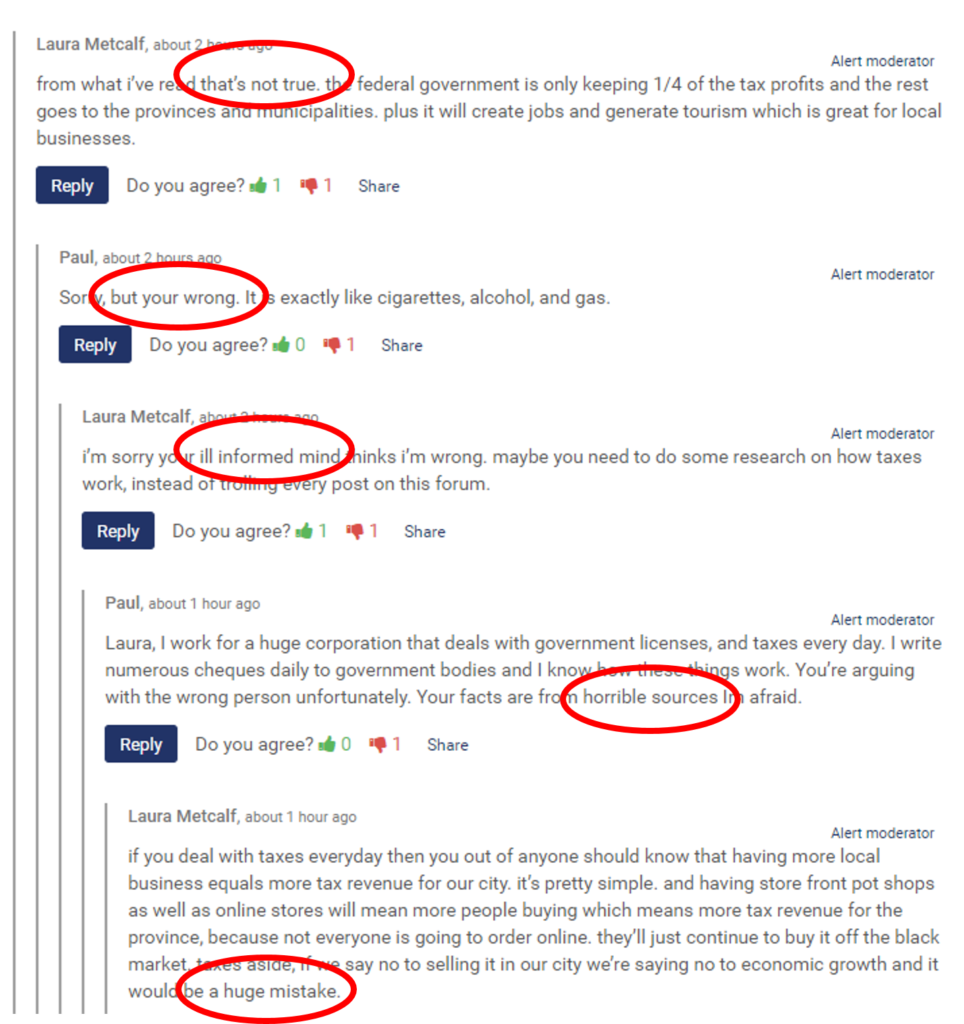
While open-ended comments can be helpful in characterizing public sentiments, planners need structured data, summarized visually, that can be digested in minutes by busy decision makers.
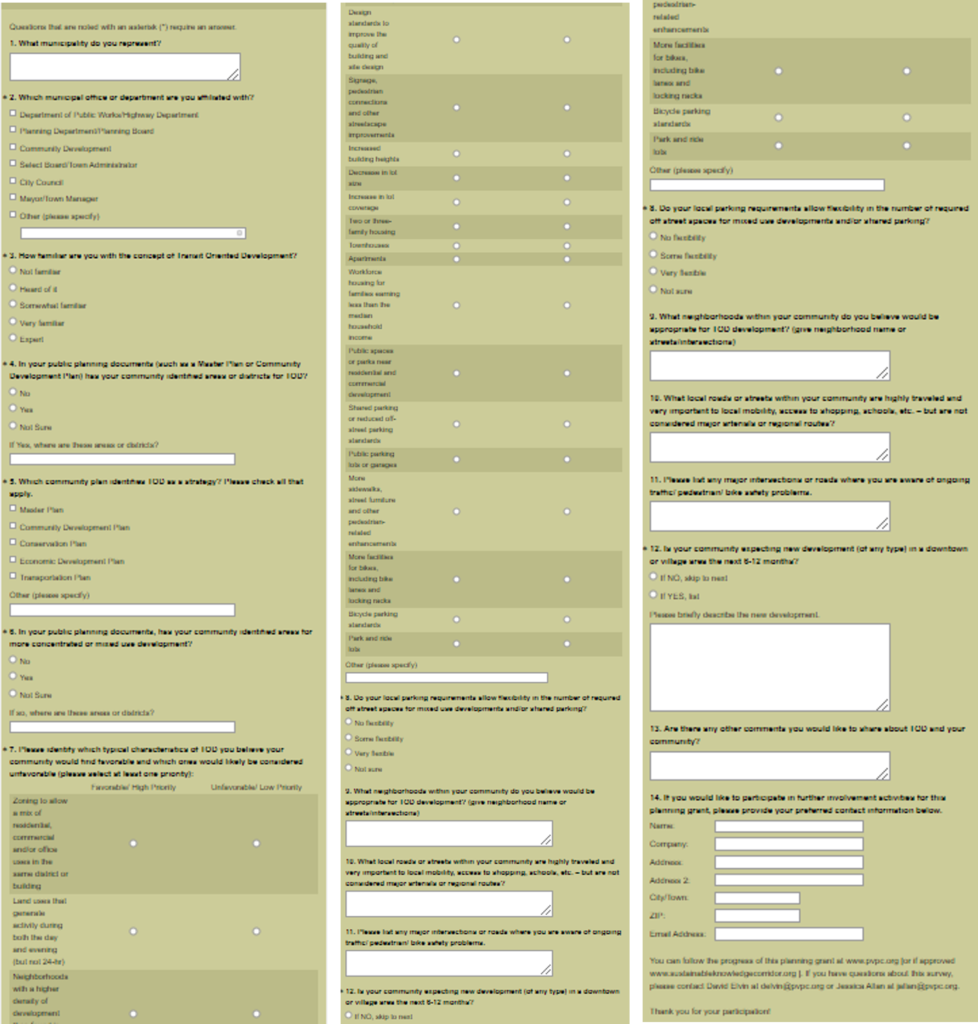
Text-based surveys are boring, yield low participation, and are hardly educational.
Online surveys can be a great way to defeat the shortcomings of online forums. After all, each survey respondent gets the same private online experience, free of bias and intimidation. The data collected using multiple-choice questions is quantitative and easy to graph. Indeed, SurveyMonkey can be a great tool to quickly collect public input!
That is, until you need to engage the public on a complex planning project. When it comes to multifaceted initiatives – like comprehensive plans or transportation projects – simple survey data can fail when scrutinized by public officials. Text-based surveys don’t convey project nuances. People don’t read a PDF to learn about a project, then take a long survey that feels like homework. It’s no wonder that public response rates for text based surveys range from 10 to 15%, resulting in usually less than 100 participants. Would you take this survey?
For planning departments, success in public engagement typically means over a thousand participants from diverse demographics, each contributing 30 to 100 data points (priorities ranked, map markers dropped, images rated, etc.) – that means over 30,000 data points of unbiased public input to satisfy decision makers.
Over the past 20+ years, the team at MetroQuest has pioneered digital public engagement for planners – we’re intimately familiar with their unique objectives. So how can we help our friends to make the case that they need MetroQuest – the only specialized online engagement solution designed for planners? Let’s turn the spotlight on a 2020 success story.
GDOT collected nearly 50,000 data points to inform its 85 Corridor Study!
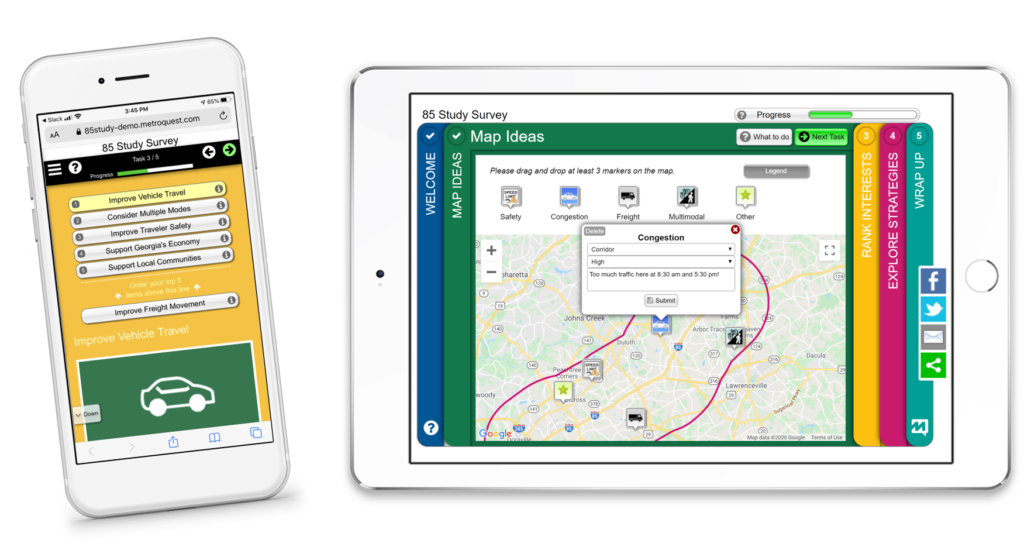
The Georgia Department of Transportation is conducting a comprehensive corridor study along I-85, between I-285 and I-985. The corridor is roughly 18 miles long, with 6 travel lanes, 16 interchanges, and serves approximately 300,000 vehicles daily. In the first phase of the study, the Office of Planning engaged the public to get input on how to reduce congestion, enhance traffic operations, and improve safety. Let’s look at a demo of their MetroQuest survey:
GDOT increased public participation to over 2,550 survey respondents!
For a corridor study, attendance at a typical public meeting might include 10 people, while a text-based online survey might reach 50 or 100. The planning team at GDOT successfully broadened reach, offering their MetroQuest survey in English, Spanish, Korean, and Vietnamese, to gain valuable public input from 2,550+ residents! Several unique MetroQuest features made such high public participation possible.
No Registration. MetroQuest doesn’t require registration and leaves demographic questions to the end. Planners don’t need participant names and contact information since personal responses are not expected. Eliminating upfront registration drives up participation rates from the standard 10-15% upwards to 50-80% with MetroQuest.
5-Minute Experience. Public participation drops drastically (by over 90%) when planners ask the public for more than 5 minutes of their time. GDOT launched a great MetroQuest survey that took just 5 minutes to complete. It was fast and easy for residents to provide input with a click, drag, and drop, minimizing lengthy typing.
Project-Specific Input Fast. Planners need time-bound feedback at specific stages of planning projects. GDOT engaged 2,500+ people in three months with their MetroQuest survey live from December 5, 2019 to March 2, 2020. All the public input stayed within project scope, with specific questions seeking public influence on key project outcomes.
Any Device. MetroQuest surveys are responsive and optimized for mobile. GDOT was able to engage Georgians across all their devices – from any smart phone, tablet, laptop, or computer connected to the internet – without the struggle of pinching and zooming. With MetroQuest, it’s common for 50 to 70 percent of respondents to participate from the convenience of their mobile devices, anytime, anywhere.
“Fun” Drives Social Sharing. Visually engaging surveys, packed with colorful images, are readily shared via social media, which dramatically broadens demographic reach. GDOT used MetroQuest’s social sharing buttons to encourage participants to share the survey.
Microlearning helped GDOT planners collect informed public input!
Completing an interesting, interactive survey that informs while collecting feedback is a rewarding experience. MetroQuest offers visualizations and interactive elements that feel more like games than surveys. Comments such as, “Great survey, wonderful project. So fun, I learned so much”, showed us that participants loved the experience. Georgians “learned while answering” with education weaved into the experience in microlearning moments, giving planners confidence that the input was informed.
Microlearning. In their MetroQuest survey, GDOT welcomed Georgians with a succinct overview of the 85 Study. Participants then ranked priorities with short descriptions. While rating strategies, they learned how to increase capacity and improve safety. People gained appreciation for the scope and scale of the project, while providing input.
Planning Templates. MetroQuest uses gamification to educate the public in minutes using survey templates designed for planning. Participants visualize the pros and cons of different scenarios, stack coins to allocate budgets, rate images (like ranking five kinds of bike lanes to realize nuances), gain appreciation for competing tradeoffs, drop markers on maps, and use dynamic slider bars to fund projects using taxes and fees.
Input from the public for the 85 Corridor Study was 100% free of bias!
The 2,550+ Georgians who took the MetroQuest survey each had an identical public engagement experience – a clean map for their ideas, identical priorities to rank, and the same strategies to rate. The 1000th participant used the same uninfluenced input mechanism as the 1st participant, unaware of prior community input.
Clean Map. Some tools allow residents to drop markers on public web maps – the problem is that input becomes biased by all the markers previously added by others. A cluttered map also makes it difficult for participants to see where to place their markers, particularly on smart phones. GDOT used MetroQuest to collect over 25,200 map marker attributes, free of bias, while making the experience quick and easy.
Private Experience. GDOT planners used MetroQuest for direct, one-way public input to uncover true community preferences, free of peer influence, social intimidation, and toxic banter. Each survey experience was identical and private.
Nearly 50,000 data points were collected to inform the 85 Study!
The Office of Planning now has nearly 50,000 data points to support data-driven improvements to the 18-mile stretch on the I-85. This quantifiable data includes 25,000 spatial map marker attributes and 24,000 strategy ratings – it will help in recommending projects that meet the true needs of local stakeholders who depend on the corridor.
Comments in Context. GDOT planners added comment boxes in their MetroQuest survey to add context for the quantitative questions they asked. They collected over 6,000 comments to bring color and commentary to supplement the data.
Charts & Graphs. Using the MetroQuest Data Center, GDOT planners are exploring charts and graphs to build their study reports. Colorful visualizations of all the quantitative public input will support their recommendations, impress the Board, and build confidence for project approvals.
We’d like to congratulate the team at GDOT for their outstanding online public engagement success! You’ve gained tremendous public support for your 85 Study. Thank you for subscribing to MetroQuest – our team looks forward to seeing many more surveys from GDOT this year.
We hope that GDOT’s success story will inspire other agencies to endow their planners with North America’s only online public engagement solution purpose-designed for planning. When more members of the public participate in planning we get more livable cities and we’re able to move more people. We all benefit!
To learn more, contact us today or watch the on-demand webinar: Optimizing Online Engagement for Local Government with MetroQuest.

Optimizing Online Engagement for Local Government with MetroQuest
Online tools are a critical part of the public engagement tool box. This webinar highlights how local governments are optimizing online engagement for the best results.