Austin Engaged 5,100 People Using Nextdoor to Promote its MetroQuest Survey

In my last post, I shared six tips for using Nextdoor to promote your agency’s survey to effectively engage thousands online. Let’s now turn our attention to the City of Austin’s success story, and how they turned their Nextdoor residents into survey respondents with a well-designed MetroQuest survey.
Facing rapid population growth, America’s number one boom town needed to plan for the city’s transportation future and started the process by engaging the public. In partnership with national firm, Kimley-Horn & Associates, Austin had spectacular success with its MetroQuest survey for the Austin Strategic Mobility Plan (ASMP). In all, the team engaged over 5,100 survey respondents, and using Nextdoor was clearly a great strategy for them.
Liane Miller, Senior Business Process Consultant at the City of Austin recently guest starred in a MetroQuest webinar, where she explained how Nextdoor helped her team expand their reach not only to Nextdoor members but also beyond as members took the information off the platform into their own messages and newsletters, spreading it to their networks.
Nextdoor helped Austin get thousands of visitors to its MetroQuest survey for FREE!
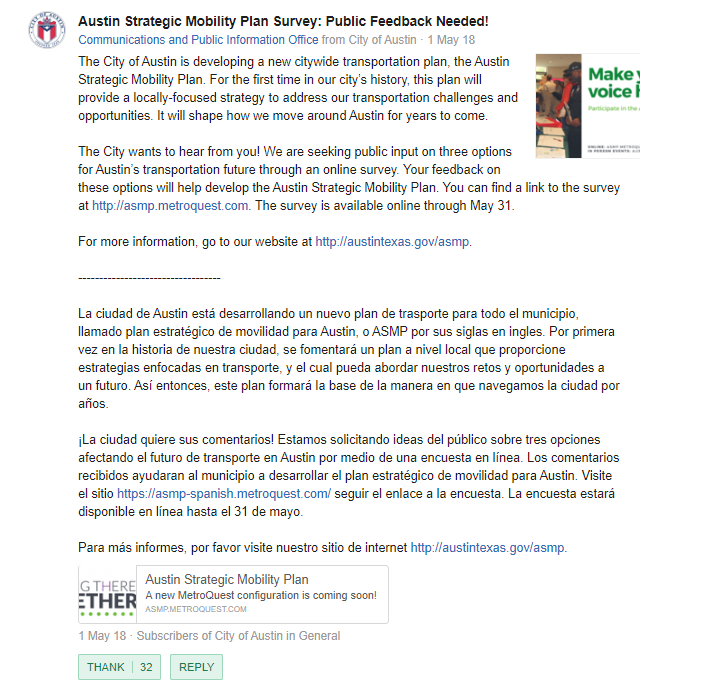
Posting a message to all subscribers of the City of Austin, Liane’s initial post used clear and unambiguous language without jargon or acronyms. It was short, to the point, and included a clear call to action front and center. “Public Feedback Needed!” was stated in the subject line. This post made it easy for people to find the link to the survey as well as the link to the city web page featuring project information. Check out an image of Liane’s first multi-lingual post below.
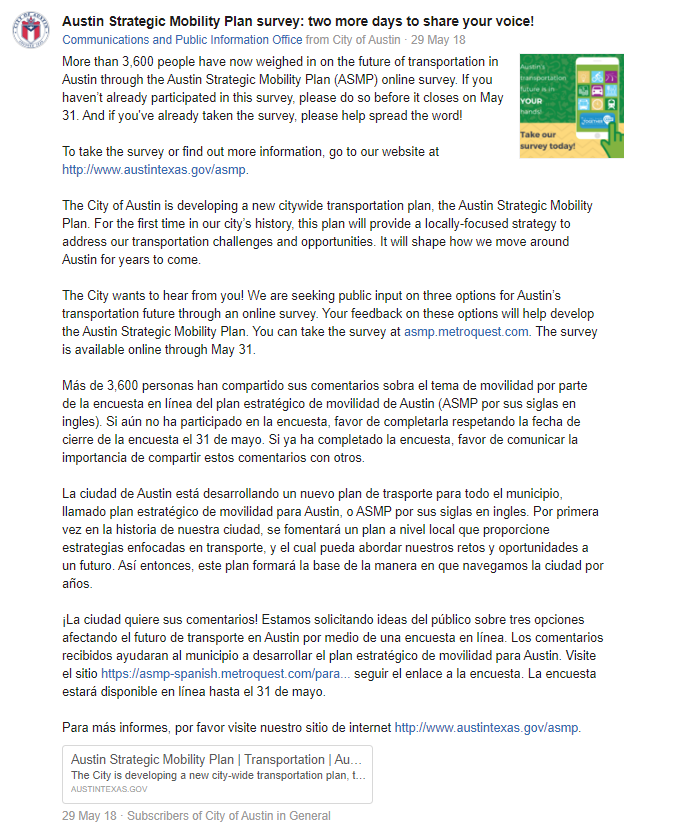
The follow up post, only a few weeks later, highlighted that thousands of other residents had already weighed in. It asked those who had participated to spread the word, and it invited those who hadn’t provided feedback yet to do so now. Given that only a few days were left, a sense of urgency was created by calling attention to the upcoming closing date right in the subject line: “two more days to share your voice!”
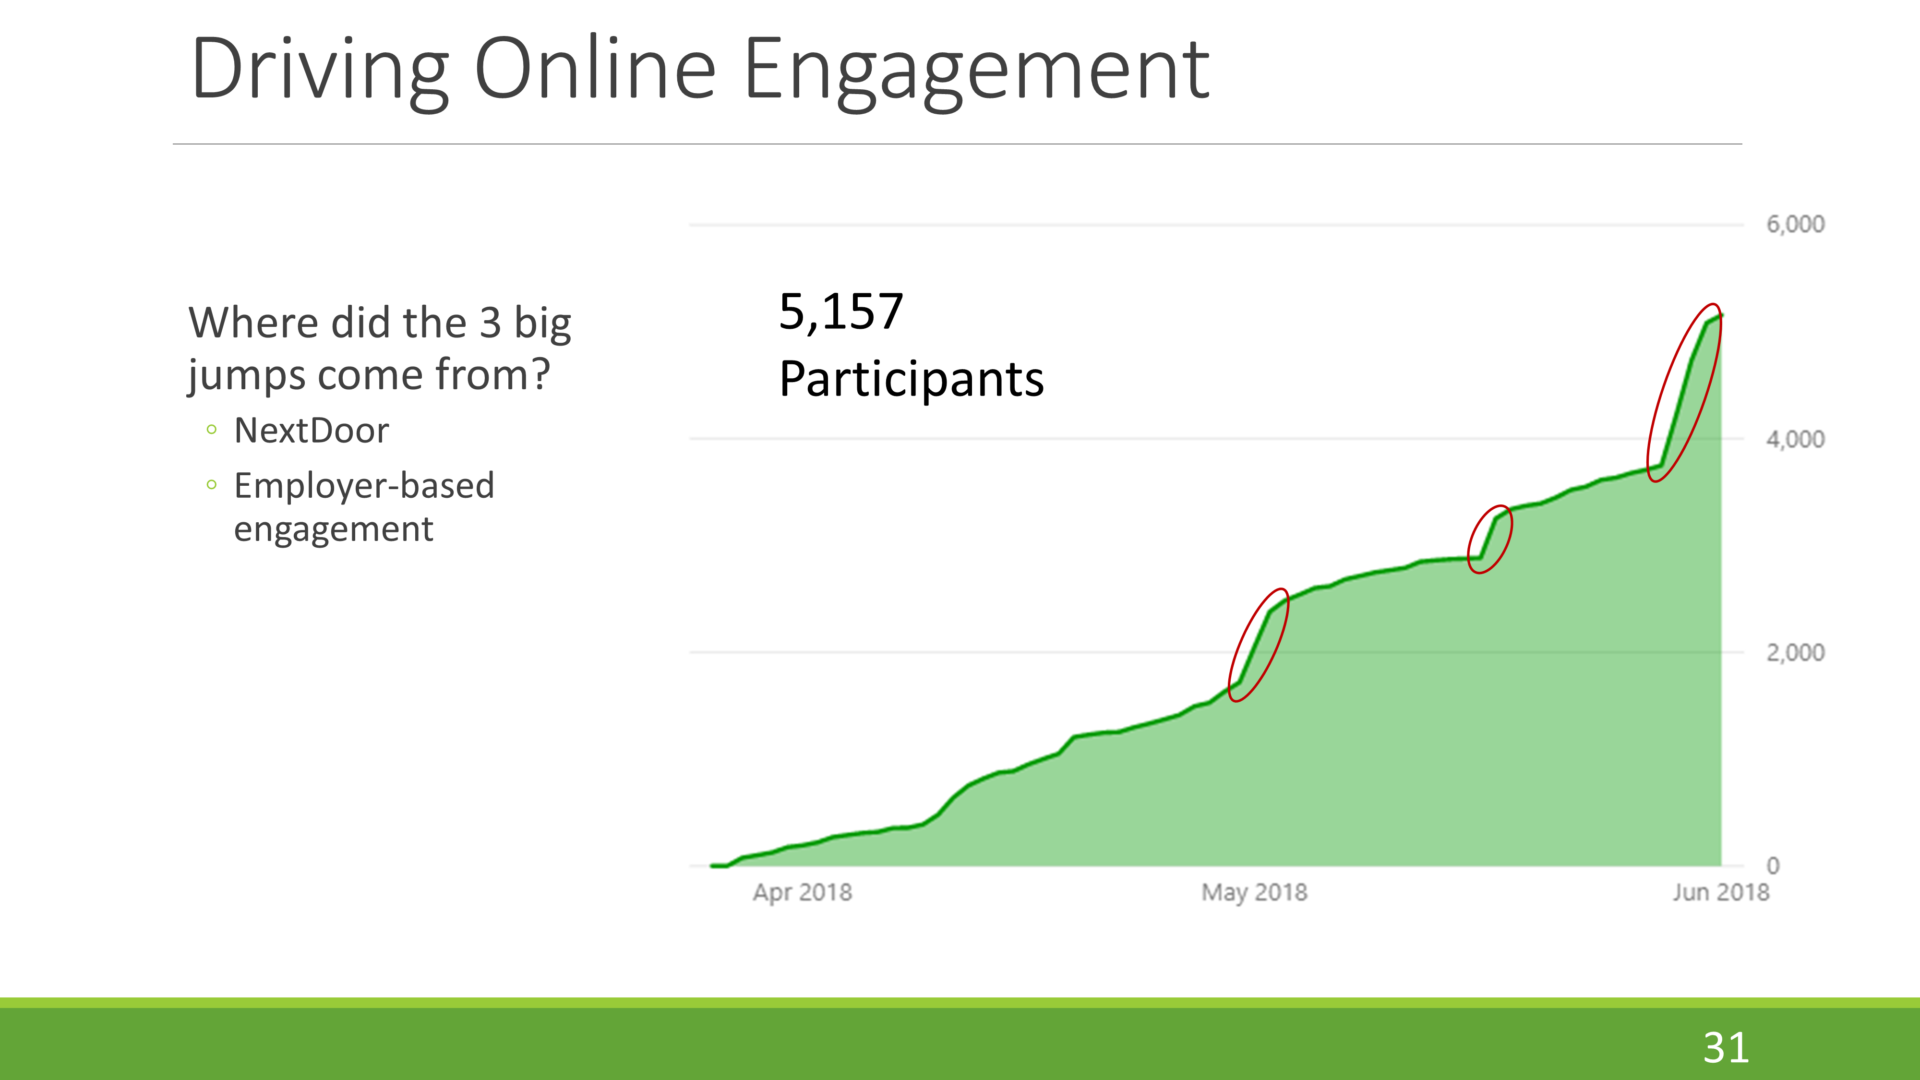
The FREE posts had their desired effect! Two of the three massive jumps in participation numbers correlated to these two posts on Nextdoor. In Liane’s own words, Nextdoor was “really helpful in expanding our reach!” The slide from Liane’s webinar presentation (shown below) highlights MetroQuest participants over time. A third jump, in the middle, is attributed to an employer-based engagement strategy, which Liane discussed in the webinar.
A well-designed survey helped drive high public participation!
Let’s dig a little deeper into the MetroQuest survey itself, and why great design is so important to public participation. To satisfy your curiosity, you can try a demo version of the survey here:

For a bit of background, Austin’s population is expected to double in the coming 30 years. At the time of the survey, the City was in the second phase in the process of developing a transportation plan, called the Austin Strategic Mobility Plan (ASMP), which included mobility-related goals to plan for Austin’s near- and long-term transportation investments. Policies, programs, and projects related to all modes of transportation were included, such as driving, transit, active transportation, and carpooling.
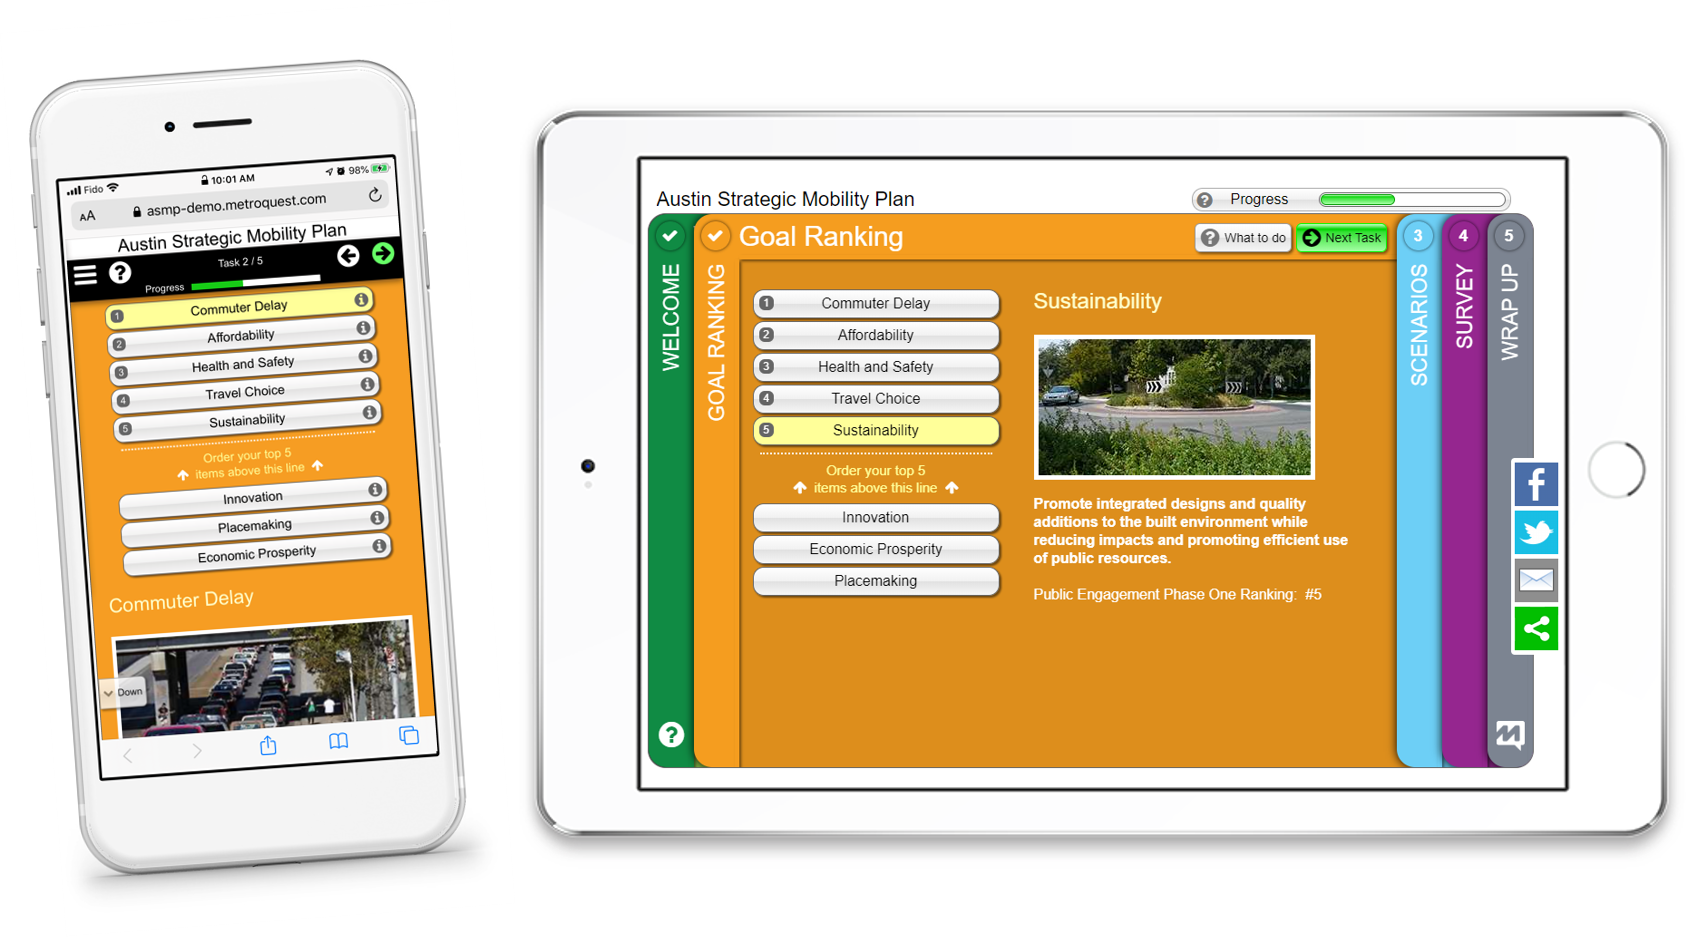
As a first interactive exercise, the survey asked participants to rank their top five out of eight goals: namely, Innovation, Sustainability, Travel Choice, Commuter Delay, Placemaking, Affordability, Economic Prosperity, Health and Safety. These goals had been identified in the first phase of their plan development and engagement. Starting with prioritizing goals that matter to residents was a terrific way to get participants engaged in the survey.
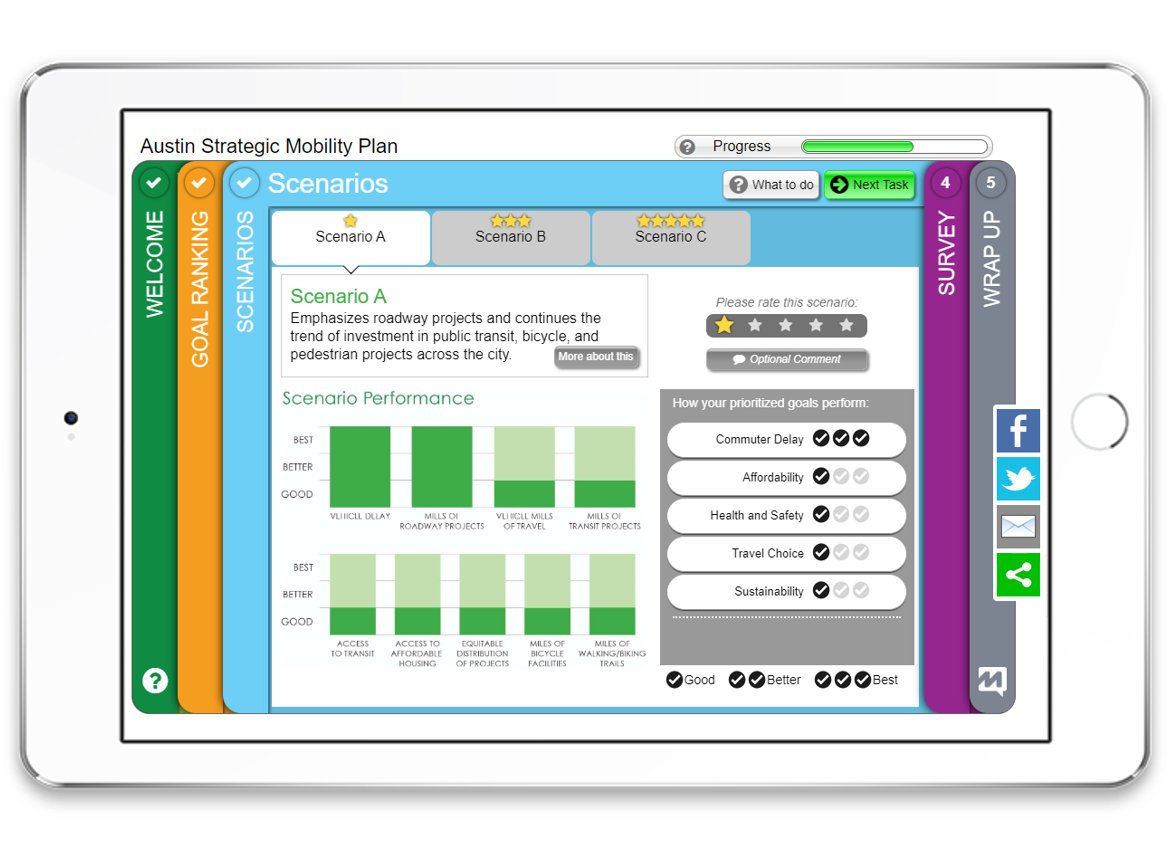
Then, the survey presented three scenarios that differed in their levels of investment in various transportation types. Survey respondents were asked to rate each of the scenarios on a scale from one to five stars.
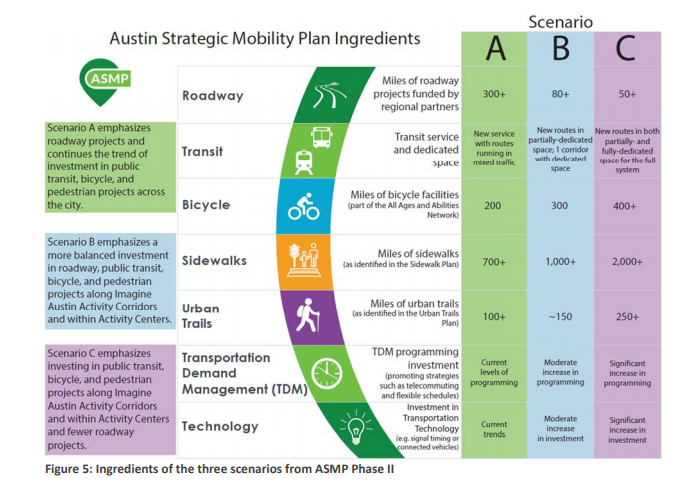
- Scenario A emphasized roadway projects and continued the trend of investment in public transit, bicycle, and pedestrian projects across the city.
- Scenario B emphasized a more balanced investment in roadway, public transit, bicycle, and pedestrian projects along corridors and within activity centers.
- Scenario C emphasized investing in public transit, bicycle, and pedestrian projects along corridors and within activity centers and fewer roadway projects.
To create a more personalized and educational experience, the goals previously prioritized by the survey respondents were listed on the right-hand side, with a visual indication of how each scenario performed against selected goals. This made it easy for participants to easily see which of the scenarios best aligned with their prioritized goals.
Finally, before wrapping up with links and a few demographic questions, additional questions were asked on the items the participant had identified as important. For each priority, a number of potential strategies were presented, and participants were asked to identify the ones that promoted the priority best. The survey stated, “One transportation scenario will become the starting point to tailor a strategy for Austin. Your answers to the survey questions on this screen will help create our preferred strategy.” It asked which of the scenarios should be used as a starting point.
Austin’s survey was so well designed and engaging that it received a completion rate of over 62%. This is especially impressive when compared to the standard public completion rate of 10 to 15% for online multiple-choice surveys.
Austin collected 101,979 valuable data points of informed public input!
The City of Austin’s ASMP results are impressive in many ways. A few interesting statistics, straight from their report, are shared below.
- A total of 5,774 participants provided their feedback online.
- Commuter Delay is clearly the number one priority, with Affordability as a close second. Health and Safety, Travel Choice, and Sustainability are tightly grouped as the third through fifth most important priorities.
- For People with Mobility Impairments, Travel Choice is the second highest priority in terms of times ranked.
- For Seniors, Health and Safety is the second highest priority in terms of times ranked.
- For both Youth and People of Color, Affordability is the number one priority in terms of times ranked; however, Commuter Delay also ranked highly.
- Scenario C was the highest rated option; it received almost double the amount of 5‐star votes over A or B. In fact, 42% of the overall population chose Scenario C as the starting point, with Scenario B as the second most popular choice. That meant Scenario A, with a focus on roadway over transit, was least popular.
- The top strategy chosen to address transportation issues is to “provide more public transit service and enhance connections to/from public transit.”
- More than one-third of all comments discuss the need or desire for more transit in the city.
- There was a focus on four traditionally underrepresented groups, namely Youth (Age 15-24), Seniors (Age 65 and older), People with Mobility Impairments, and People of Colour. A total of 1,844 survey respondents fell into at least one of these four groups.
The full results can be found in the report here. These results informed the third and final phase of the plan development and engagement, which concluded the ASMP. The results from the third phase can be found here.
Congratulations to our friends at Kimley-Horn and the City of Austin for a fun and informative MetroQuest survey and very impressive results!
For an in-depth look at the City of Austin’s successful engagement strategy watch Liane’s full webinar here.