Category: Transit

  • Increased Public Participation in Transit Planning Builds Support for Sustainable Transportation

    Increased Public Participation in Transit Planning Builds Support for Sustainable Transportation

    From the very beginning, we at MetroQuest have made it our mission to deliver great online public engagement experiences that broaden outreach to meaningfully include the public in planning more livable places and moving more people. We always love to see great online surveys used to engage the public in transit planning!

    After all, it’s perfectly logical to collect community input since transit is a public transportation system, by definition, designed to move the public. Indeed, community engagement is a critical aspect of the transit planning process, and we have some a few tips and success stories to inspire you.

    Tip #1: Increase public participation by engaging the public online.

    Transit agencies are particularly brilliant at increasing public participation by extending their outreach programs online. They have a captive audience! While transit goers are not likely to get on the bus or subway to attend a public meeting, they will certainly give agencies five minutes of their time to take a survey from their mobile phone. Online surveys make it easy to engage the public where they are – on their devices, while riding on transit or from the comfort of their homes. We’ve seen transit agencies, from coast to coast, successfully engage thousands online, again and again.

    Tip #2: Collect public input early in the transit planning process.

    It’s important to engage the public early in the planning process, providing people with information and giving them the opportunity to offer feedback. In order to get buy in and gauge interest in a specific public transportation option, for example, it’s crucial that the community learns of its benefits, drawbacks, or tradeoffs before any major planning occurs. This allows planners and decision makers to understand the public’s needs, priorities, and interests to build alternative transportation scenarios.

    Tip #3: Use new ways to reach traditionally underrepresented groups.

    Transit agencies from LA Metro to New York’s MTA are successfully increasing equity and dramatically broadening outreach with online surveys and promotions. Using Facebook and other social media as a promotional channel helps agencies reach groups that aren’t likely to attend a public meeting.

    By engaging traditionally underrepresented groups – including all ages, ethnicities, and incomes – online surveys allow transit agencies to better understand public priorities and design transit to truly meet the needs of people who need it most.

    Broad public input is uncovering public preference for sustainable transportation options, including light rail.

    Perhaps what’s most interesting about public engagement is the results themselves – increased public support for transit and hundreds of thousands of data points to build data-driven transit plans. What public input tells agencies in turn helps planners and decision makers focus on the options that receive the most public support.

    Light rail, one of these options, is fast becoming a popular public transportation favorite and the benefits are wide ranging. According to the Federal Transit Administration, transit in general plays a vital role in contributing positively to sustainability efforts. Rail, more specifically, has a number of environmental benefits, including:

    1. Improved air quality, since most rail transit emits little or no pollution;
    2. Reduced greenhouse gas (GHG) emissions; in fact, light rail produces 62% less GHG than an average single occupancy vehicle;
    3. Overall energy savings due to a lower use of fuel;
    4. A decreased need for infrastructure for and manufacturing of vehicles;
    5. Reduced congestion, which makes life easier for travelers and positively contributes to improved air quality, reduced GHG emissions, energy savings, and fuel savings;
    6. More compact development, which leads to land conservation as well as decreased travel demand;
    7. Economic development; and,
    8. Greater access to affordable mobility.

    Sustainability is a hot topic for most communities. But if planners don’t ask, it’s difficult to uncover definitively what the public wants.

    Let’s look at a case study from the East Coast. Hillsborough MPO in Florida recently used a MetroQuest survey (you can try the demo here) to engage 9,575 residents, who provided nearly 236,000 data points of public input. This data was instrumental in uncovering new insights into local transportation needs and preferences. In an 4-minute interview, the agency’s Executive Director, Beth Alden, shared her delight in uncovering broad public support for light rail:

    “There was so much interest in passenger rail as an option in this survey. I was kind of surprised. And, what that means is we get to keep that kind of technology on the table as we move into our Long Range Transportation Plan.”

    By broadly engaging the public and gathering such amazing amounts of data, Hillsborough MPO discovered that their local community hugely supports light right as a public transit option. This information is allowing them to confidently create transit plans that reflect public opinion.

    In San Francisco, SFMTA increased public participation involving 8,100+ in support of its Central Subway Extension Alternatives Study.

    On the West Coast, San Francisco has already capitalized on the benefits of light rail with its extensive Muni Metro network, the third busiest light rail system in the United States. Faced with projected growth of nearly 1,000,000 residents by 2049, the need to expand their public transit system is becoming ever more critical.

    Recently, the San Francisco Municipal Transportation Agency (SFMTA) used MetroQuest as their digital community engagement survey to inform the public of a possible extension to the Central Subway route. The team needed to gauge the public’s priorities and support for the project. Their survey was part of the preliminary analysis of their forthcoming Central Subway Extension Alternatives Study.
    The goal of SFMTA’s project team was to increase public participation beyond the initial on-the-ground community outreach. In a recent interview, Adrienne Heim, Public Information Officer at SFMTA, described the efforts, “Last year we went out to merchant and neighborhood groups to discuss the study, ask people how they got around the city of San Francisco, their transportation goals, and how the study could incorporate or support some of those goals. That included gathering ideas for routes and station locations.”
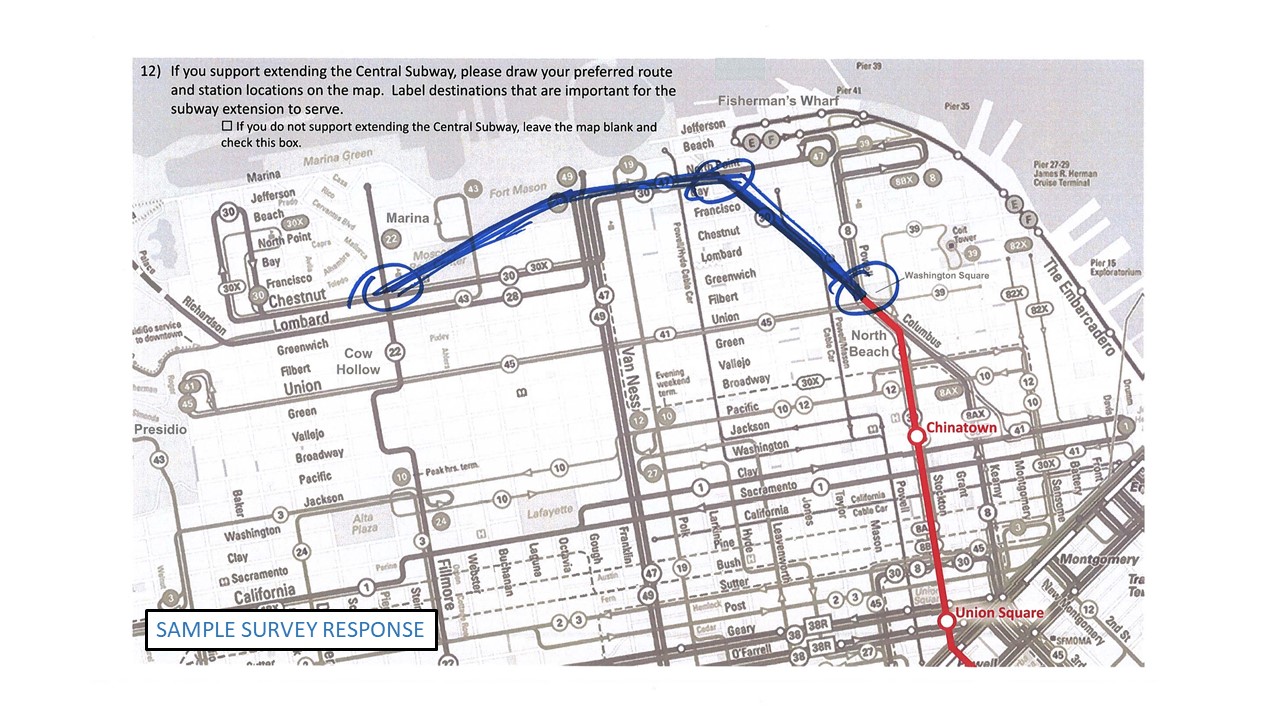
    On the ground efforts resulted in the completion of 129 paper surveys. Adrienne next described how going online increased public participation by over 62,000%,

    “The survey results were amazing and well beyond our expectations. Within three days of deploying MetroQuest, we received 1,000 responses, and towards the end of the survey, we received 8,137!”

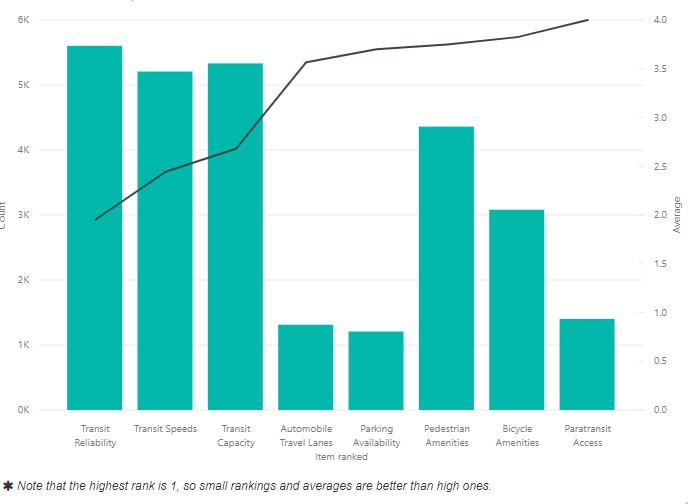
    The survey cleverly asked about transportation goals to get a picture of what the public valued. Respondents who supported travel reliability and capacity building to reduce crowding supported the extension. Fewer prioritized such investments as preserving on-street parking or car travel lanes – these respondent preferred more infrastructure for cars and personal vehicles. Additional goals included accessibility and active transportation, namely bicycle and pedestrian amenities. SFMTA was pleased to share the results with the public, with overwhelming support for transit:
     

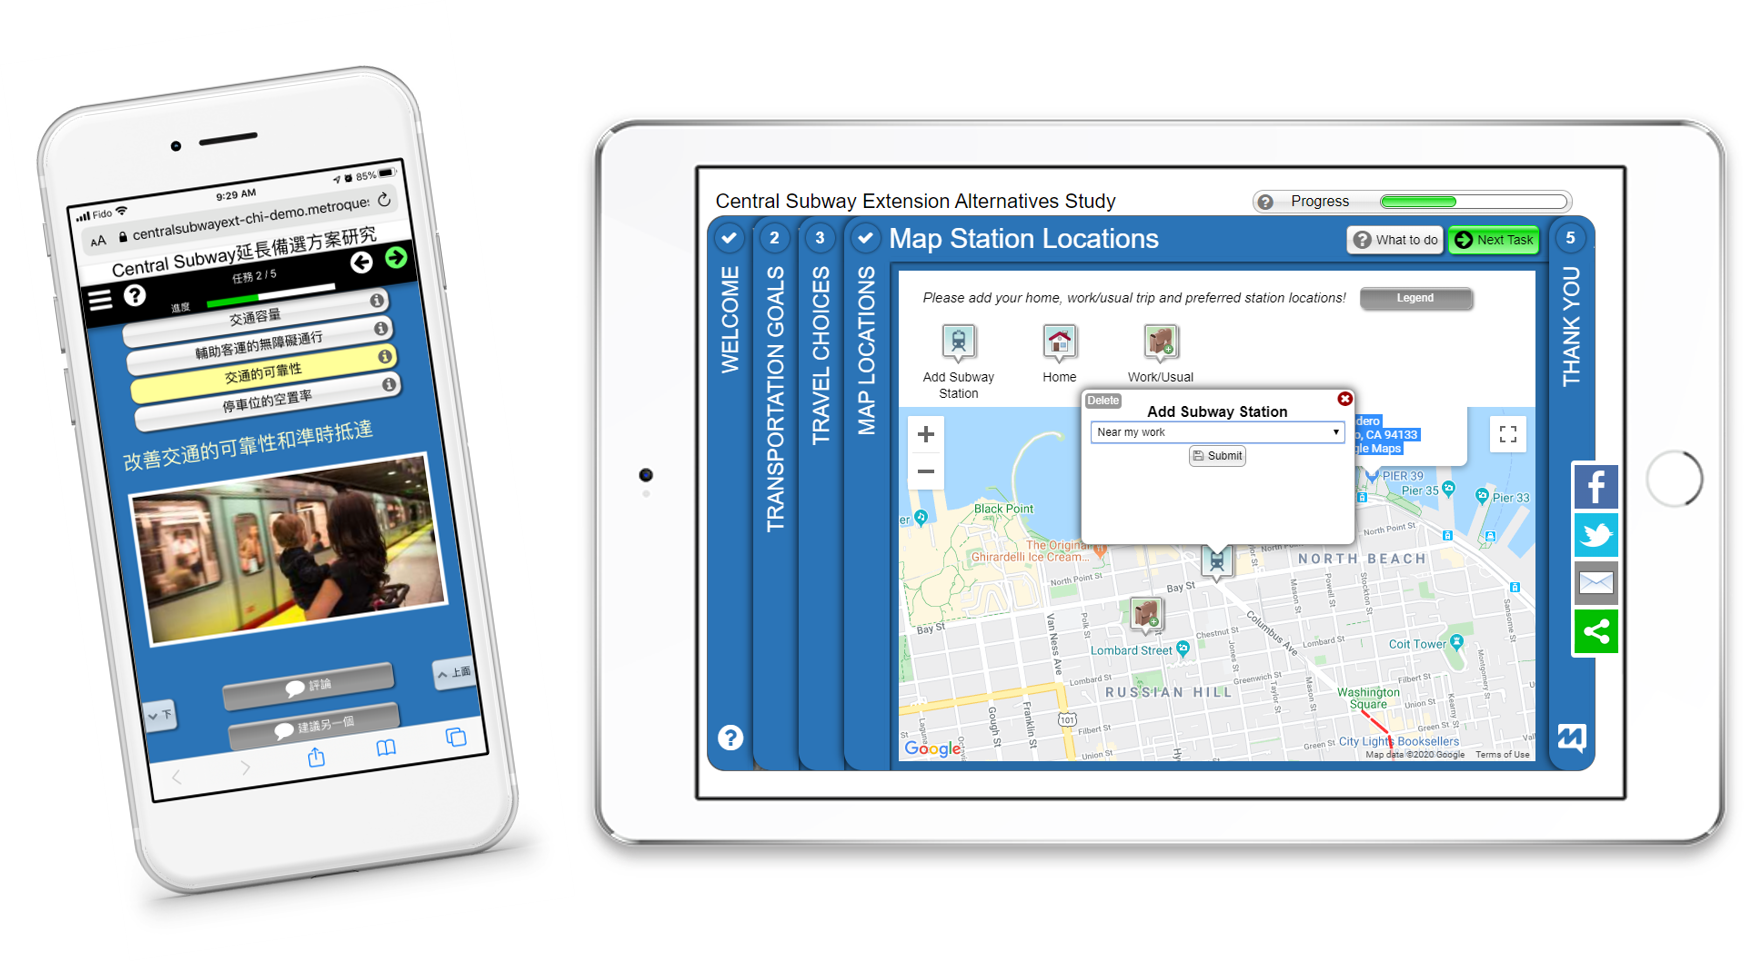
    The survey continued to ask about travel choices, such as current travel modes, as well as questions about the extension itself and potential routes. It then provided a map for supporters to concretely identify their origins and destinations, as well as preferred new station locations before wrapping up with demographic questions and additional information about the project.

    “Having the ability to disperse our survey quickly and easily online was greatly beneficial to us,” explained Tracey Lin, Deputy Project Manager. “Our survey was also built for mobile engagement thanks to MetroQuest, and it was easily accessible to stakeholders from all over the city who are interested in our project.”

    All in all, SFTMA collected 148,405 insightful data points to inform their transit plan, and 13,737 public comments to give context to specific feedback.

    “The way that we could structure questions through MetroQuest allowed greater feedback and input, enabling a more robust planning analysis,” concluded Adrienne. “Those 8,137 survey responses allowed us to confirm that most respondents want a subway that goes beyond the Northern Terminus and a little bit towards the West.”

    The Central Subway will be a long-term investment in a transportation system that will meet the needs of growing populations in a sustainable way. It is estimated that the Central Subway will serve 35,000 customers daily when it opens!

    While a concept feasibility study from 2015 showed that an extension is technically possible, it didn’t show what the public preferred, which is why a four-step alternatives study is currently underway to understand the desirability of the extension, as well as to determine goals, possible routes, and station locations that will best serve the community. We’re thrilled MetroQuest could help.

    For more on this outstanding success story, play Adrienne’s 3-minute video interview here:
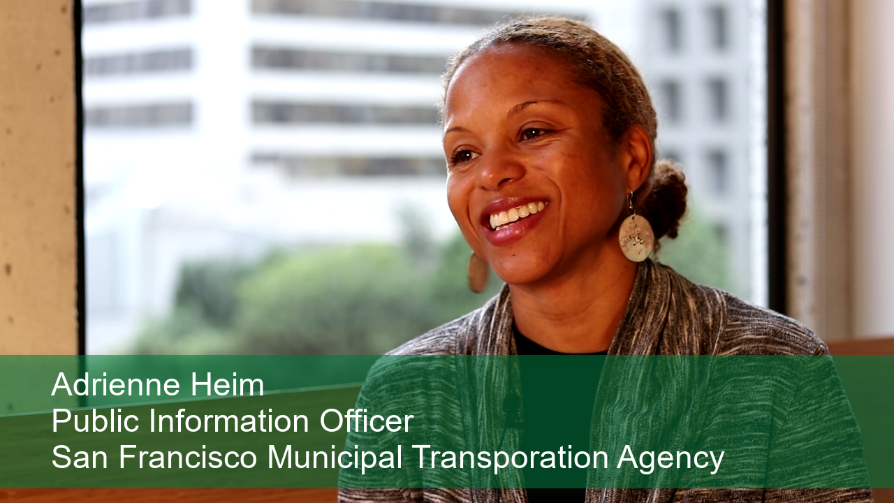
     

    If you’re looking for the best way to celebrate International Women’s Day 2020, you can also dive deeper into this success story with the webinar: Celebrating Brilliant Public Engagement by Women in Transit Planning with SFMTA. Thank you Adrienne and Tracey for celebrating #IWD2020 with us this year and congratulations on your outstanding achievements!

  • [SUCCESS]  Los Angeles County and Arellano Launch New MetroQuest Transit Survey

    [SUCCESS] Los Angeles County and Arellano Launch New MetroQuest Transit Survey

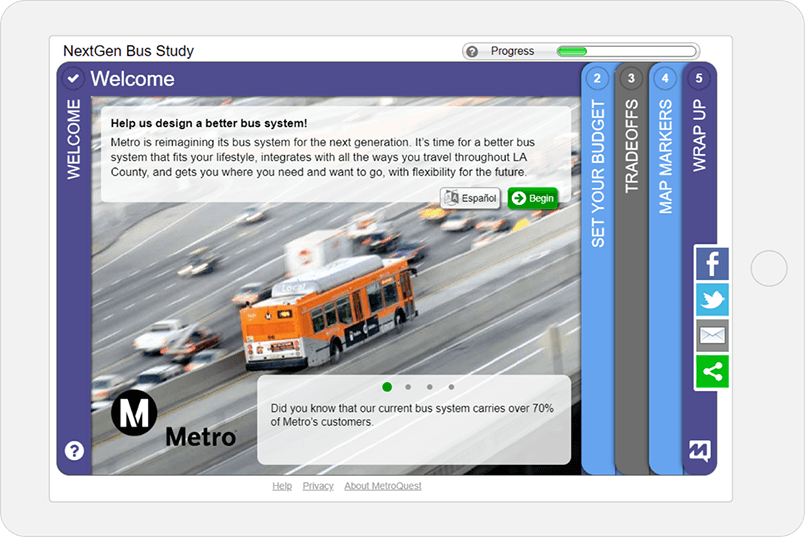
    Los Angeles County has embarked on an exciting public outreach effort to engage citizens in reimagining the bus system for the next generation. The current system hasn’t had a major update in 25 years but carries over 70% of LA Metro transit users. With over a million residents added, the County has become more vibrant with even more places to go and all new travel patterns – it was time to design a modern, usable bus network that serves modern needs.

    To offer a highly visual and interactive online survey experience – that both educates LA County citizens about the alternatives and collects informed public input – LA County and planning firm Arellano Associates chose MetroQuest.

    The MetroQuest Site for the NextGen Bus Study is now live and fabulous! Take a look at the demo version of the survey here (demo data will not be counted toward the final results):

    LA Metro MetroQuest survey

    While all MetroQuest Sites start with a Welcome Screen and conclude with a Wrap Up Screen, up to three additional question-oriented Screens are selected (from 14 available Screen templates) to collect interesting and dynamic data that can be used for various public engagement projects. Let’s take a look at the three MetroQuest Screens specifically chosen for the NextGen Bus Study and explore how they educate the public about the project while allowing them to place the future of transit in their own hands.

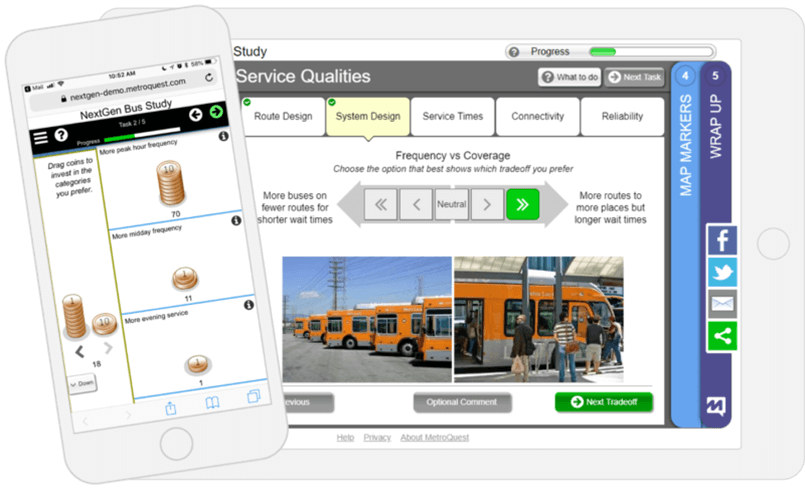
    The Budget Allocation Screen gamifies budgeting and spending by asking LA County citizens what decisions they would make about transit spending.

    Participants invest coins in the areas they feel need the most focus, giving LA Metro insights into the options that are most important to the public, while weighted data reveals how much more important alternatives are in relation to the others. Answers to this question will empower LA County to understand transit market demand.

    LA Metro MetroQuest screens for project

    The Tradeoffs Screen allows LA County residents to choose their preferences in what the new design will focus on, whether it’s more stops, bus frequency, service hours, or wait times. This will help make important decisions about how to redesign the transit system to better fit what people want and need.

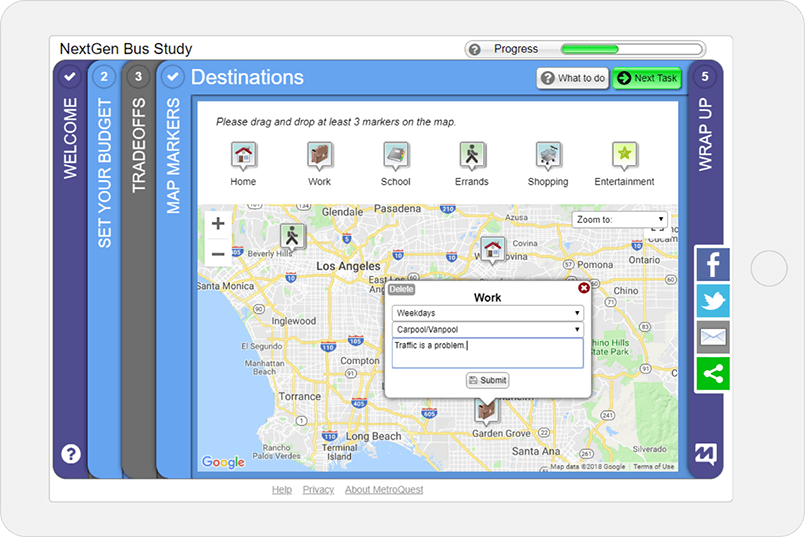
    The Map Markers Screen will help identify exactly what LA citizens need today by giving them the opportunity to map their trips and explain how they get around, as well as what challenges they face in the process. The data collected with this MetroQuest Screen will allow LA Metro to see how the existing system serves current and potential users and to identify weaknesses for the new transit system to address.

     map marker screen

    LA Metro engaged Arellano to plan their outreach strategy, aiming to engage frequent, occasional, and infrequent riders, as well as non-riders to see how best to serve them over the next 25 years. They’ll be using this information to create smarter bus lines that can serve the community in the long term.

    Congratulations to Arellano and LA Metro on launching a fantastic MetroQuest Site!

    We love to celebrate great engagement. The quantifiable and actionable results from this MetroQuest Site will inform the future of LA County’s bus systems for the next generation. We can’t wait to see how the data collected will help shape and develop a modern transit system that meets the current and future needs of people who work, live, and play in LA County.

  • [WEBINAR] A Recipe for Award-Winning Online Community Engagement Featuring VIA

    [WEBINAR] A Recipe for Award-Winning Online Community Engagement Featuring VIA

    This highly visual webinar presents research findings, proven best practices, practical tips and award-winning case studies to guide agencies towards the successful application of online community engagement for planning projects. Participants walk away with an understanding about how to leverage digital engagement to achieve unprecedented results using cost-effective tools.

    This webinar showcases a wide range of outstanding planning projects throughout Texas, New Mexico and Arizona. Our special guests from VIA Metropolitan Transit join us to talk about the VIA Vision 2040 Long Range Plan, one of the most innovative and successful outreach efforts we’ve ever seen. They discuss the innovative ways they combined online and targeted face to face community engagement to involve over 3,000 community members to help inform the transit plan for the San Antonio region. They also share advice for agencies seeking to improve the diversity and effectiveness of their community engagement efforts and talk about the positive difference that broad community support is making as they move forward.

    Watch Recording

    View Slides

    This webinar featured three presenters: Dave Biggs from MetroQuest followed by Hannah Santiago from VIA Metropolitan Transit and Chester Britt from Arellano Associates.

    Comments from participants

    “Great presentation and very inspiring!”

    Additional Reading

    As described in the webinar, this user guide expands on several of the best practice recommendations. Since it was originally written for MetroQuest users, two of the sections apply specifically to MetroQuest. The remaining five sections can apply to any online community engagement effort. We hope you find it useful.

    Bonus Case Study: NashvilleNext

    Mentioned briefly in the webinar, this case study of the NashvilleNext process shows why they were the 2016 winners of the APA 2016 National Daniel Burnham Award for a Comprehensive Plan.

    Q&A

    Here are the questions raised by participants that came in during the webinar that we didn’t get a chance to respond to during the session as well as some that came in after by email.

    Q: We’d like to learn more about MetroQuest. Who’s the best person to speak with about it?
    A: [From Dave] I apologize for not being able to provide more in-depth information about MetroQuest due to the educational nature of this session. The best place to start would be to connect with Derek Warburton at MetroQuest (by email to derek.warburton@metroquest.com, or toll free phone: 1-855-215-0186. Derek will be pleased to make sure you get the information you need. In the meantime, here is a quick video to give you a better sense of the software.

    Q: The large interactive screens at the public meetings looked great. Are they owned by MetroQuest or VIA? Any idea of the features and costs would be interesting.
    A: [From Hannah] VIA owns an interactive screen, but there are many places that rent the technology. Essentially it is a touch or interactive television that can be connected to a laptop on a stand with casters. [From Dave] We have a preferred pricing plan that we can share with agencies wishing to rent kiosks and ipad panels for outreach. Depending on the size of unit these range from $200 – $600 per month plus shipping costs from Arizona.

    Q: What kind of technical skills training is needed for a local agency to implement a digital process? Also, are there resources to understand the equipment and network capabilities for a small projects?
    A: [From Hannah] Before every outreach push, VIA hosted training sessions to ensure all survey administers had familiarity with the tool and survey questions prior to the outreach event. [From Chester] Most tools are designed to be user friendly and therefore don’t require a lot of training. [From Dave] Agreed. The level of skills is fairly low. MetroQuest, for example, can be configured simply by choosing your preferred screen types and then adding your text and images using a simple interface.

    Q: Is this a good method for community input to not be lost, ignored when projects are presented to City Plan Commission and City Council?
    A: [From Hannah] The Vision 2040 Long Range Planning process benefited from having a large number of people engaged and providing input. That guidance from the community directly informed the recommendations staff made to our Board of Trustees. Reporting the results and findings of each round of public engagement to the VIA Board of Trustees provided that policy making body with information they needed to understand whether or not staff recommendations reflected the community’s vision for transportation. [From Dave] Yes, we have found that by collecting input from a large and diverse range of citizens it goes a long way to encourage elected officials to pay close attention to the plan. In the past it’s been very easy to set aside a plan that is informed by the same ten people.

    Q: What is the best way of capturing all of the input you’re gathering from multiple online tools and making it available to the community?
    A: [From Hannah] Our consultant team at Cambridge Systematics analyzed all the input and formatted the major takeaways into infographics. The team used the infographics in presentations, outreach summary reports and the Long Range Plan documents. Next time we repeat the process, I would work with our Marketing and Communications team to share major findings in graphic form to our social media followers. [From Chester] At Arellano Associates we also use infographics as well as Smart Sheet, an on-line engagement tool that allows attachments to be directly linked to line items on a timeline or spreadsheet making it useful to track comments or input received.

    Q: What is your take on community engagement as a result of the recent election?
    A: [From Dave] I think that it’s fair to say that the tone of the dialog during this past election has been fairly toxic. A few months ago I interviewed James Hoggan on his new book, “I’m Right and You’re an Idiot: The Toxic State of Public Discourse and How to Clean It Up.” You might be interested in what he had to say. It holds more true each day. Read it here.

    Thanks again for your interest and participation in this webinar.

    James Hoggan, "I'm Right and You're an Idiot"
  • [WEBINAR] A Recipe for Award-Winning Online Community Engagement Featuring Anchorage

    [WEBINAR] A Recipe for Award-Winning Online Community Engagement Featuring Anchorage

    This highly visual 45-minute webinar presents research findings, proven best practices, practical tips and award-winning case studies to guide agencies towards the successful application of online community engagement for planning projects. Participants walk away with an understanding about how to leverage digital engagement to achieve unprecedented results using cost-effective tools.

    The webinar showcases a wide range of outstanding planning projects throughout the Pacific Northwest. Our special guests from the Municipality of Anchorage join us to talk about Anchorage Talks Transit, one of the most innovative and successful outreach efforts we’ve seen. They discuss the innovative ways they combined online and targeted face to face community engagement to more community members than ever before to help inform the plan. They also share advice for agencies seeking to improve the diversity and effectiveness of their community engagement efforts and talk about the positive difference that broad community support is making as they move forward.

    Watch Recording

    View Slides

    This webinar featured three presenters: Dave Biggs from MetroQuest, Michelle Poyourow from Jarrett Walker + Associates and Collin Hodges from the Municipality of Anchorage.

    Participant Comments

    Thanks so much for the great comments and kudos. Here’s some of our favorites:

    [Wow, thanks!]

    AICP CM Credits

    Here is the direct link to claim your AICP credits from the APA. Note that the date trips people up. This webinar is part of a series so they instructed us to set it up as an “on-demand” session so you’ll notice that the start and end are a year apart.

    Bonus Case Study: NashvilleNext

    Mentioned briefly in the webinar, this case study of the NashvilleNext process shows why they were the 2016 winners of the APA 2016 National Daniel Burnham Award for a Comprehensive Plan.

    Q&A

    Here are the questions that were raised by participants that we didn’t get a chance to respond to during the session.

    Questions for Dave from MetroQuest

    Q: MetroQuest looks like useful software. What is the best way to get more information about it?
    A: [From Dave] I apologize for not being able to provide more in-depth information about MetroQuest due to the educational nature of this session. The best place to start would be to connect with Derek Warburton at MetroQuest (by email to derek.warburton@metroquest.com, or toll free phone: 1-855-215-0186. Derek will be pleased to make sure you get the information you need. In the meantime, here is a quick video to give you a better sense of the software.

    Q: Once you choose your screens, etc., it works both on web and smartphone?
    A: [From Dave] Yes, all of the MetroQuest screen types are designed to work on computers and smartphones. The layout for each screen type is different on smartphones to make the experience delightful on those smaller screens. The software automatically detects the device type and gives people the layout best-suited for their device. Here’s an image to give you a sense.

    Q: Any advice for engaging EJ populations in the community?
    A: [From Dave] This is a critical topic and there is no short answer that is satisfying other than to say that using well-designed technology can help a great deal but some audiences will always benefit from a more “high touch” or “go to them” approach. It was so frequently mentioned as we interviewed agencies in our review of needs and best practices for community engagement that we organize a special webinar called “Engaging Vulnerable & Disadvantaged People in Planning.” It filled to capacity so quickly that we organized a second session which also filled up. We have therefore made it available to all on-demand via this link: https://metroquest.com/webinar-engaging-vulnerable-disadvantaged-people-in-planning/. You’ll also find some articles we’ve written on the topic here: https://metroquest.com/blog/. I hope this is helpful.

    Q: What is the cost of a yearly all-you-can-use level?
    A: [From Dave] My apologies for not being able to go into more detail about MetroQuest. Due to the educational nature of the webinar I did not feel that it was appropriate. The pricing for an all-you-can-engage annual subscription depends on the size of your organization so that even smaller agencies with tighter budgets can take advantage. If you are curious to learn more feel free to email or call Derek Warburton at derek.warburton@metroquest.com or toll free at +1 855-215-0186. He’ll be happy to help.

    Q: These surveys could be sent to an existing list as well or are they designed to be completed in-person at an interactive station?
    A: [From Derek] Most agencies send out the survey to various lists and otherwise promote them to as many people in the community as they can. They don’t have to be in person. Most complete from home or smartphone.

    Q: In the examples where tablets or kiosks were used for collecting input, was there any person-to-person interaction?
    A: [From Dave] In most projects there are a combination of web-based and face to face interaction. This was the case in the examples where kiosks and tablets were used. Kiosks can be used in a standalone setting such as a community center or library entranceway. In these situations, they are typically used without any person to person interaction. Tablets are most commonly used at events where there is a project team member within close proximity of the table where they are available allowing people to ask questions or chat if they feel inclined.

    Q: Is Anchorage using the transit plan process to identify public involvement best practices for consistent use in other city planning projects?
    A: [From Dave] Yes, in our ongoing pursuit of what’s working best in online community engagement the Anchorage case study is an important source of learning for us. We are very keen to see what happens in the next phase of outreach that is ramping up now. We have already discussed doing an update with Collin once those results are in.

    Questions for Michelle from Jarrett Walker + Associates

    Q: For the Anchorage Transit outreach, how different were the outcomes, compared to what the transit planning experts would recommend? How much did public engagement influence the outcomes?
    A: [From Michelle] You asked how different the results of the public surveys were, compared to what the planners would recommend. That’s a great question. The truth is, we don’t have a recommendation about how these trade-offs should be made for Anchorage. We may have an opinion about our own towns, where we are stakeholders, but we are not Anchorage stakeholders and our values are therefore irrelevant. As technical experts, we can show people the trade-offs, and encourage them to participate in making that difficult choice, but our opinions about how that choice should be made don’t belong in the process. We keep our technical recommendations separate from choices that are really about peoples’ values.

    For example, we can design an excellent high-coverage, low-ridership network, if a city values coverage more than ridership. Or we can design an excellent high-ridership (high-frequency), low-coverage network. Those are technical exercises. But which is BETTER for the community is not a technical question, and we don’t deign to answer it.

    Q: Did you tabulate people’s choices of their priorities? If so, how did you use that info?
    A: [From Michelle] We did indeed tabulate how many people selected each “Priority”, and how highly they ranked it. We then looked at those results, and shared them with decision makers. The results were what you might expect from the results we shared: strong interest in higher ridership and higher frequency service. However, there was also an interest in having high coverage, with some service close to everyone, and as you now understand that goal comes into conflict with a goal of high ridership (or high frequency). Which is why it was so important to ask people’s input, also, in response to those two scenarios, so that they would be forced to wrestle with the trade-off.

    Questions for Collin from the Municipality of Anchorage

    Q: Any pointers for increased turn out at follow up meetings? The Anchorage team described a series of follow up meetings that were not well attended. What purpose were those meetings to serve if no new proposal or scenario was presented.
    A: [From Collin] If we were to do this particular project again, we might not host “traditional” public meetings as follow-up events at all. We may have spent more time at pop-up events instead, for example informational tables at neighborhood events or setting up a table at other organizations’ meetings. We did some of those pop-up events throughout the project, and we got residents to take the MetroQuest survey that way (we had tablets at each event). However, with the clarity of hindsight, we would have allocated more resources to that pop-up strategy instead of investing as much time as we did in the traditional public meetings.

    In terms of getting more turnout for the public meetings, targeted mailings to residents within a certain distance of the venues could have helped.

    The purpose of the follow-up meetings was to provide a variety of locations and times after the kickoff that residents could engage with staff in-person about the project. But within the context of a relatively conceptual conversation about transit priorities, the traditional public meeting format was probably not the best choice for those follow-up efforts.

    Q: Was there any direct mailings done to residents to explain the whole project and direct people to the online engagement tools?
    A: [From Collin] We did not do any direct mailings, primarily because we did not have the budget that would have been required to mail info cards to all of the addresses on our existing routes. As an alternative, we opted to post flyers at community destinations throughout Anchorage in English and our four LEP languages (at coffee shops, grocery stores, municipal buildings, schools / universities, churches, ESL program offices, etc.).

    Q: Can you give us links or examples of “on-line mapping programs?
    A: [From Collin] The programs we considered for presenting our bus network concepts in the Implementation phase were MetroQuest, Wikimapping, and Remix. Our department recently purchased a Remix license to supplement our route planning process, so in the interest of leveraging existing resources we decided to use Remix as the primary web component of our Implementation outreach process. [From Dave] While MetroQuest has several mapping screens (https://metroquest.com/how-it-works/), they are designed to collect community input so they are more commonly used during the planning rather than implementation phases of projects.

    Q: Did you have interpreters available at every meeting? In the past, for example, I have indicated in an ad that if ADA accommodations were needed, participants could contact me directly. Did attendees need to request an interpreter or were they just available regardless?
    A: [From Collin] We provided and advertised interpreters at the big kickoff event as a matter of course, but for all other meetings we provided them on request only.

    Thanks again for your interest and participation in this webinar.

  • [WEBINAR] A Recipe for Award-Winning Online Community Engagement Featuring SCAG

    [WEBINAR] A Recipe for Award-Winning Online Community Engagement Featuring SCAG

    This highly visual 45-minute webinar presents research findings, proven best practices, practical tips and award-winning case studies to guide agencies towards the successful application of online community engagement for planning projects. Participants walk away with an understanding about how to leverage digital engagement to achieve unprecedented results using cost-effective tools.

    The webinar showcases a wide range of outstanding planning projects throughout Southern California. Our special guests from the Southern California Association of Governments join us to talk about the LA/San Bernardino Inter-County Transit & Rail Study, one of the most innovative and successful outreach efforts we’ve seen. They discuss the innovative ways they combined online and targeted face to face community engagement to involve community members to help inform the plan. They also share advice for agencies seeking to improve the diversity and effectiveness of their community engagement efforts and talk about the positive difference that broad community support is making as they move forward.

    Watch Recording

    View Slides

    This webinar features three presenters: Dave Biggs from MetroQuest, Stephen Fox from the Southern California Association of Governments and Yesenia Arias from Arellano Associates.

    Participant Comments

    Thanks so much for the great comments and kudos. Here’s some of our favorites:
    “Very informative webinar exploring how planners can improve the typical community engagement process.”
    “Great webinar for public outreach. Very interesting. The tool looks very effective!”
    “Great presentation–tips provided by Dave Biggs were very useful.”
    “One of the better webinars I’ve heard. Graphics were great.”
    “This was excellent. Planners are better professionals if they understand how their project is presented to stakeholders via multiple communication vehicles, including online. Increased public participation is typically an organization’s goal, and this presentation outlined how the So Cal Association of Governments did that.”
    “The newest concepts in outreach are well worth reviewing, and the variety of tailored outreach options is impressive.”
    “Interesting, upbeat, helpful as we will be writing a comp plan over the next two years.”
    “I really enjoyed this webinar and found it very useful and timely. It was a very visual presentation and I plan to look back at it again.”
    “Public engagement has always been a tough job. This webinar was great – highlights quickly what is working”
    Average rating: 4.6/5 stars

    [Wow, thanks!]

    AICP CM Credits

    Here is the direct link to claim your AICP credits from the APA. Note that the date trips people up. This webinar is part of a series so they instructed us to set it up as an “on-demand” session so you’ll notice that the start and end are a year apart.

    Bonus Case Study: NashvilleNext

    Mentioned briefly in the webinar, this case study of the NashvilleNext process shows why they were the 2016 winners of the APA 2016 National Daniel Burnham Award for a Comprehensive Plan.

    Q&A

    Here are the questions that were raised by participants or that came in after by email that we didn’t get a chance to respond to fully during the session. Note: there were a few questions directed to Steve and Yesenia. Those questions and responses will be posted in a few days.

    Questions for Dave from MetroQuest

    Q: MetroQuest looks useful. How can we get more info about it?
    A: [From Dave] I apologize for not being able to provide more in-depth information about MetroQuest due to the educational nature of this session. The best person is Derek Warburton at MetroQuest (by email to derek.warburton@metroquest.com, or toll free phone: 1 855-215-0186. Derek will be pleased to make sure you get the information you need. In the meantime, here is a quick video to give you a better sense of the software.

    Q: I’m curious to hear if any of your case studies featured the topic of zoning codes.
    A: [From Dave] I showed the following zoning project that used MetroQuest during the Q&A in the webinar and promised to share the link so you could play around with it yourself. Here it is: https://bensenvillezoningdemo1.metroquest.com/. Since MetroQuest is essentially a library of screen types that can be mixed and matched and tailored to meet the needs of a variety of projects it’s not possible to show all the possible combinations. If there are specific project types that you’d like to see Derek (contact info above) would be happy to provide examples that could give you some interesting ideas.

    Q: How have you dealt with organized opposition to projects? (i.e. the City of Claremont against Gold Line expansion)?
    A: [From Dave] While we answered this briefly during the Q&A I thought you might be interested in this blog post I wrote on an experience I call, “What I Learned When an Angry Mob Destroyed My Public Meeting.” It was so popular that I started a series call The Fiasco Files.

    Q: Would you share a copy of your online survey for the project?
    A: [From Dave] The SCAG project used this online survey: https://lasb-demo.metroquest.com/. Feel free to play around since this is a demo version that does not collect data.

    Q: What is the AICP course # for this webinar?
    A: [From Dave] The course number is 9102565. Here is the direct link: https://planning.org/events/course/9102565/

    Many thanks for joining us!

  • [WEBINAR] A Recipe for Award-Winning Online Community Engagement with COTA

    [WEBINAR] A Recipe for Award-Winning Online Community Engagement with COTA

    This highly visual webinar presents research findings, proven best practices, practical tips and award-winning case studies to guide agencies towards the successful application of online community engagement for planning projects. Viewers will walk away with an understanding about how to leverage digital engagement to achieve unprecedented results using cost-effective tools.

    The webinar showcases a wide range of outstanding planning projects throughout Pennsylvania, Ohio, West Virginia and the Northeastern US. Our special guests from the Central Ohio Transit Authority join us to talk about NextGen, one of the most innovative and successful outreach efforts we’ve ever seen. They discuss the innovative ways they combined online and targeted face to face community engagement to involve an unprecedented number and diversity of community members to help define the transit needs for the region. They also share advice for agencies seeking to improve the breadth and effectiveness of their community engagement efforts and talk about the positive difference that broad community support is making as they move forward.

    Watch Recording


    AICP CM Credits

    Here is the direct link to claim your AICP credits from the APA. Note that the date trips people up. This webinar is part of a series so they instructed us to set it up as an “on-demand” session so you’ll notice that the start and end are a year apart.

    COTA’s video from the presentation (the one that didn’t play well)

    Bonus Case Study: NashvilleNext

    Q&A

    Here are the questions that were raised by participants following the presentations with answers provided by the presenters.

    Questions for Dave

    Q: MetroQuest looks like useful software. What is the best way to get more information about it?
    A: [From Dave] I apologize for not being able to provide more in-depth information about MetroQuest due to the nature of this session. The best place to start would be to connect with Derek Warburton at MetroQuest (by email to derek.warburton@metroquest.com, or toll free phone:1 855-215-0186. Derek will be pleased to make sure you get the information you need. In the meantime, here is a quick video to give you a better sense of the software.

    Q: Do you have any bike/ped examples where MetroQuest was used for public involvement?
    A: [From Dave] MetroQuest is frequently used for bike/ped projects. Here are a few examples to play around with:

    Northern Virginia Regional Bikeway and Trail Network Study, VA – https://novabikedemo1.metroquest.com/

    HEPMPO, MD – https://bikehepmpodemo1.metroquest.com/

    Eastside Greenway, OH – https://esgdemo1.metroquest.com/

    Midway Cycle Track, OH – https://midway-demo.metroquest.com/

    Rim of the World, CA Rim Rec & Parks District – https://rimrecatp-demo.metroquest.com/

    Q: Is MetroQuest affordable for smaller communities?
    A: [From Dave] MetroQuest has recently launched an annual subscription which allows for use of MetroQuest on as many projects as you wish. The cost of the subscription scales based on the size of the organization to ensure that it remains affordable for smaller agencies. Here’s how to learn more. https://metroquest.com/contact/

    Q: I was curious as to whether by using the Metroquest software, if you do reach out to a larger demographic, do communities see things coming through that the staff may not have thought of.
    A: [From Dave] This certainly seems to be the case since we hear this comment frequently. The reality is that the types of people who agencies are used to hearing from represent a very narrow cross section of the community. MetroQuest clients report that the feedback that is received online is more positive and constructive than what generally comes out at public meetings. I think this is due to the fact that many who attend public meetings are fired up about the project, often not in a good way.

    Secondly, new information tends to emerge about community preferences since MetroQuest is specifically well-suited to reach a broader demographic that, in the past, has not been represented at all.

    A good example that comes to mind is a recent project about cycling. The voice that was missing in previous bike planning efforts in this community was the large group of people who do not currently bike but would be willing to start if certain changes were made. In the past they were missing because they did not identify as cyclists and were not passionate about the topic. It turned out that this missing demographic was uniquely suited to identify what changes would encourage the largest mode shift towards biking. By making is very easy to participate and getting the benefit of social media sharing this project was able to hear from over 7,000 people and they received over 50,000 inputs from the community including some valuable new insights for the bike plan. [Editorial comment: It’s case studies like these that make it all worthwhile.]

    Questions for Doug and Elliot from COTA

    Q: Did COTA’s public involvement process ask people about using Uber/Lyft type organizations for first mile/last mile services?
    A: [From COTA] COTA did not specifically ask about ridesharing companies in this phase. However, we did receive comments regarding these services. We asked the public what type of non-high capacity service improvements and investments the region should make using fairly broad categories without identifying the actual mode/vehicle. Modes and vehicles will be discussed in the spring of 2017 as part of finishing Phase 2 (out of 3) of the project.

    Q: Did COTA’s public involvement process/planning process ask/consider about the impact of driverless vehicles on their service?
    A: [From COTA] NextGen will consider driveless vehicles as part of the Vision 2050 plan; however, we did not specifically ask about these services during our Phase 2 outreach last year. Of note, the City of Columbus was recently awarded the FTA Smart City Challenge grant, of which driverless vehicles is a significant aspect. We anticipate our Phase 3 outreach will attract a robust conversation about this technology.

    As of now, our consultant team does not believe the impact will be too great as driverless cars will offer the most benefits in less dense areas, due to traditionally longer trip times to work locations and more time spent in congestion.

    This is under the assumption that work trips take place to/from the major employment centers in Columbus, that is Downtown and Ohio State University, and suburban locations.

    Dense, urban areas, will benefit from driverless vehicles, but there will be a question of physical geometry and street capacity, particularly with the desire to narrow thoroughfares and implementation of complete streets policy in the region. Driverless vehicles will improve street capacity, which, I suspect at least, the public will claim the excess capacity for amenities such as more parking, bike lanes and expanded sidewalks. That is increasingly becoming the practice of the City of Columbus and its neighborhoods.

    These assumptions are not set in stone as of yet and will be further fleshed out.

    Q: How long did it take for COTA to get the data in place?
    A: [From COTA] Our demographic and traffic projections came from our MPO, the Mid-Ohio Regional Planning Commission (MORPC). MORPC was updating their long-range Metropolitan Transportation Plan (MTP) at the same time we were launching NextGen, which required employment, population and travel demand data be projected out to 2040. Being an MPO partner, MORPC adjusted their projections for us to include 2025 and 2050.

    Another initiative that MORPC was leading along with ULI, was insight2050, which looked at various growth scenarios for the entire central Ohio region through 2050. MORPC also prepared data for this initiative.

    All in all, we were fortunate that MORPC was able to respond to our requests quite easily, providing us with data within weeks of asking, tied to TAZ’s and ¼ mi. grids.

    Q: How long did the public participation outreach take?
    A: [From COTA] The public meetings occurred over the course of three days (September 28-30). The survey was available for 35 days (September 28 – November 2).

    Thanks again for your interest and participation in this webinar.