I recently had the privilege of virtually connecting with Hugh Conroy, the Director of Planning for the Whatcom Council of Governments (WCOG). They’re a federal and state-designated regional planning organization located in Bellingham, Washington and a new MetroQuest subscriber!
The agency has had great community engagement success with us, and I wanted to touch base with Hugh to learn more about their transition to online engagement, their remarkable MetroQuest survey and the impressive comprehensive promotional strategy they created to help achieve high levels of online engagement.
Read on for an inside scoop on my conversation with Hugh…
Can you tell me about Whatcom COG and the types of projects you’re currently working on?
We’re a small US metropolitan planning organization (MPO) serving a population of about 225,000. As the federal recognized MPO and state designated regional transportation planning organization (RTPO), we’re responsible for managing the region’s long-range transportation plan and undertake a variety of other transportation planning and programming activities.
We’re currently updating the region’s long-range transportation plan. While the last two plan updates have included public input and review opportunities, a more dedicated regional assessment of the public’s transportation investment priorities hadn’t been conducted since 2001.
“As part of the continuous planning process, we saw the need to begin the 2022 update with a higher profile effort that would allow us to take stock of how our community’s goals for transportation investments may have changed over the last 20 years.”
We used MetroQuest to launch our 2021 Whatcom Transportation Survey for this project, which gives the public an opportunity to weigh in on our region’s long-range, 20-year transportation plan.
Can you tell me about Whatcom COG’S journey from traditional public engagement strategies to online tools and tactics?
I wouldn’t say it was so much a transition as an addition to what we’ve done in the past. As a metropolitan planning organization, we have ongoing public engagement activities related to publication of plans and actions of the regional Transportation Policy Board. With our main, 20-year plan update coming up next year, we wanted to take a bigger leap into broader public engagement and looked at online tools to do so.
“I think a combination of things made it really obvious that an online platform as our primary public engagement mode would be the way to go.”
We’d already done some of that on a smaller scale using tools like Google Forms and COVID-19 definitely limited what we would do in terms of face-to-face meetings and attending community events.
The option to leverage the relative ubiquitousness of internet-connected devices pointed to an engaging online platform like MetroQuest and proved to be a great fit with our goal of hearing and recording feedback from a much wider audience than we’ve connected with in the past.
Why did the organization decide to use MetroQuest for this project? What kind of impact has the transition had?
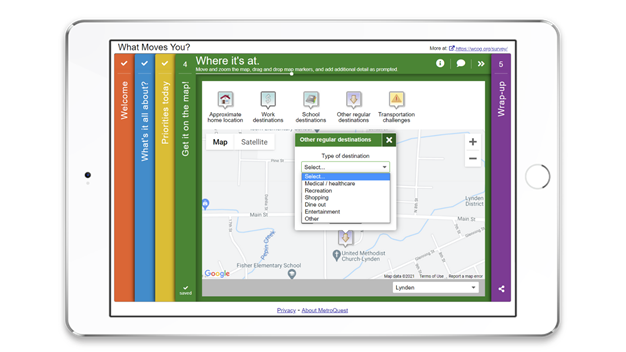
We looked at a variety of online platforms and surveys, but knew we wanted to have a mapping component. Not only is the extra richness of the resulting mapping information attractive for our team, but I think respondents have more fun and feel find that giving input about specific geographic locations is a lot more satisfying.
The survey is still open to the public, and we’ve already engaged 1,845 participants online! This is a drastic difference between the amount of public input we collected back in 2001.
“The 2001 Whatcom Regional Transportation Summit convened roughly 120 community members, compared to our MetroQuest survey that has reached nearly 1,900 participants and still growing.”
“At the end of the survey, participants are given the option to share their email address so that we might ask them a couple of follow-up questions and notify them when the survey summary report becomes available. So far, over 600 individuals have shared an email address which, if managed carefully, could be an important resource for some ongoing public engagement.”
WCOG developed a comprehensive promotional strategy to help increase its public engagement numbers. Can you walk us through some of the promotional tactics you used?
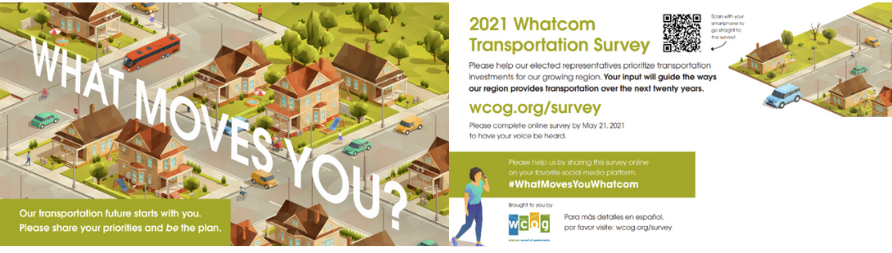
After completing a regional household travel survey four years ago, we were familiar with the effectiveness of old-fashioned mail. We worked with a graphics professional to design a postcard and worked with a mailing service to help ensure the postcard, which was randomly mailed to 40 percent of all households, was equally distributed within the region’s local jurisdictions.
Whatcom COG What Moves You Postcard
“We generated distinct URLs to track where people were coming from and, so far, the bulk of our responses have been generated from our postcard initiative.”
We also leveraged the in-house marketing expertise of our transportation demand management program, known as Whatcom Smart Trips, to assemble a press kit for print and radio media and partner agencies to announce the survey effort through the publications and websites they manage. We used our project website and social media accounts to advertise the survey. We’re also currently working on a second press release to help drive more engagement towards the end of the survey period.
Any tips for agencies and firms looking to reach their target demographics?
On the mail carrier routes in census areas at or below the metrics we use to track low-income or ethnic minority households, we mailed a postcard to 100% of the households in those areas to help us reach a more diverse audience and hear from traditionally underrepresented groups in our community. If you’re using mail and don’t have funds to mail to every single home, I recommend a mix of randomized selection approach and targeted saturation to increase the potential for hearing from traditionally underrepresented community members.
Congratulations to Hugh and the entire team at WCOG! We’re so impressed by your community engagement efforts and look forward to seeing the survey’s final results in the coming weeks.
You may have heard the team at MetroQuest boasting about the San Francisco Municipal Transportation Agency’s (SFMTA) public engagement success before; we can’t stop talking about their remarkable outreach efforts and outstanding engagement results!
I recently had the pleasure of speaking with Adrienne Heim, the Public Information Officer for the agency’s Communications and Marketing Division. During our discussion, we talked about some of the strategies her team used to engage the collective voices of their community and gather input from over 8,000 citizens online for their Central Subway Extension Alternatives Study!
Today, I am excited to give you an inside scoop and reveal some of the strategies the agency used to achieve this remarkable level of online engagement. Read on as I uncover some of the insights Adrienne shared with me during our discussion.
Can you provide me with a quick overview of SFMTA?
The SFMTA is a municipal transportation agency that is responsible for the management of all ground transportation in San Francisco and has oversight over public transit (Muni), as well as bicycling, paratransit, parking, traffic, walking and taxis. We serve San Francisco by creating transportation options that are constant, practical and everywhere; we connect people with their community to enhance the economy, environment and quality of life.
I work specifically in the Communications and Marketing Division, which is responsible for both internal and external communications that engage and share information with customers, stakeholders, and the public. We oversee things like media and public relations, marketing and special events. We also have a distinct public outreach and engagement team that oversees stakeholder engagement and community outreach activities.
What community engagement challenges was the agency facing prior to switching your public outreach efforts online?
About 5 years ago, we used mostly text-based surveys and online platforms like SurveyGizmo to facilitate our community outreach. Our online platforms were fairly static and really content heavy. We knew we needed a solution that would help participants really get into that decision-making space and provide our team with more direct input so we could make decisions that really reflect what the community needs.
Our Division’s public outreach and engagement team has to develop a detailed communications plan which includes the tactics they intend to use to solicit community input.
“When developing the plan for our Subway Extension Alternatives Study, we discovered MetroQuest and knew we wanted to use it specifically for this project.”
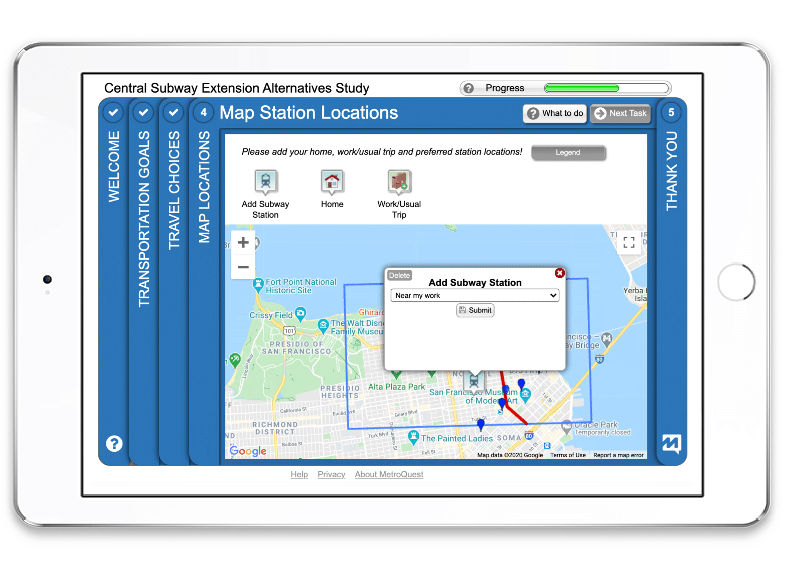
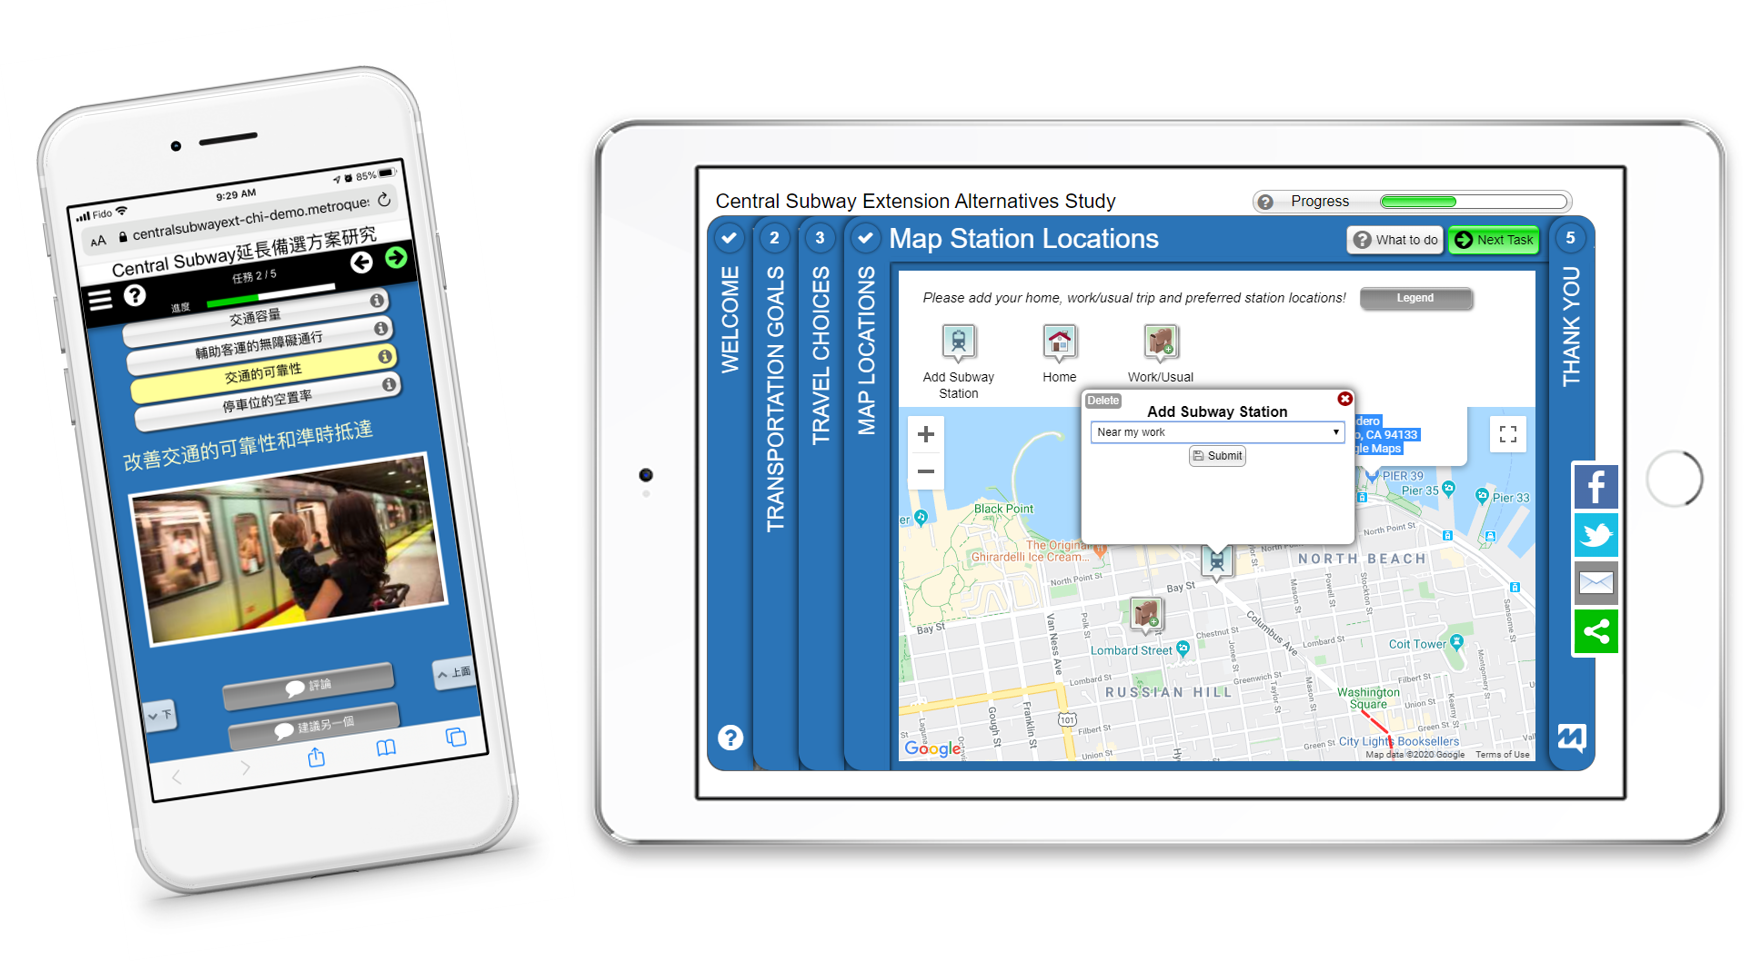
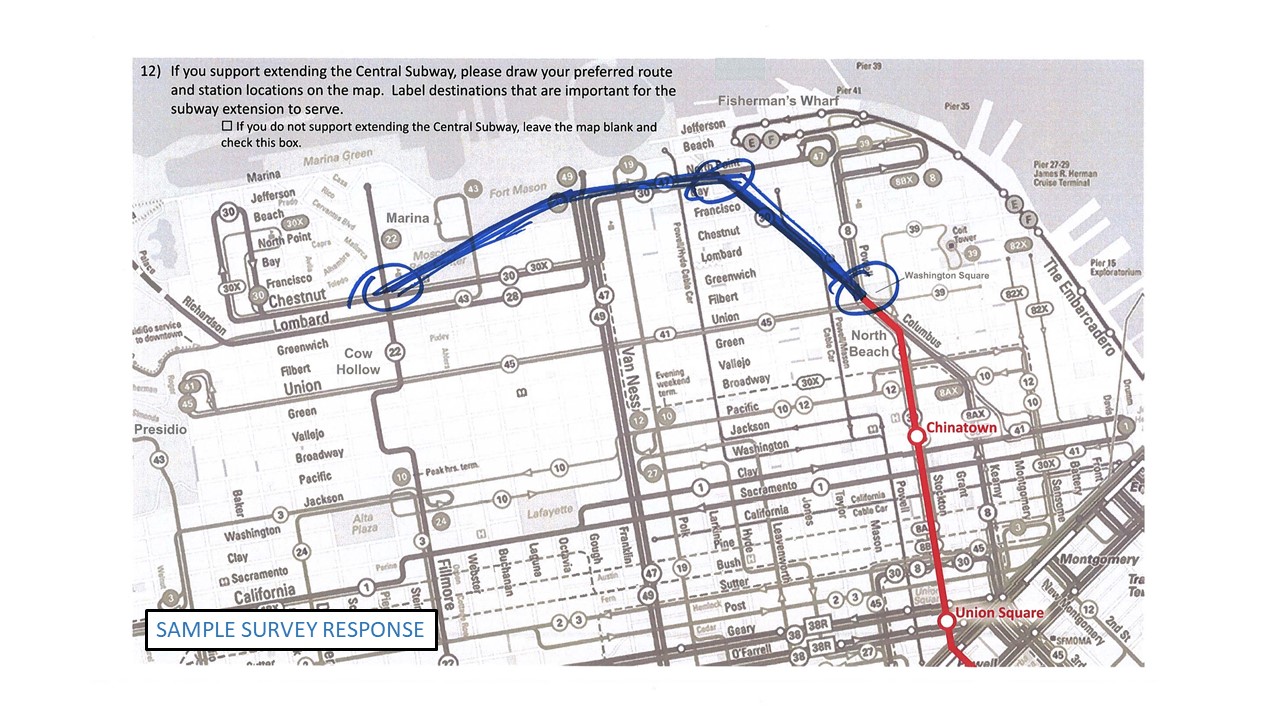
MetroQuest’s map marker screen is something that really stood out to us because it enables participants to pinpoint exactly where they want a subway station as well as their final destination and spots they stop at along the way.
“We knew this mature and engaging platform would help us get feedback from more folks and give our team clear insight into what the community envisions for our subway system moving forward.”
You used MetroQuest for the Central Subway Study to achieve great success, engaging over 8,000 participants. Can you tell us about some of the tactics your team used to achieve such incredible results?
We leveraged social media to help drive traffic to the survey and increase our online participation. We also sent out email blasts with a direct link to the survey and made use of both internal and external blog posts. Leveraging the City’s online portal, we also made project announcements in newspapers and connected with the Board of Supervisors who added the survey link into their newsletters.
We also targeted Muni customers who utilize the bus routes that travel through the Central Subway Extension study area through social media posts to encourage them to participate. This helped us gather input from those that use the City’s transit lines most.
“These tactics helped us reach the individuals who don’t usually attend workshops or monthly neighborhood meetings. While having a physical presence is important, our social media efforts really helped us increase our engagement”
What are some of your top tips for agencies and firms looking to reach their target demographics?
Given the restrictions on public gatherings due to COVID-19, many government entities have had to lean towards more virtual spaces. As a result, I recommend finding out what’s working in your community and especially in specific neighborhoods since many residents’ respondent to certain types of virtual (e.g., Facebook, Instagram, Snapchat, or Zoom) or traditional (e.g., newspaper or radio) spaces. I know that a lot of community groups are hosting online meetings right now. Leveraging signage is another great way to target specific demographics. Installing a multilingual laminated sign about an upcoming project in a distinct neighborhood can help you reach a specific group, for example.
Also, talk to your council members or Board of Supervisors and neighborhood leaders and make them aware of your project efforts. They probably have an even greater network within the community so if they champion your project, you’ll likely reach groups you might not have been able to otherwise. However, I would be seriously remiss to not emphasis that online outreach can never replace in-person engagement. That especially includes our stakeholders with low household incomes and who lack smartphones and/or internet access.
Is there any additional piece of advice you would give to other agencies that are transitioning their public engagement online?
2020 has been such a collaborative moment. We’ve been reaching out to other departments within our city family to help us pinpoint what’s working, what’s not and where we think community engagement is headed. My advice is to talk and learn from others.
“So many people are open to having discussions right now, which can help you find ways to enhance your community outreach and ease your transition to engagement online.”
Congratulations to the entire team at SFMTA and thank you Adrienne for the insight! I hope this discussion inspires you and provides you and your team with some intel into how to facilitate great community engagement.
In case you haven’t seen our case study with Adrienne, I’ll include a link to the 3-minute clip here. Adrienne and her colleague, Tracey Lin, also joined us in a webinar to celebrate some of the brilliant work by women in transit planning! I invite you to watch the on-demand recording. The webinar is packed with strategies to engage thousands online, tips for delivering comprehensive planning proposals and techniques for attaining valuable insights from a broad audience.
Celebrating Brilliant Public Engagement by Woman in Transit Planning
In this webinar, Adrienne Heim and Tracey Lin from SFMTA show us exactly how they exceeded agency expectations by engaging 8,100 residents, collecting meaningful public input to build a data-driven transit extension study!
When gathering input from the public, finding ways to educate them along the way is a crucial aspect that should always be considered. Asking for input from the public on planning projects helps agencies understand their constituents’ priorities – or barriers! In addition, information on current or expected use are critical elements in guiding policies and helping to prioritize funding opportunities in transportation. In order to gather representative data, it’s important that the respondents have a good grasp of the context and situation.
The topic of public transit, which provides an efficient, equitable and more environmentally friendly alternative to driving, is a vivid example of transit planning where informed input is crucial. There are competing goals within priorities around transit planning; and as funds are limited, tradeoffs need to be made in any transit network. Due to the complexity of the implications of the choices, it is important to present tradeoffs to the public and ask for input before creating a public transit plan or update.
Among many other examples, we want to highlight two agencies that have successfully used MetroQuest surveys to convey necessary tradeoffs for community outreach for transit planning: The Oklahoma Department of Transportation (ODOT) and Indianapolis Metropolitan Planning Organization (MPO). Read on to learn more about their success or jump to one of the sections below!
Oklahoma Mobility: Pairing Tradeoff Education with Community Priorities
The ODOT, in coordination with the Oklahoma Transit Association (OTA), created the first ever Oklahoma Public Transit Policy Plan called Oklahoma Mobility. Using MetroQuest, they asked the community to provide input on transportation challenges throughout the state.
To start, participants were presented with a list of priorities, and asked to rank the top five. These priorities included “Access to Jobs”, “Rural Area Transit Access”, “Access to Shopping/Retail”, “Urban Area Transit Access”, “Technology Enhancements”, “Access to Medical Service”, “Access to Entertainment” and “Access to Education”.
By initially gathering the priorities of each individual participant, the ODOT team was able to get a better sense of the leading priorities in the community which would help inform their reporting on the next part of the survey: educating participants on tradeoffs.
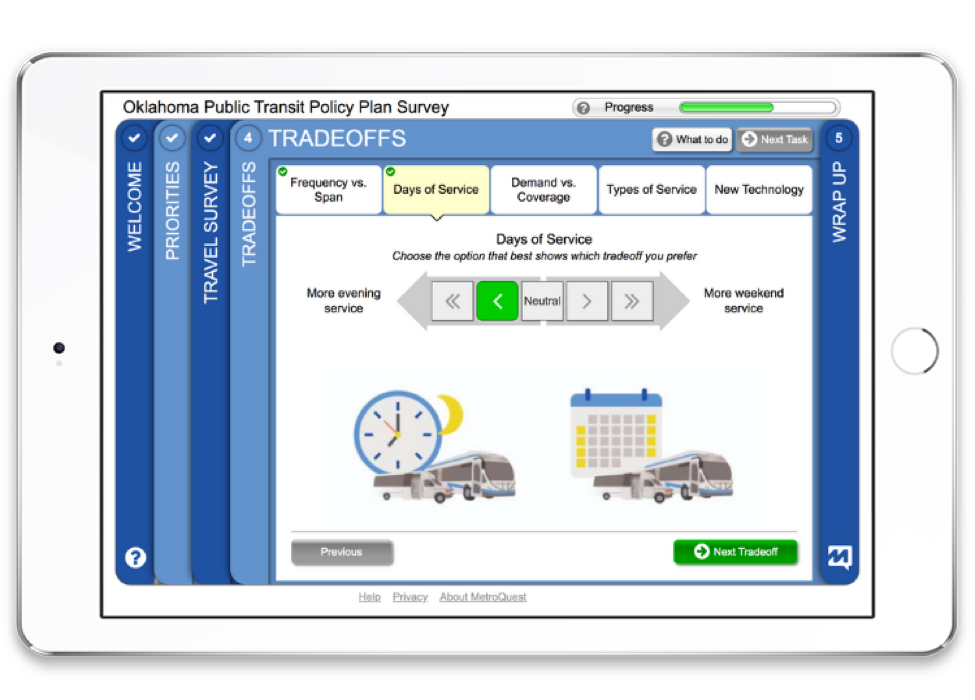
In the survey, participants were asked to weigh in on tradeoffs such as frequency vs. span (more frequent service or extended hours), days of service (evening vs. weekend service), demand vs. coverage (increase service where demand is highest or Increase service to unserved areas with lower demand), as well as types of service (more local or more regional travel). Using a combination of images and text to describe the different scenarios helped participants visualize and understand the pros and cons of each option. Plus, the initial screen that asked participants to rank their priorities reminds survey participants to focus on the aspects of the transit network that were ranked most important to them.
Presenting tradeoffs to participants shows that developing an effective transit system requires difficult decision-making. Instead of making participants decide on scenarios without context, the presentation of tradeoffs helps them understand that certain options will mean less resources to put towards the other! With this, ODOT successfully created a survey that is as much an educational exercise as it is a data collection tool.
Indianapolis MPO: Showcasing Tradeoffs Across Local Transit Networks
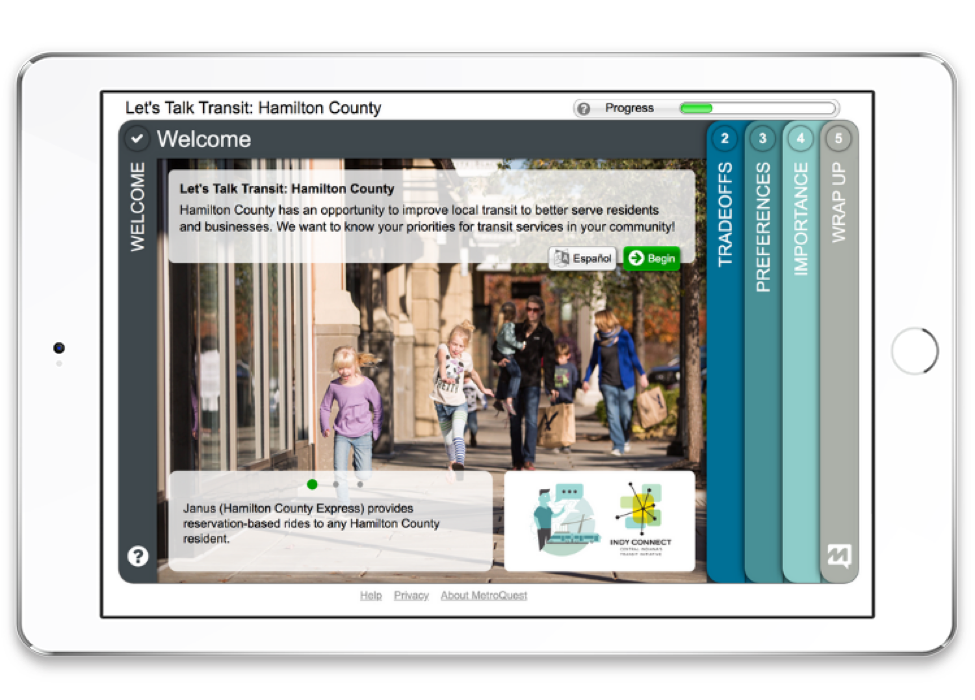
Indianapolis MPO created two great examples of online surveys with embedded tradeoff education. “Let’s Talk Transit” were projects launched in two counties, Hamilton and Johnson. The surveys were customized for each county, and emphasized choices around tradeoffs. With a total of 1,500 respondents between the two surveys, Jen Higginbotham, the principal planner at the Indianapolis MPO, was happy with the results and eager to share her success story in a webinar with MetroQuest! Based on a survey they’ve previously created, each of the two surveys was customized to the county.
Let’s Talk Transit: Two MetroQuest Surveys for Two Counties
Indianapolis MPO’s “Let’s Talk Transit” surveys are worth reviewing in a bit more detail. The two are very similar in content and intention, where participants were asked to provide their input on ways to improve transit to better serve residents and businesses.
Choices and tradeoffs were presented in different ways. In the first exercise, participants were asked how competing transit goals should be balanced with the tradeoff between ridership and coverage, as well as complex versus connected networks. Each of these scenarios could be rated on a scale from 1-5. Topics ranging from travel time, to number of transfers, wait time at bus stop, pollution generated and walk distance to bus stops were presented to show how they performed in each of the scenarios so that survey participants could make an informed decision based on what is important to them.
In a second exercise, participants provided input on preferences and tradeoffs such as ridership vs. coverage, fixed routes vs. reservation-based, whether buses should have their own lane (which comes at a higher price tag), whether to choose express routes or more local stops and having workday or all-day service. The goal was to gather community input on the preferred setup of the local transit network, but also to convey an important factor in any kind of transit planning: “getting more of one type of service often means getting less of another”.
Almost 1,000 people participated in the Hamilton County survey and about half of that in the Johnson County one. Most participants used transit in their commute or as a tourist and over 70% had two cars or more.
In the Johnson County survey, a 24-hour transit system was favored whereas in the Hamilton County survey, there was a division on whether to run buses all day or only during daytime work shifts. There was also a division on whether to serve trips within communities or from one to another. Apart from those, “preferences were fairly universal”, as Jen Higginbotham states in the webinar. Despite the proximity of the two Indianapolis counties, there were big differences in preferred service for the local transit network! Discovering the local preferences can make a big difference for the next step of the transit plan.
Congratulations to both Indianapolis MPO and Oklahoma DOT for developing delightful surveys that tackle the difficult tradeoff decisions that arise in transit planning!
To learn more about her recipe for success and for tips on how to collect actionable public input in transit planning, watch the webinar here.
Indianapolis MPO’s Formula for Actionable Public Input on Bike, Ped & Transit
In this webinar, Jen Higginbotham at Indianapolis MPO shares her step-by-step formula for engaging the public in alternative transportation planning using both online engagement and traditional involvement methods!
From the very beginning, we at MetroQuest have made it our mission to deliver great online public engagement experiences that broaden outreach to meaningfully include the public in planning more livable places and moving more people. We always love to see great online surveys used to engage the public in transit planning!
After all, it’s perfectly logical to collect community input since transit is a public transportation system, by definition, designed to move the public. Indeed, community engagement is a critical aspect of the transit planning process, and we have some a few tips and success stories to inspire you.
Tip #1: Increase public participation by engaging the public online.
Transit agencies are particularly brilliant at increasing public participation by extending their outreach programs online. They have a captive audience! While transit goers are not likely to get on the bus or subway to attend a public meeting, they will certainly give agencies five minutes of their time to take a survey from their mobile phone. Online surveys make it easy to engage the public where they are – on their devices, while riding on transit or from the comfort of their homes. We’ve seen transit agencies, from coast to coast, successfully engage thousands online, again and again.
Tip #2: Collect public input early in the transit planning process.
It’s important to engage the public early in the planning process, providing people with information and giving them the opportunity to offer feedback. In order to get buy in and gauge interest in a specific public transportation option, for example, it’s crucial that the community learns of its benefits, drawbacks, or tradeoffs before any major planning occurs. This allows planners and decision makers to understand the public’s needs, priorities, and interests to build alternative transportation scenarios.
Tip #3: Use new ways to reach traditionally underrepresented groups.
Transit agencies from LA Metro to New York’s MTA are successfully increasing equity and dramatically broadening outreach with online surveys and promotions. Using Facebook and other social media as a promotional channel helps agencies reach groups that aren’t likely to attend a public meeting.
By engaging traditionally underrepresented groups – including all ages, ethnicities, and incomes – online surveys allow transit agencies to better understand public priorities and design transit to truly meet the needs of people who need it most.
Broad public input is uncovering public preference for sustainable transportation options, including light rail.
Perhaps what’s most interesting about public engagement is the results themselves – increased public support for transit and hundreds of thousands of data points to build data-driven transit plans. What public input tells agencies in turn helps planners and decision makers focus on the options that receive the most public support.
Light rail, one of these options, is fast becoming a popular public transportation favorite and the benefits are wide ranging. According to the Federal Transit Administration, transit in general plays a vital role in contributing positively to sustainability efforts. Rail, more specifically, has a number of environmental benefits, including:
Improved air quality, since most rail transit emits little or no pollution;
Reduced greenhouse gas (GHG) emissions; in fact, light rail produces 62% less GHG than an average single occupancy vehicle;
Overall energy savings due to a lower use of fuel;
A decreased need for infrastructure for and manufacturing of vehicles;
Reduced congestion, which makes life easier for travelers and positively contributes to improved air quality, reduced GHG emissions, energy savings, and fuel savings;
More compact development, which leads to land conservation as well as decreased travel demand;
Economic development; and,
Greater access to affordable mobility.
Sustainability is a hot topic for most communities. But if planners don’t ask, it’s difficult to uncover definitively what the public wants.
Let’s look at a case study from the East Coast. Hillsborough MPO in Florida recently used a MetroQuest survey (you can try the demo here) to engage 9,575 residents, who provided nearly 236,000 data points of public input. This data was instrumental in uncovering new insights into local transportation needs and preferences. In an 4-minute interview, the agency’s Executive Director, Beth Alden, shared her delight in uncovering broad public support for light rail:
“There was so much interest in passenger rail as an option in this survey. I was kind of surprised. And, what that means is we get to keep that kind of technology on the table as we move into our Long Range Transportation Plan.”
By broadly engaging the public and gathering such amazing amounts of data, Hillsborough MPO discovered that their local community hugely supports light right as a public transit option. This information is allowing them to confidently create transit plans that reflect public opinion.
In San Francisco, SFMTA increased public participation involving 8,100+ in support of its Central Subway Extension Alternatives Study.
On the West Coast, San Francisco has already capitalized on the benefits of light rail with its extensive Muni Metro network, the third busiest light rail system in the United States. Faced with projected growth of nearly 1,000,000 residents by 2049, the need to expand their public transit system is becoming ever more critical.
Recently, the San Francisco Municipal Transportation Agency (SFMTA) used MetroQuest as their digital community engagement survey to inform the public of a possible extension to the Central Subway route. The team needed to gauge the public’s priorities and support for the project. Their survey was part of the preliminary analysis of their forthcoming Central Subway Extension Alternatives Study.
The goal of SFMTA’s project team was to increase public participation beyond the initial on-the-ground community outreach. In a recent interview, Adrienne Heim, Public Information Officer at SFMTA, described the efforts, “Last year we went out to merchant and neighborhood groups to discuss the study, ask people how they got around the city of San Francisco, their transportation goals, and how the study could incorporate or support some of those goals. That included gathering ideas for routes and station locations.”
On the ground efforts resulted in the completion of 129 paper surveys. Adrienne next described how going online increased public participation by over 62,000%,
“The survey results were amazing and well beyond our expectations. Within three days of deploying MetroQuest, we received 1,000 responses, and towards the end of the survey, we received 8,137!”
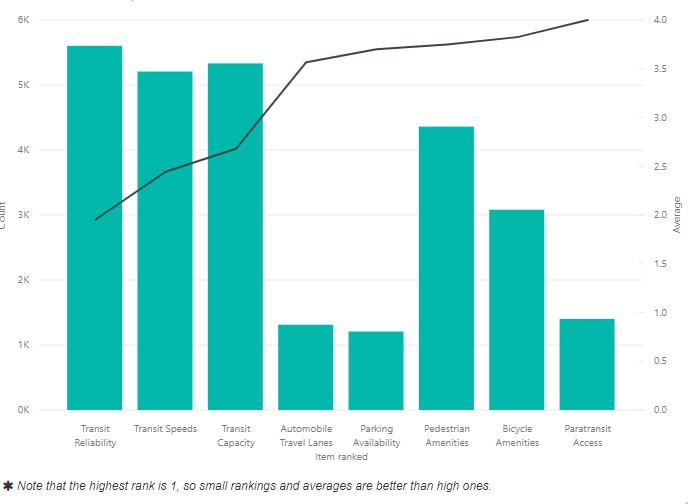
The survey cleverly asked about transportation goals to get a picture of what the public valued. Respondents who supported travel reliability and capacity building to reduce crowding supported the extension. Fewer prioritized such investments as preserving on-street parking or car travel lanes – these respondent preferred more infrastructure for cars and personal vehicles. Additional goals included accessibility and active transportation, namely bicycle and pedestrian amenities. SFMTA was pleased to share the results with the public, with overwhelming support for transit:
The survey continued to ask about travel choices, such as current travel modes, as well as questions about the extension itself and potential routes. It then provided a map for supporters to concretely identify their origins and destinations, as well as preferred new station locations before wrapping up with demographic questions and additional information about the project.
“Having the ability to disperse our survey quickly and easily online was greatly beneficial to us,” explained Tracey Lin, Deputy Project Manager. “Our survey was also built for mobile engagement thanks to MetroQuest, and it was easily accessible to stakeholders from all over the city who are interested in our project.”
All in all, SFTMA collected 148,405 insightful data points to inform their transit plan, and 13,737 public comments to give context to specific feedback.
“The way that we could structure questions through MetroQuest allowed greater feedback and input, enabling a more robust planning analysis,” concluded Adrienne. “Those 8,137 survey responses allowed us to confirm that most respondents want a subway that goes beyond the Northern Terminus and a little bit towards the West.”
The Central Subway will be a long-term investment in a transportation system that will meet the needs of growing populations in a sustainable way. It is estimated that the Central Subway will serve 35,000 customers daily when it opens!
While a concept feasibility study from 2015 showed that an extension is technically possible, it didn’t show what the public preferred, which is why a four-step alternatives study is currently underway to understand the desirability of the extension, as well as to determine goals, possible routes, and station locations that will best serve the community. We’re thrilled MetroQuest could help.
If you’re looking for the best way to celebrate International Women’s Day 2020, you can also dive deeper into this success story with the webinar: Celebrating Brilliant Public Engagement by Women in Transit Planning with SFMTA. Thank you Adrienne and Tracey for celebrating #IWD2020 with us this year and congratulations on your outstanding achievements!
For government agencies, “online public engagement” encompasses a particularly wide array of tools and services – from chat bots on websites to digital town halls.
The American Association of State Highway and Transportation Officials, for instance, tell us in a recent report that “the practice of using social media is not only routine, it is considered in many ways a key factor in public engagement.”
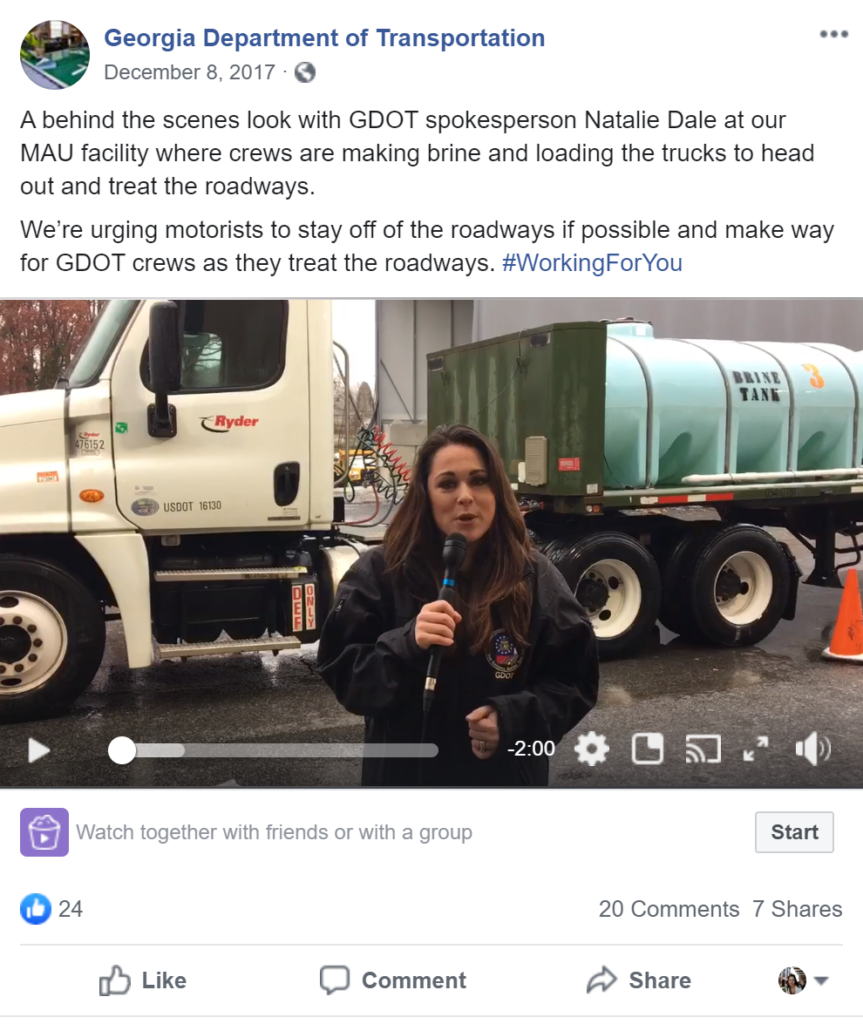
Indeed, state and local governments use social media to alert the public of major events, like transportation disruptions. It’s also used for casual storytelling with photos and videos. The Georgia Department of Transportation (GDOT), for example, uses Facebook to bring the public “Behind the Scenes,” featuring employees engaged in interesting activities like treating roads with brine to keep motorists safe.
With so many online tools and options for public engagement – from social media to community forums, each used by various departments of government – it can become challenging for our friends in the planning department to get access to the right solution. Why? They have unique requirements not always well understood by decision makers and influencers in other departments. Let’s help provide clarification.
Planners have unique public engagement objectives. They need to collect informed community input on complex topics to support their urban and transportation plans.
Urban and transportation planning projects tend to be critical make-or-break points in an agency’s relationship with the public. These projects directly affect quality of life and represent major public investments. Ineffective public engagement can have grave implications – scrutiny from decision makers, important plans not getting approved, public backlash, bad press, ousting of elected officials, and delays in critical infrastructure – all detrimental to the wellbeing of our communities. The importance of public engagement for planning is clear.
So, what makes for effective public engagement? Since 1997, we at MetroQuest have dedicated our life’s work to answering this question. Collaborating with all the industry associations and thousands of AICP certified professionals, we’ve learned that planners need public engagement to deliver unique outcomes so they can stand confidently before councils and demonstrate support for plans, backed by credible data that proves that their plan represents true public priorities and preferences.
1. Planners need high levels of public participation.
Our planning friends require very high levels of public participation across a broad demographic, not just from the same small group of beneficiaries or naysayers. Ideally, thousands of people across a broad demographic provide input. To move forward with oftentimes bold recommendations, planners need to make the case to decision makers that the broader public is behind their plan.
2. Public input must be informed by weaving in education.
Planners need to educate the public about complex issues before providing input – yet residents won’t read long PDF project documents full of planning jargon. Education must be woven into the online engagement experience as microlearning, ideally with visualizations and interactivity, so the public can quickly learn about project nuances and tradeoffs, improving the quality of their input.
3. The experience must be private for input that’s free of bias.
To uncover true public priorities, planners require input from residents that is not influenced by the stronger, louder voices in the community. This means that the online engagement experience needs to offer privacy to support input that is free from bias, bullying, and intimidation. This is particularly critical to broaden the reach to traditionally underrepresented groups.
4. A wealth of quantifiable input is needed for data-driven planning.
To be actionable, public input must be specific and primarily quantitative. Obtaining a wealth of largely quantifiable data points (50,000+) drives better decisions in planning, more so than qualitative input (via comments). Planners make risky and expensive planning decisions with long term impact. Clear, quantifiable input gives them confidence to build bold plans.
5. Input from the public must be defensible to get plans approved.
Collecting bias-free informed input from thousands of participants in the form of quantifiable data is what planners require to defend their plans. Indeed, getting multi-million-dollar plans approved by committees and elected officials takes data-driving planning backed by broad community support.
With declining participation at public meetings, planners have turned to online engagement to meet these unique objectives. Online tools offer the most cost-effective and resource-efficient way to broaden public participation. But, with so many digital options already available within their agency, do our friends really need another tool?
Can’t an online forum do the trick? How about a SurveyMonkey?
For answers to these questions, let’s explore how various online tools stack up against the unique requirements of our friends in the planning department.
Social media is a terrific communication tool, but it was never designed for public input in planning.
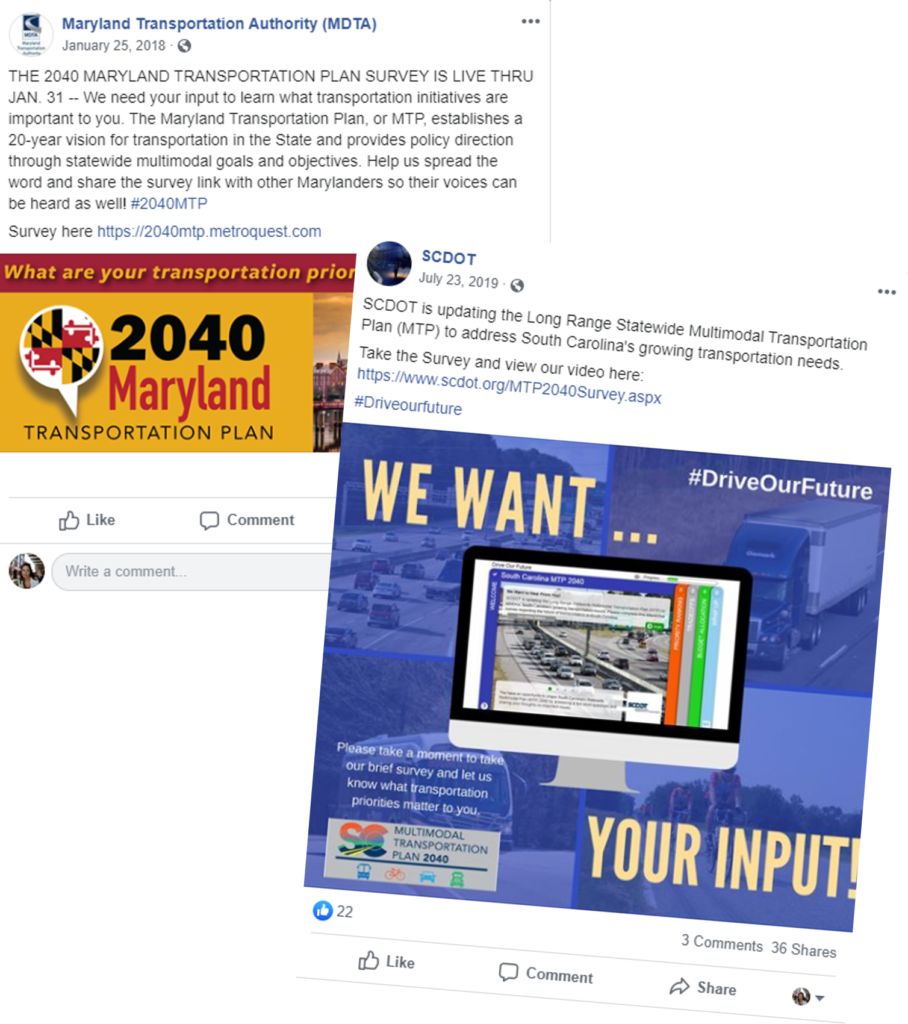
Social media is used by just about every government agency as an effective communication tool for announcements, soundbites, and casual storytelling, as we saw with GDOT. Social media – from free to boosted posts, from Facebook to Twitter – also offers one of the most cost-effective ways to broaden reach to promote other public input options like public meetings and online surveys. For example, South Carolina DOT recently used Facebook boosted posts to get over 13,000 residents to take their MetroQuest survey … for less than the cost of a single public meeting!
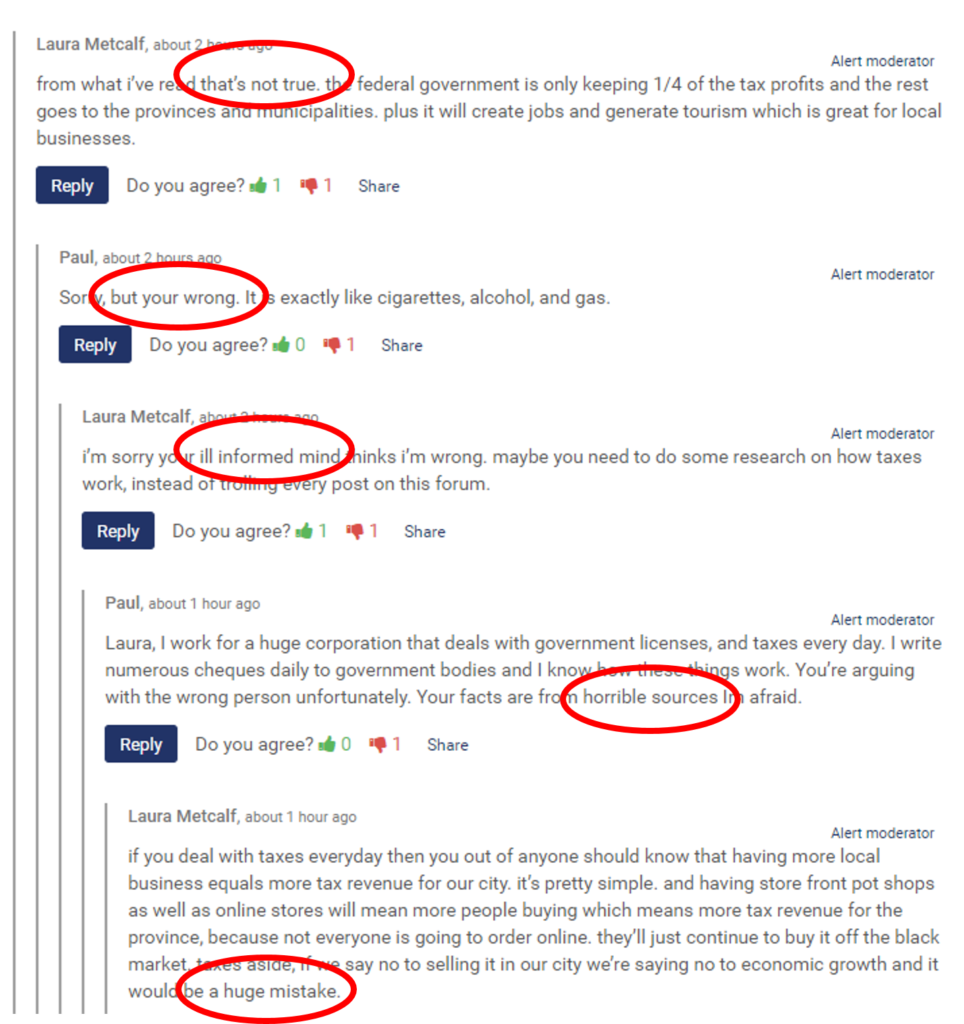
That said, social media alone is ineffective at collecting quantifiable public input to inform plans. Likes and retweets cannot support complex planning decisions. Social media posts by residents are difficult to analyze and can steer towards contentious topics outside the scope of planning projects. And let’s not forget that posts and comments are public, permanent, and polarizing. While definitely part of the planner’s toolbox for promoting public engagement opportunities, social media in and of itself is not used for quantifiable public input by planners.
Forums require registration, while comments are public, subject to bias and intimidation, and difficult to quantify.
Online forums (and other ideation tools) can be useful early on in a planning project to identify public priorities from vocal members of the community. They can uncover concerns and ideas not previously considered. While indeed a useful tool in the planner’s toolbox, online forums miss the mark in many ways.
Requiring the public to “register to join” has proven to reduce participation by up to 95%! And not unlike public meetings and social media, the open nature of comments can bias public input and tend to polarize views. Participation is particularly intimidating for residents who are learning English as a second language. And with reams of qualitative comments, including banter and tribal arguments, it’s difficult for planners to summarize the results for decision making.
While open-ended comments can be helpful in characterizing public sentiments, planners need structured data, summarized visually, that can be digested in minutes by busy decision makers.
Text-based surveys are boring, yield low participation, and are hardly educational.
Online surveys can be a great way to defeat the shortcomings of online forums. After all, each survey respondent gets the same private online experience, free of bias and intimidation. The data collected using multiple-choice questions is quantitative and easy to graph. Indeed, SurveyMonkey can be a great tool to quickly collect public input!
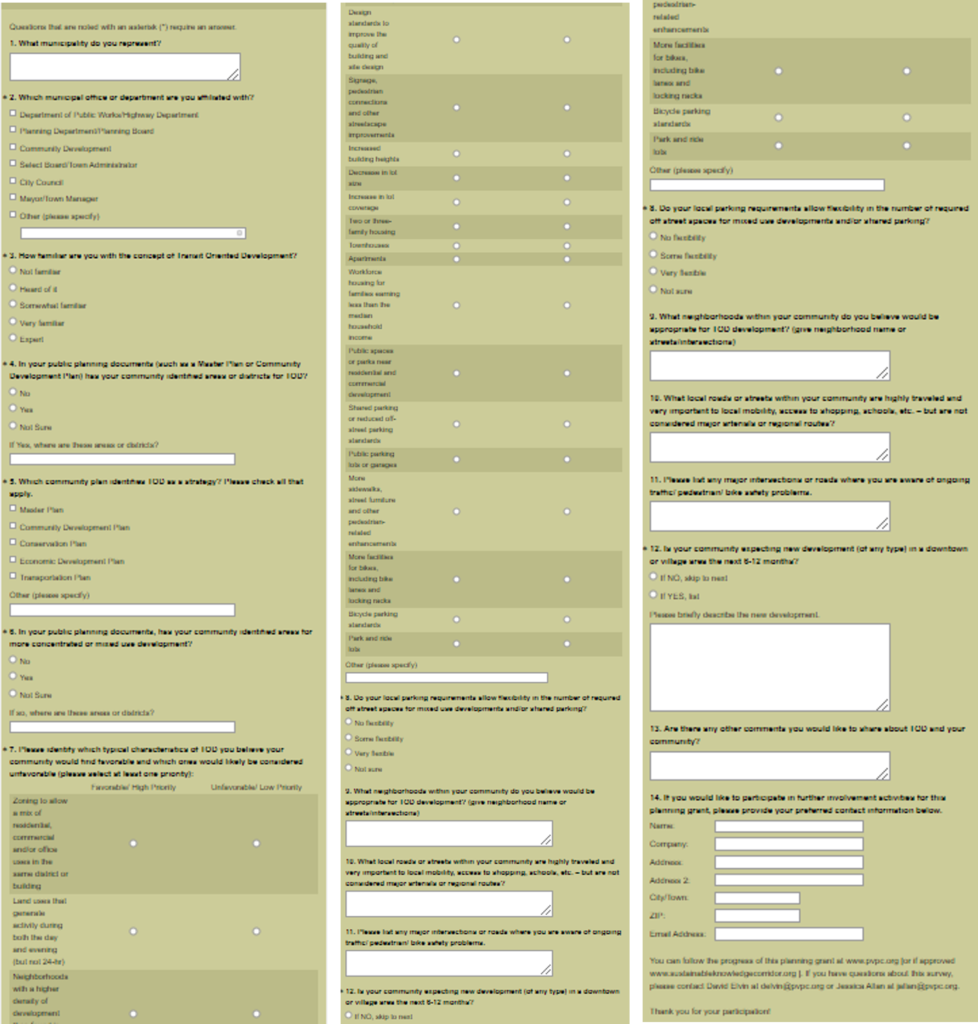
That is, until you need to engage the public on a complex planning project. When it comes to multifaceted initiatives – like comprehensive plans or transportation projects – simple survey data can fail when scrutinized by public officials. Text-based surveys don’t convey project nuances. People don’t read a PDF to learn about a project, then take a long survey that feels like homework. It’s no wonder that public response rates for text based surveys range from 10 to 15%, resulting in usually less than 100 participants. Would you take this survey?
For planning departments, success in public engagement typically means over a thousand participants from diverse demographics, each contributing 30 to 100 data points (priorities ranked, map markers dropped, images rated, etc.) – that means over 30,000 data points of unbiased public input to satisfy decision makers.
Over the past 20+ years, the team at MetroQuest has pioneered digital public engagement for planners – we’re intimately familiar with their unique objectives. So how can we help our friends to make the case that they need MetroQuest – the only specialized online engagement solution designed for planners? Let’s turn the spotlight on a 2020 success story.
GDOT collected nearly 50,000 data points to inform its 85 Corridor Study!
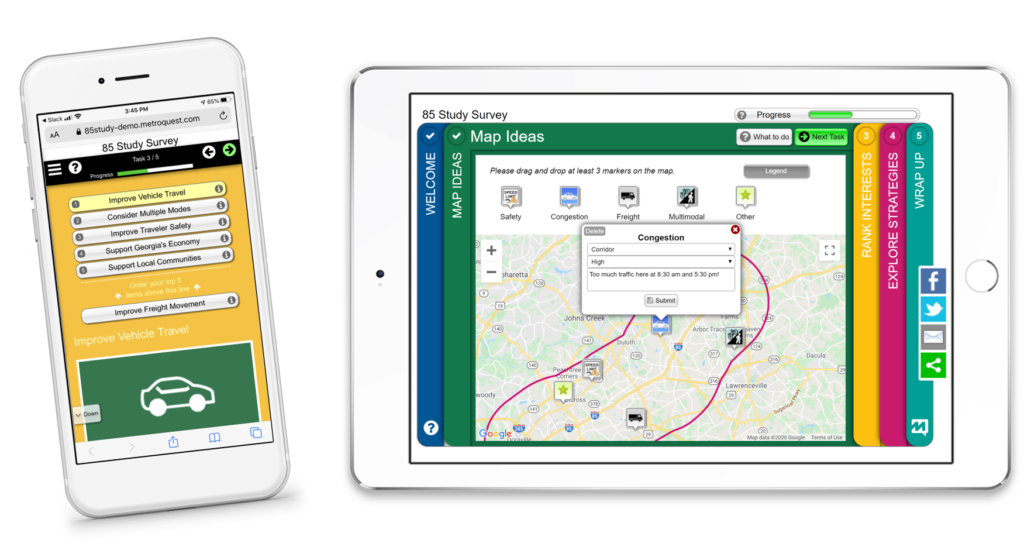
The Georgia Department of Transportation is conducting a comprehensive corridor study along I-85, between I-285 and I-985. The corridor is roughly 18 miles long, with 6 travel lanes, 16 interchanges, and serves approximately 300,000 vehicles daily. In the first phase of the study, the Office of Planning engaged the public to get input on how to reduce congestion, enhance traffic operations, and improve safety. Let’s look at a demo of their MetroQuest survey:
GDOT increased public participation to over 2,550 survey respondents!
For a corridor study, attendance at a typical public meeting might include 10 people, while a text-based online survey might reach 50 or 100. The planning team at GDOT successfully broadened reach, offering their MetroQuest survey in English, Spanish, Korean, and Vietnamese, to gain valuable public input from 2,550+ residents! Several unique MetroQuest features made such high public participation possible.
No Registration. MetroQuest doesn’t require registration and leaves demographic questions to the end. Planners don’t need participant names and contact information since personal responses are not expected. Eliminating upfront registration drives up participation rates from the standard 10-15% upwards to 50-80% with MetroQuest.
5-Minute Experience. Public participation drops drastically (by over 90%) when planners ask the public for more than 5 minutes of their time. GDOT launched a great MetroQuest survey that took just 5 minutes to complete. It was fast and easy for residents to provide input with a click, drag, and drop, minimizing lengthy typing.
Project-Specific Input Fast. Planners need time-bound feedback at specific stages of planning projects. GDOT engaged 2,500+ people in three months with their MetroQuest survey live from December 5, 2019 to March 2, 2020. All the public input stayed within project scope, with specific questions seeking public influence on key project outcomes.
Any Device. MetroQuest surveys are responsive and optimized for mobile. GDOT was able to engage Georgians across all their devices – from any smart phone, tablet, laptop, or computer connected to the internet – without the struggle of pinching and zooming. With MetroQuest, it’s common for 50 to 70 percent of respondents to participate from the convenience of their mobile devices, anytime, anywhere.
“Fun” Drives Social Sharing. Visually engaging surveys, packed with colorful images, are readily shared via social media, which dramatically broadens demographic reach. GDOT used MetroQuest’s social sharing buttons to encourage participants to share the survey.
Microlearning helped GDOT planners collect informed public input!
Completing an interesting, interactive survey that informs while collecting feedback is a rewarding experience. MetroQuest offers visualizations and interactive elements that feel more like games than surveys. Comments such as, “Great survey, wonderful project. So fun, I learned so much”, showed us that participants loved the experience. Georgians “learned while answering” with education weaved into the experience in microlearning moments, giving planners confidence that the input was informed.
Microlearning. In their MetroQuest survey, GDOT welcomed Georgians with a succinct overview of the 85 Study. Participants then ranked priorities with short descriptions. While rating strategies, they learned how to increase capacity and improve safety. People gained appreciation for the scope and scale of the project, while providing input.
Planning Templates. MetroQuest uses gamification to educate the public in minutes using survey templates designed for planning. Participants visualize the pros and cons of different scenarios, stack coins to allocate budgets, rate images (like ranking five kinds of bike lanes to realize nuances), gain appreciation for competing tradeoffs, drop markers on maps, and use dynamic slider bars to fund projects using taxes and fees.
Input from the public for the 85 Corridor Study was 100% free of bias!
The 2,550+ Georgians who took the MetroQuest survey each had an identical public engagement experience – a clean map for their ideas, identical priorities to rank, and the same strategies to rate. The 1000th participant used the same uninfluenced input mechanism as the 1st participant, unaware of prior community input.
Clean Map. Some tools allow residents to drop markers on public web maps – the problem is that input becomes biased by all the markers previously added by others. A cluttered map also makes it difficult for participants to see where to place their markers, particularly on smart phones. GDOT used MetroQuest to collect over 25,200 map marker attributes, free of bias, while making the experience quick and easy.
Private Experience. GDOT planners used MetroQuest for direct, one-way public input to uncover true community preferences, free of peer influence, social intimidation, and toxic banter. Each survey experience was identical and private.
Nearly 50,000 data points were collected to inform the 85 Study!
The Office of Planning now has nearly 50,000 data points to support data-driven improvements to the 18-mile stretch on the I-85. This quantifiable data includes 25,000 spatial map marker attributes and 24,000 strategy ratings – it will help in recommending projects that meet the true needs of local stakeholders who depend on the corridor.
Comments in Context. GDOT planners added comment boxes in their MetroQuest survey to add context for the quantitative questions they asked. They collected over 6,000 comments to bring color and commentary to supplement the data.
Charts & Graphs. Using the MetroQuest Data Center, GDOT planners are exploring charts and graphs to build their study reports. Colorful visualizations of all the quantitative public input will support their recommendations, impress the Board, and build confidence for project approvals.
We’d like to congratulate the team at GDOT for their outstanding online public engagement success! You’ve gained tremendous public support for your 85 Study. Thank you for subscribing to MetroQuest – our team looks forward to seeing many more surveys from GDOT this year.
We hope that GDOT’s success story will inspire other agencies to endow their planners with North America’s only online public engagement solution purpose-designed for planning. When more members of the public participate in planning we get more livable cities and we’re able to move more people. We all benefit!
Optimizing Online Engagement for Local Government with MetroQuest
Online tools are a critical part of the public engagement tool box. This webinar highlights how local governments are optimizing online engagement for the best results.