[SURVEY OF THE MONTH] Identifying Priorities for Climate Action and Resilience in Massachusetts
![[SURVEY OF THE MONTH] Identifying Priorities for Climate Action and Resilience in Massachusetts [SURVEY OF THE MONTH] Identifying Priorities for Climate Action and Resilience in Massachusetts](https://metroquest.com/wp-content/uploads/SURVEY-OF-THE-MONTH-Identifying-Priorities-for-Climate-Action-and-Resilience-in-Massachusetts-1.png)
We never cease to be inspired by the impressive work done by our customers. We will continue to put the spotlight on particularly great examples of MetroQuest surveys and hope you are inspired in turn!
For the first Survey of the Month of 2021, we are highlighting a fantastic firm and long-standing customer of MetroQuest: Kim Lundgren Associates (KLA). The team’s amazing work in the sustainability realm is remarkable, as discussed in this blog on climate change and sustainability. This particular example caught our attention for multiple reasons: the important topic of resilience in the face of climate change, the team’s straightforward approach using informative key documents, and of course, a delightful MetroQuest survey!
What’s the story? Climate Change Action and Resilience in Beverly and Salem
The City of Beverly and City of Salem in Massachusetts have partnered to take action to reduce greenhouse gas emissions and adapt to climate change impacts. The joint plan, called “Resilient Together,” aims to identify priorities for climate change preparedness and work towards exceeding Massachusetts’ goal of carbon neutrality by 2050.
The team at KLA put together three brilliant key documents on the project website:
- A plan overview identifying core issues and solutions. It discusses the climate impacts that the communities are already experiencing such as intense storms, sea level rise, drought, flooding, and heat waves, and goes on to discuss current behaviors contributing to carbon dioxide (CO2) emissions. The two-pager also discusses seven focus areas, namely building & development, natural resources, public health & safety, solid waste, mobility, energy, and infrastructure. The goals of the climate change action plan will align with six guiding principles, namely community resilience, economic vitality, greenhouse gas (GHG) emissions, restoration & transformation, health, and equity. Finally, it includes the plan’s timeline and ways to stay involved.
- A climate change fact sheet with more detailed context, including GHG emissions by sector and thorough coverage of the negative impacts of climate change experienced by the communities in question.
- A report on vulnerability preparedness of Beverly.
All three documents are created in infographic style, making them both informative and interesting. To explore the reports in more detail and to learn more, please visit the Resilient Together project website.
Anatomy of an MTP Survey: Identifying Climate Action Plan Priorities using MetroQuest Surveys
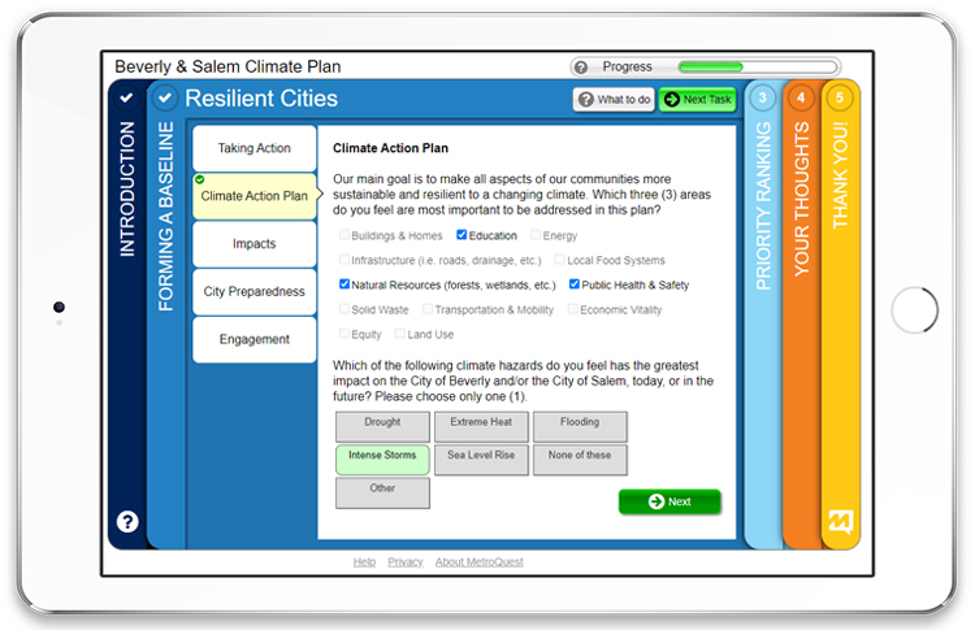
The survey starts with enough background information to inform the participant of the plan and the objective of the survey. Utilizing a Standard Survey Screen, it asks participants for their input on the categories of Taking Action, Climate Action Plan, Impacts, City Preparedness, and Engagement.
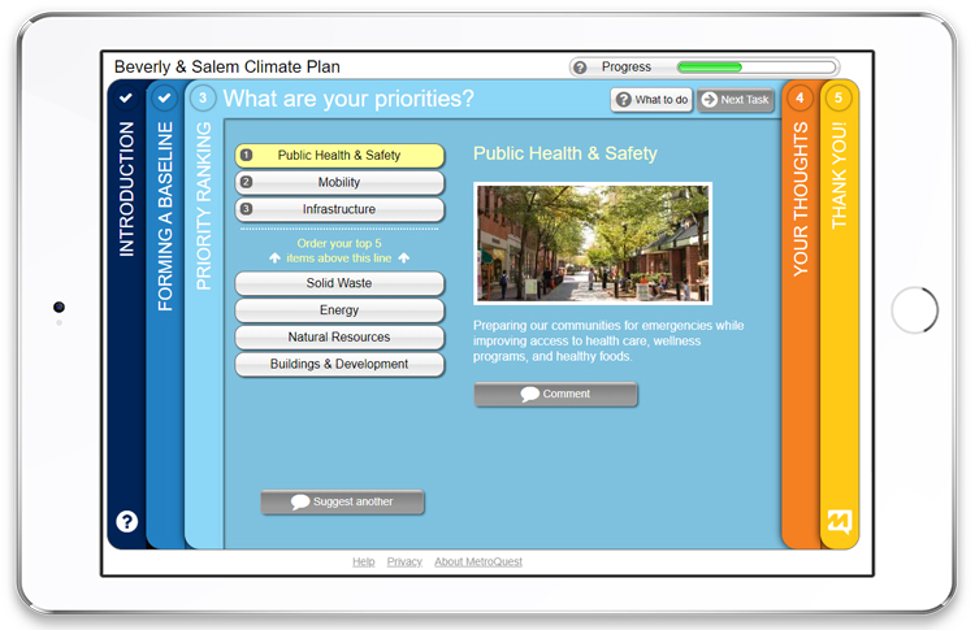
The survey continues with a Priority Ranking Screen to help the team understand participants’ baseline knowledge as well as learn their thoughts on seven areas of the community that the plan will focus on namely Public Health & Safety, Mobility, Buildings & Development, Infrastructure, Natural Resources, Solid Waste, and Energy. These priorities are always presented in random order to reduce bias: studies show that items which are listed first tend to be picked more.
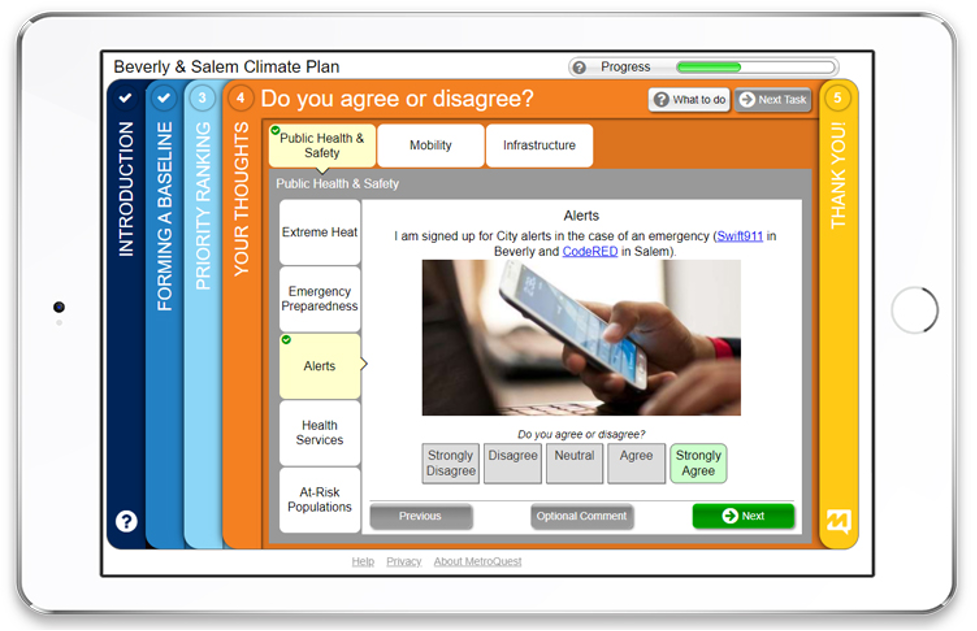
Finally, before wrapping up the survey with a few demographic questions, a thank you message and a prominently featured plan logo, the survey presents an Image Rating Screen which is linked to the Priority Ranking Screen. On it, participants are presented with the categories they have previously identified as important to them and, by means of representative images, are asked to indicate on a five-point scale whether they agree or disagree with statements. There are five subcategories in each, such as Trees, Parks, Open Space, Shoreline, and Invasive Species in the “Natural Resources” category.
If you would like to try the survey, click here. This is a demo version that will not affect the survey results. In order to reach non-English speaking communities, the survey was also offered in Spanish and Portuguese.
5 Tips from Resilient Together: Great Content Leads to Great Surveys!
The Resilient Together MetroQuest survey was a great success – over 1000 participants provided their input! In part, their success can be attributed to a delightful survey with fantastic content around the important topic of climate change preparedness. Below are 5 takeaways from the survey to inspire your next project:
- First impressions matter! This survey immediately catches one’s attention with a beautiful background image on the Welcome Screen, as well as an eye-catching logo and screen colors that match the well-designed logo. It’s inviting but not distracting!
- While we rarely recommend using the Standard Survey Screen, because it’s less visually appealing and interesting and lacks the benefits of other types of Screens, it is efficient in asking more traditional survey questions. KLA did a great job keeping it interesting by switching up the question types from drop downs and checkboxes to clickable buttons and text boxes. This helps prevent survey fatigue which in turn leads to more input and better results.
- I have mentioned this before, but it is worth highlighting again: taking advantage of the ability to connect the Priority Ranking Screen to a subsequent Screen, in this case the Image Rating Screen, is a fantastic way to give a survey a tailored feel and ensure the participant provides additional input on what they deem important. This too will lead to better input and greater success!
- The use of images is always a good idea. Instead of simply asking participants if they agree with statements, KLA achieved the same thing in a visual way with images for each statement. This makes the survey more visually appealing which – you guessed it – leads to more engagement and better results.
- Finally – and while this is not directly related to their survey, KLA provided abundant context for the climate change action plan – providing informative yet concise background information is of utter importance. It is easy to forget that not everyone has the knowledge the survey team has, and few people will read long articles for background information. The use of short 2-page documents and infographics is a fun and effective way to educate participants before they dive into answering questions. It is also great for follow-up afterwards. As project information typically needs to be available for longer than the survey will be live and collecting data, we always recommend including this information on the project website. This also ensures the actual survey experience takes only 5-10 minutes!
Congratulations to the KLA team for a truly fantastic MetroQuest survey. Climate change preparedness is a critically important topic—great work!
For more great tips on how to make the most out of MetroQuest, contact your Customer Experience manager or reach out for more information!
Want to learn more about how MetroQuest supports community outreach on your next transportation plan? Check out our recent webinar:
Public Involvement – How TxDOT Engages Beyond Meetings
Getting meaningful public engagement on transportation projects can be challenging. While the public are not planners, they care about local issues! Learn how TxDOT shares innovative approaches to reaching an increasingly preoccupied and diverse public.
![Beverly and Salam Climate Action Resilience Plan PDF [SURVEY OF THE MONTH] Identifying Priorities for Climate Action and Resilience in Massachusetts](https://metroquest.com/wp-content/uploads/Beverly-and-Salem-Climate-Action-Resilience-Plan-1.png)


Thanks for this Norma! We really appreciate being recognized! The team worked hard on this one and both us and the clients were pleased with the results!
It was my pleasure highlighting such a fantastic survey and project! Your team’s hard work most definitely showed and I’m glad to hear it paid off. We are looking forward to seeing what your team is up to next!