Category: [SUCCESS]

  • [SURVEY OF THE MONTH] Envisioning Sustainable Transportation for the San Joaquin Region

    [SURVEY OF THE MONTH] Envisioning Sustainable Transportation for the San Joaquin Region

    The Survey of the Month series is a monthly blog where we highlight the extraordinary work our customers are doing, along with some takeaways that are relevant for anyone interested in making the most out of online engagement using MetroQuest’s survey platform! To see more in the series, visit the blogs here.

    This month, we are featuring a survey with a unique approach to informing its participants: through the use of videos! Follow along as we introduce you to a survey developed by the San Joaquin Council of Governments (SJCOG) and the consulting team at Cascadia Partners.

    The Envision 2050 survey was launched through MetroQuest during summer 2021 to gather feedback on the 2022 Regional Transportation Plan (RTP) and Sustainable Communities Strategy (SCS) for San Joaquin County, California. This long-range vision and investment plan focuses on the region’s future transportation needs and sustainability targets.


    What’s the story? Planning for a Sustainable Transportation Future

    SJCOG oversees transportation, housing and habitat conservation for the San Joaquin region, which comprises several cities in California east of San Francisco, namely Stockton, Lodi, Manteca, Tracy, Ripon, Escalon, and Lathrop.

    Under the project name Envision 2050, SJCOG is updating their 2022 RTP and SCS, a process undertaken every four years to inform a 30-year land use and transportation plan. In addition to identifying future infrastructure and housing investments, this process has a particular focus on sustainability. The plan must also outline how the region can meet federal and state air quality standards and reduce greenhouse gas emissions.

    The project team used MetroQuest as an essential component of their public participation plan for this comprehensive initiative.

    The Envision 2050 survey sought input from the community on priorities for the region’s future, focusing on four different scenarios for how the region could grow:

    1. Stay the Course
    2. Remake Centers & Corridors
    3. 20-minute Neighborhoods
    4. Commuter Villages

    The survey, offered in English and Spanish, shared information on the different scenarios through short videos and gathered feedback on residents’ level of agreement to each overall scenario and a series of features for each scenario.

    The survey successfully gathered input from over 400* participants and provided valuable data to inform which scenario(s) and strategies would be recommended to the SJCOG Board for the 2022 RTP/SCS.

    Learn more about Envision 2050 and view the survey results on SJCOG’s project website.


    Anatomy of a Comprehensive Land Use Survey: Gathering Feedback on Future Scenarios

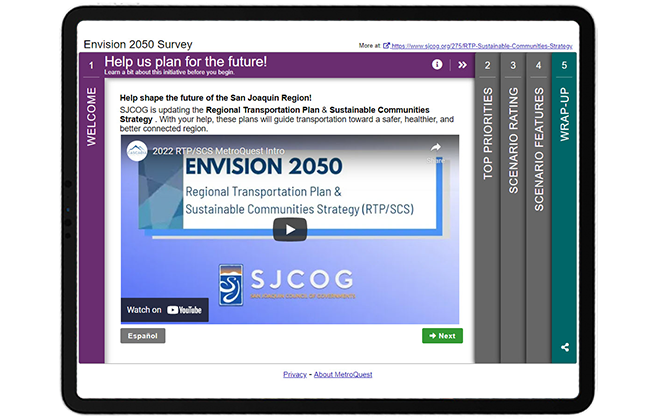
    Upon opening the survey, visitors are greeted with a video, embedded front and center on the screen. The video explains how input will be considered and introduces the initiative. This unique approach allows the survey to remain light on text while still providing important background information.

    This approach of starting with a video is particularly advantageous if your project requires a bit more extensive background information up front, and is generally a good practice to include in the Welcome Screen which delivers the first impression of the survey to visitors. Most people are more likely to click on a video rather than read a wall of text, increasing the likelihood of visitors continuing to Screen 2 of the survey!


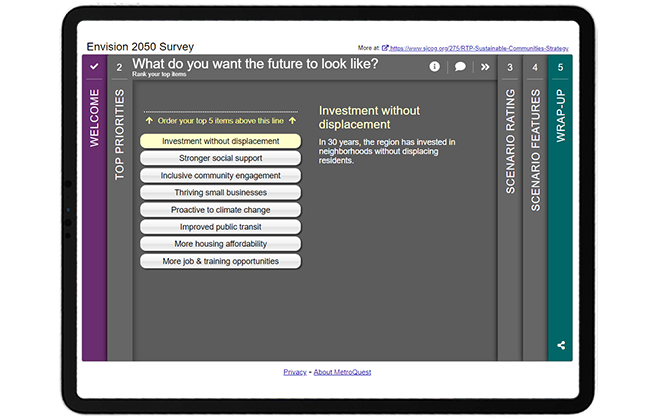
    Like many MetroQuest surveys, participants are introduced to the interactive part of the survey through a Priority Ranking Screen. This simple exercise asks participants to rank their top five of eight items. This activity is especially useful for long-range planning projects as it provides precise data on the priorities of the community. SJCOG’s survey asks for respondents to rank priorities such as improved public transit and more housing affordability among other topics. In many cases, it can be beneficial to include images next to each priority to make this Screen more welcoming and easier to navigate, as well as to appeal to visual learners.


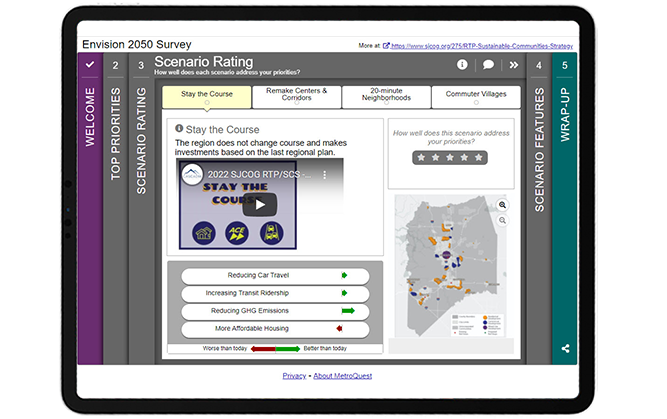
    Screen 3 utilizes MetroQuest’s unique Scenario Rating Screen format which provided a perfect platform for the project team to present all four possible future scenarios. Each of the four tabs on this Screen shares context and information through a brief video description of the scenario, arrow indicators showing how the scenario would impact the community, and a map presenting land-use changes. The most important piece on each tab is the five-star rating scale, where participants can rate whether the scenario addresses their priorities. The engagement team did several things very well on this Screen and on the Survey overall: we will discuss this in more detail later in this blog post.


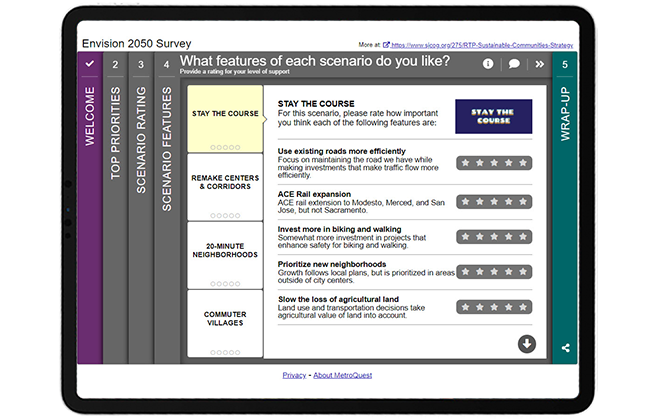
    Following the Scenario Rating Screen, participants are presented with the Strategy Rating Screen which in this case was used to rate various features of the four scenarios presented on the earlier Screen. By using the same consistent names for each scenario, this Screen transitions seamlessly from Screen 3, avoiding any confusion as can often be the case with surveys asking for feedback on various options. Each feature includes a sentence-long description to help explain the impact it would have on the community. You will notice that the images in the top right of this Screen retain the same branding from the videos on the previous Screen. The visual and language consistency throughout the survey is an excellent example of how well-executed, clear content can make a huge difference in helping participants understand a survey and provide valuable feedback.


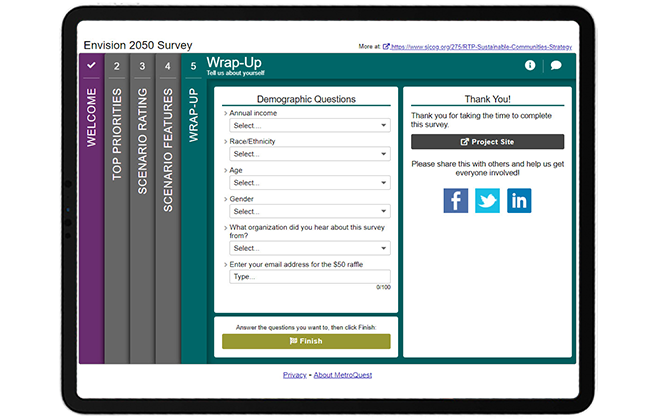
    The last Screen completes the survey with four simple dropdown questions asking for demographic information on income, race/ethnicity, age and gender. It also asks how participants heard about the survey, which can be valuable information to inform future engagement initiatives.


    Try the survey yourself! Complete this demo version of the Envision 2050 survey to try the survey live. Your responses will not impact the survey results. Don’t forget to come back to this tab to keep reading the next section below where we share some helpful takeaways!


    5 Tips from the Envision 2050 Survey: Engaging Videos and Consistent Content Makes all the Difference!

    The project team successfully used MetroQuest to design a long-range comprehensive survey that was engaging and informative yet quick to complete. Long-range planning is complex and its materials wordy but the use of videos throughout helped participants make an informed decision before providing feedback. Additionally, planning for the future can often feel abstract and far away. To allow participants to better imagine the reality of each scenario, the videos included on the Scenario Rating Screen were narrated in the voice of someone from the future. These types of features are just a few examples of what set this survey apart and contributed to an overall interactive participant experience.

    Here are 5 takeaways from this survey to keep in mind when you design your next survey:

    1. As mentioned above, this survey featured five embedded videos, all under one minute in length. The inclusion of videos eliminates the need for a significant amount of text, adding to the interactive and engaging tone of the survey. By keeping the videos short, the SJCOG team successfully ensured their survey remained quick to complete, increasing the likelihood of receiving high-quality feedback. Additionally, the inclusion of text in the videos allows the survey to remain accessible for the hearing impaired. Embedding videos is explained on our support website.
    2. Consistency was key with this survey! Since many participants learn about an initiative at the time of taking a survey, especially in this age of virtual engagement, it is crucial to keep terminology and naming consistent and simple to avoid any confusion. Consistent naming of the four scenarios throughout the survey and consistent branding with differentiated colors for each scenario helps tie everything together. These small design elements can be the difference between someone understanding the survey and providing accurate feedback or someone getting confused and giving up on the survey prematurely.
    3. One of the primary features of the Scenario Rating Screen (Screen 3 in this survey) and a unique feature of MetroQuest is the green and red arrow indicators that show how each scenario impacts the community differently. This survey makes great use of this feature by showing how every scenario would impact four important factors: reducing car travel, increasing transit ridership, reducing GHG emissions and more affordable housing. Participants could weigh their preference for each scenario by looking at whether the factors would be worse or better than today.
    4. Also on the Scenario Rating Screen, the project team included map images showing different zoning areas and boundaries for each future scenario. By utilizing a consistent map format that was sized and formatted the same way in each of the four tabs, participants can easily flip between scenarios to see how the map changes. This too helps participants identify which of the scenarios most aligns with the future they wish to see.
    5. The fourth survey Screen utilizes the Strategy Rating Screen, gathering ratings on several features for each of the four future scenarios. This Screen continued to use consistent naming and branding to ensure a smooth transition from the previous Screen and that respondents could differentiate between the options. Including concise, action-oriented descriptions for each feature allows for well-educated feedback and, subsequently, quality data!


    Congratulations to the project team at SJCOG and Cascadia Partners for creating a fun and interactive MetroQuest survey! Their use of videos brought the future of the San Joaquin region to life and most importantly helped their team collect important community input.

    For more great tips on how to make the most out of MetroQuest, contact our Customer Experience team or reach out for more information!


    * This survey was a target of what is known as ballot-box stuffing, an infrequent but persistent issue where duplicate or fraudulent responses are submitted to skew results or increase changes of winning a monetary incentive offered to survey takers. In this case, it was likely the latter, as a $50 raffle was offered to participants. In total, over 4,000 participants interacted with the survey but many had to be filtered from the final data set, resulting in approximately 400 valid participants. If your organization is considering offering an incentive for your survey respondents, we recommend using local prizes that only someone in your community could use. We have found that non-location-specific rewards such as cash or a gift card to a nation-wide or online retailer often encourage ballot-box stuffing. Rest assured, if ballot box stuffing should occur with your survey, MetroQuest has steps to address it to ensure data integrity.


    Want to learn more about how MetroQuest supports community outreach on your next transportation plan? Check out our recent webinar:
    The Key TO Great Public Engagement Results:
    How KYTC Engaged 8300+

    The Kentucky Statewide Transportation survey collected more than 140,457 public responses and comments in just over a month! In this webinar, the team shares the complete process that led to this public engagement success.
     

    WATCH WEBINAR


  • TRB 2022 Annual Meeting: Through the Lens of the AJE40 Committee

    TRB 2022 Annual Meeting: Through the Lens of the AJE40 Committee

    Jeff Moore, AICP, is the chair of the Committee on Public Engagement and Communications with the Transportation Research Board. He has been active with the TRB since 2004. Jeff has also served as a planner with the Division of Planning at the Kentucky Transportation Cabinet, District Three Office, Kentucky for over 31 years. He is currently employed as a transportation planner for Michael Baker International.


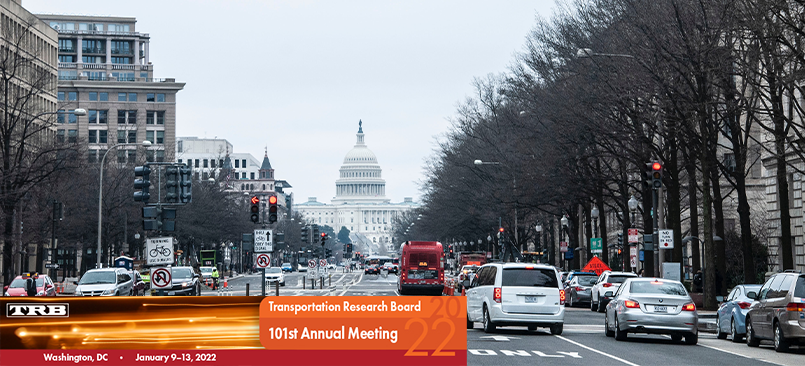
    As less than 9,000 attendees cautiously gathered into Washington this past week, we approached this year’s return to an actual in-person TRB Annual Meeting with an attitude of “Grace and Gratitude.”

    As many of the committees, sessions, and workshops struggled with missing presenters and key committee members, COVID19 safety protocols and attempts to virtually reach out to those not able to attend, we approached each of these challenges with a sense of grace that best efforts were made and at times worked well, and other instances were at least brave attempts. At the end of the experience, we all were filled with a sense of gratitude for the opportunity to reconnect with long-missed friends and colleagues, the ability to share our lessons learned, and the realization that many of us are making it to the other side of the past two years’ worth of difficulties.

    “Despite some sessions being canceled, it still turned out to be a great conference. It was great to see colleagues I haven’t seen in 2 years”

    — Jamille A. Robbins, Public Involvement, Community Studies & Visualization Group Leader, N.C. Department of Transportation


    Identifying the Goals of the 2022 TRB Executive Committee

    With an eye toward the beginning of the second century of TRB and in response to the massive societal and economic shifts resulting from the past two years of difficulties, the TRB Executive Committee is commencing early work on the identification of the Critical Issues in Transportation.

    This effort will focus on five broader societal goals:

    1. Safety and Security;
    2. Public Health;
    3. Economic and Societal Vitality;
    4. Climate Change; and,
    5. Equity.

    Additionally, TRB is embarking on a new Strategic Plan. Goals for the plan include:

    1. Preparing to address current and future issues;
    2. Expanding TRB’s impact; and
    3. Assuring continued creativity, resilience, and sustainability.

    Despite the lower attendance, the TRB 2022 Annual Meeting program contained 350 sessions and workshops and more than 300 committee meetings.


    Activities of the AJE40 Committee at the TRB 2022 Annual Meeting

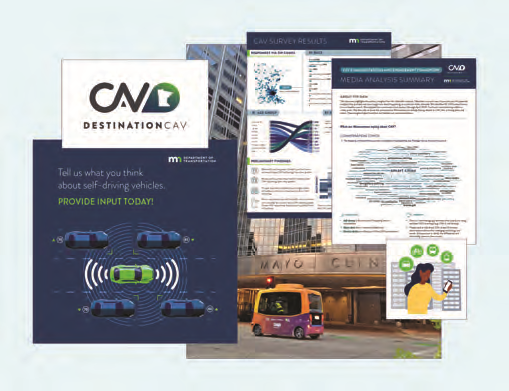
    The AJE40 Committee provided a session spotlighting the winning and runner-up entries to the 15th Annual Communicating Concepts to “Jane and John Q. Public Competition”. Presenters at this session shared communication efforts in support of connected and autonomous vehicles, a re-imagining of an urban interstate highway corridor, a series of on-line chats in support of a MPO long-range transportation plan, and the creative melding of a local poet’s work into a video designed to inspire participation in the planning for a bus rapid transit line. The winner of this year’s competition was “Let’s Talk About CAV: Understanding Minnesotans’ Perspectives of Connected and Automated Vehicle Technologies” presented by Katie Caskey of HDR and Tara Olds of Minnesota DOT.


    The AJE40 committee assembled a poster session that included several informative posters received during the call for posters and posters spotlighting the competition winner and the other five noteworthy projects featured in the “Jane and John Q. Public Competition” session.

    • Competition Winner: Let’s Talk About CAV: Understanding Minnesotans’ Perspectives of Connected and Automated Vehicle Technologies; Katie Caskey, HDR and Tara Olds, Minnesota DOT
    • Runner up: PAVE Virtual Panel Series; Tara Andringa, Partners for Automated Vehicle Education
    • Runner up: Tuesday Traffic Jam; Corinne Tucker, Sarasota/Manatee Metropolitan Planning Organization
    • Honorable Mention: Lowcountry Rapid Transit Video; Samantha Dubay, HDR and Sharon Hollis, Berkeley-Charleston-Dorchester Council of Governments
    • Honorable Mention: Interstate 680 – Effective Communications Backed by Behavioral Science; Linsey Willis, Contra Costa Transportation Authority and Rebecca Krawiec, Convey, Inc.

    To learn more about some of these projects, check out the Award Recipients highlights.

    The committee partnered for this year’s annual meeting with AME60 (the Committee on Historic and Archeological Preservation in Transportation), AME80 (the Committee on Community Resources and Impacts), and AME10 (the Committee on Equity in Transportation) to produce an interactive workshop in which participants worked collaboratively in small groups to develop public engagement plans for two project scenarios that involved possible impacts to historic or archeological resources such as Native American burial sites, an established artist collaborative, and historic neighborhoods. Much effort went into the planning and execution of the workshop under the collaborative leadership of Michael Garua (Kimley-Horn) and Rusty Ennemoser (Florida DOT) from the AJE40 Committee and Linda Henderson (Texas DOT) and Rebekah Dobrasko (Texas DOT) from the AME60 Committee.


    “The focus of the workshop was to learn from each other about the slice of public engagement each of us does in our daily work and create a roadmap for communicating with the public about our projects from planning through construction. The primary takeaway is that early outreach and communication is imperative to identify what’s important to the community so that solutions can be identified before the project schedule is impacted.”

    —Session Co-Presenter Michael Garau, P.E., Kimley-Horn

    In addition to the sessions and workshop, the committee was able to meet in-person with many of its members and friends.


    Upcoming Work on Equity, Online Public Engagement Tools, and more

    One of the major topics of discussion during the meeting of the AJE40 committee was the success of the Conference on Advancing Transportation Equity (CATE) which had been held in early September of 2021. The committee was one of the three key sponsoring committees for the conference and plans are underway to move toward on-going efforts to address the issue of equity and would include a regularly scheduled major conference event.

    The agenda of the committee included reports from the committee task forces on Research and on Education. The Research Task force included updates on Project 08-142 Best Practices for Using Online Tools in Public Involvement Processes, which is currently underway with Rutgers University as the principal investigator and a targeted completion in the spring of 2024; and on the implementation of NCHRP Report 905: Measuring the Effectiveness of Public Involvement in Transportation Planning & Development. The 905 Implementation project is in progress with the DOTs of North Carolina, Georgia, Utah, Texas, and Arizona participating. A report will be compiled with the findings from the implementation of the tools developed as part of the NCHRP 905 project.

    NCHRP 08-161: Identify Emerging Approaches for Public Engagement to Meaningfully Involve Minorities, Low-Income, and Other Vulnerable Populations is another committee-sponsored research project that is anticipated to be underway soon. Additionally, the AJE40 committee is currently collaborating with the Committee on Visualization in Transportation to propose a synthesis project to examine the current state of the practice of using visualization tools and techniques in public engagement and communications.

    The committee’s task force on Education shared their work on the development of a possible public engagement curriculum module for university-level engineering and planning students. A survey was conducted of engineering and planning faculty to understand the need for educational resources on public involvement. One insight learned from the survey is that college professors and educators understand the need for students to learn about public engagement, and that there is a desire to use educational resources developed by others.

    During the upcoming year, the task force will work to complete a Public Involvement 101 video presentation that could be used in engineering and planning courses. The video would focus on answering the following questions: What is public involvement; Why it is important; How it could affect your project; and What does public involvement look like. The task force also developed conceptual definitions of “engagement” and “communications” which have been incorporated into the forthcoming Triennial Strategic Plan for the Committee.

    Additional information on the activities of the TRB AJE40 Standing Committee on Public Engagement and Communications can be found through the committee website.

  • [SURVEY OF THE MONTH] How Virginia DOT is Solving Traffic and Safety Challenges with MetroQuest

    [SURVEY OF THE MONTH] How Virginia DOT is Solving Traffic and Safety Challenges with MetroQuest

    The Survey of the Month series is a monthly blog where we highlight the extraordinary work our customers are doing, along with some takeaways that are relevant for anyone interested in making the most out of online engagement using MetroQuest’s survey platform! To see more in the series, visit the blogs here.

    This month, we are highlighting a Virginia Department of Transportation (VDOT) survey that is part of the Woodbridge Area STARS Studies. VDOT identified significant traffic backups and road congestion in the Woodbridge Area during the morning and evening peak times. To identify solutions for alleviating the problems, the study assesses potential safety and operational improvements for the interchange of I-95 and Route 123.

    What’s the story? Comprehensive Transportation Solutions to Relieve Congestion in Woodbridge

    According to the project website, data from a 2019 study showed that over 300,000 vehicles a day use the I-95 and Route 123 interchange. VDOT identified the need for improvement and launched a study to assess reconfiguring ramps, extending lanes, modifying and relocating traffic signals, access management, as well as transit enhancements to improve traffic flow on the interchange. This study is part of a larger initiative called STARS; Strategically Targeted Affordable Roadway Solutions. The objective of the STARS program is to develop comprehensive and cost-effective transportation solutions to relieve congestion bottlenecks and solve critical traffic and safety challenges throughout the state of Virginia.

    They created MetroQuest Surveys in English and Spanish to gauge community priorities and collect opinions around the suggested solutions.

    To learn more about the project, please visit the Woodbridge Area STARS Studies website.

    Anatomy of a Corridor Survey: Using MetroQuest to Understand Community’s Preferences

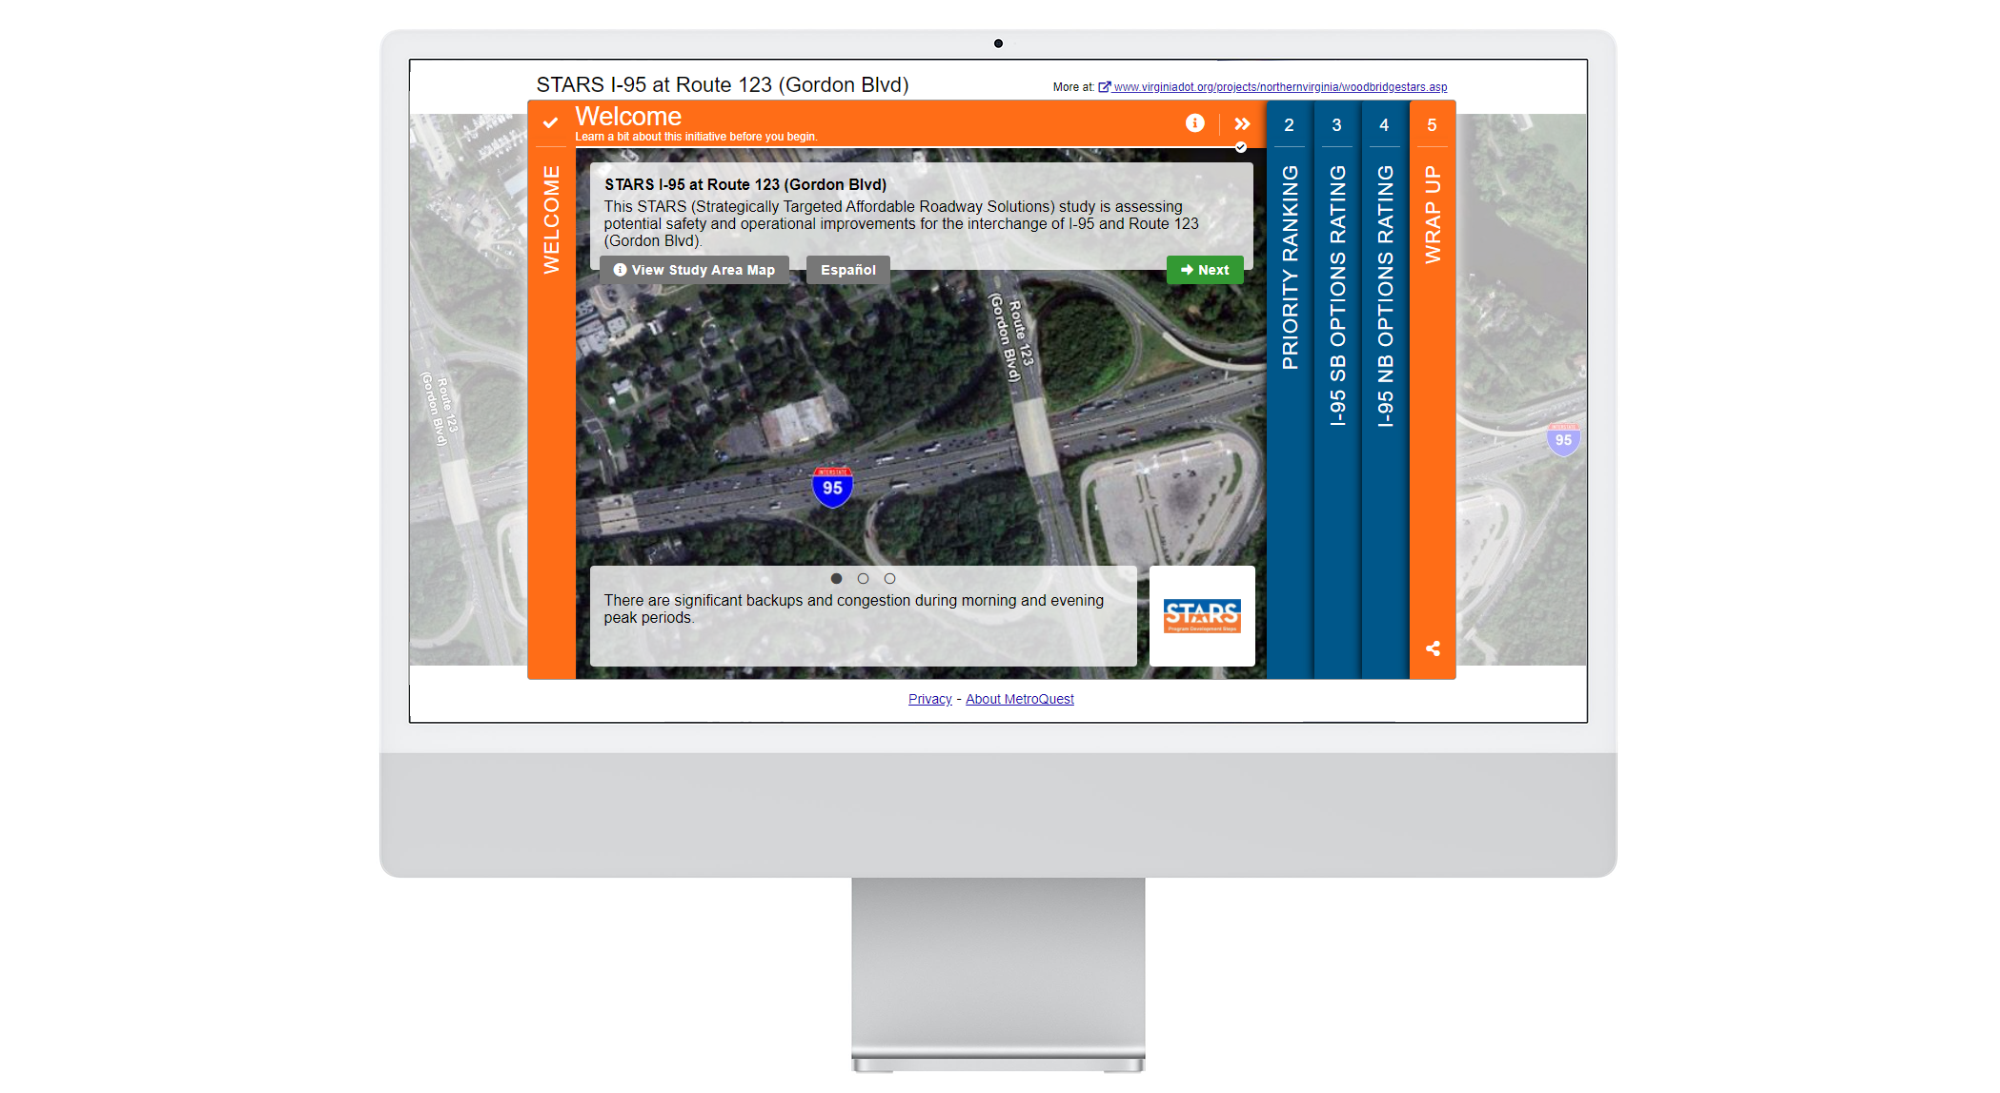
    The I-95 and Route 123 Survey starts with the Welcome Screen, containing an aerial photograph of the interchange. This is a fantastic way to captivate the visitors as they can concisely read the study’s background information to quickly grasp its intention and its relevance to their lives.


    Like many other successful MetroQuest Surveys, the Priority Ranking Screen follows next and is used to identify the visitor’s priorities within the study area. Visitors are asked to rank their top 5 out of 9 possible items. The priorities include significant factors such as congestion, safety, active transportation accessibility, travel time reliability and express lane improvement. Each priority includes a brief and practical explanation.

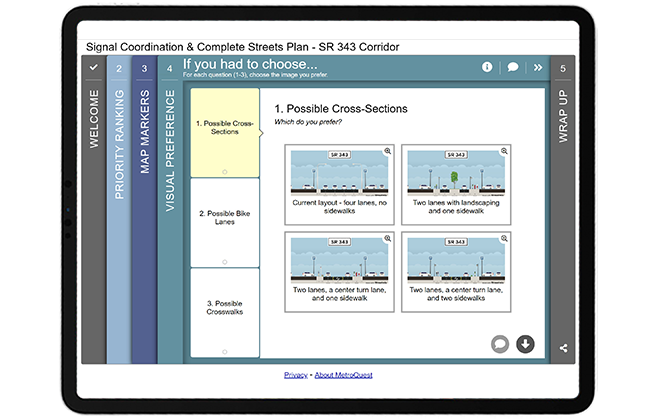
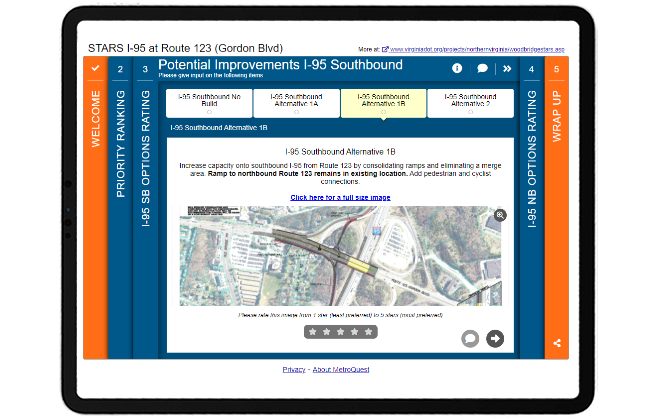
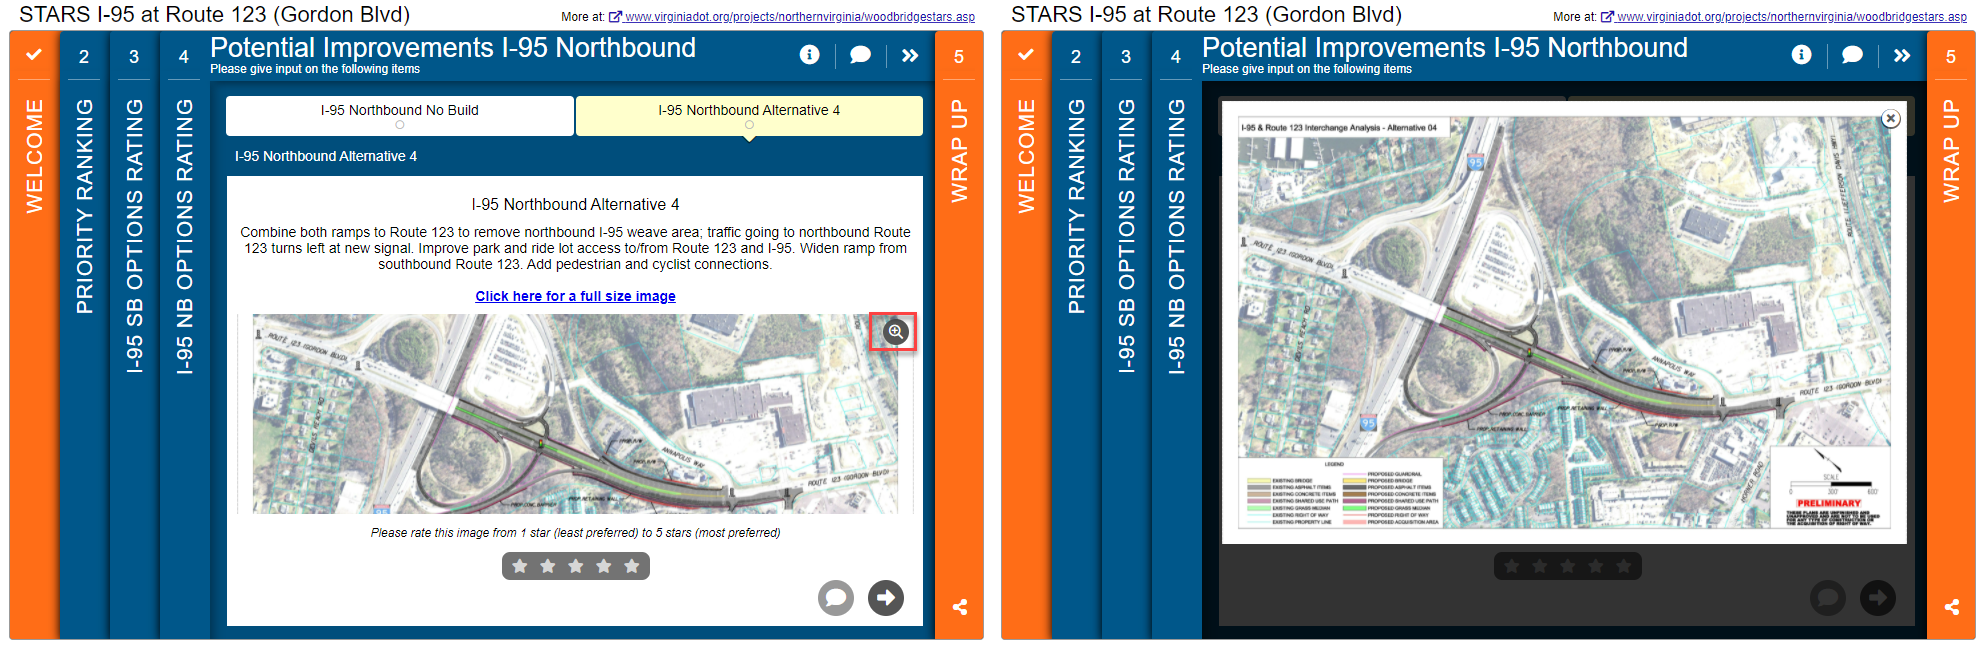
    Two subsequent Image Rating Screens are utilized to present potential improvements for I-95 southbound and northbound. Each option has an image, a description of the improvement required and the predicted outcome. Participants are asked to rank each potential improvement on a 5-point scales and provide input as possible solutions with various outcomes.


    MetroQuest Survey is designed to be non-linear, meaning that visitors can jump around, move backward to re-read and change their answers. The combination of the non-linear design and the Image Rating Screen plays a significant role in VDOT’s Survey, allowing the visitor to inspect and compare various suggested options in any order they prefer and make an informed decision before providing input.

    Please feel free to try the MetroQuest Survey. This is a demo version that will not affect the survey results.

    5 Tips from VDOT’s STARS I-95 and Route 123 Survey: Simple Yet Effective Ways to Collect Valuable Input

    The STARS I-95 and Route 123 Survey breaks down complex material into comprehensible material by educating visitors, asking them to first rank their priorities before going into more detail into the priorities with possible solutions and various outcomes. VDOT engaged over 1200 participants by using multiple channels of outreach, with campaigns such as news releases to the media, targeted paid Facebook advertisements, organic Twitter posts, and email blasts.

    Below are 5 key takeaways from their survey:

    1. The Welcome Screen draws visitors into the survey with an appealing aerial photograph of the study area and contextual information. The aerial image and the extended background features catch the visitor’s attention without being overly distracting. The rotating sliders at the bottom of the screen are used to convey essential project information.
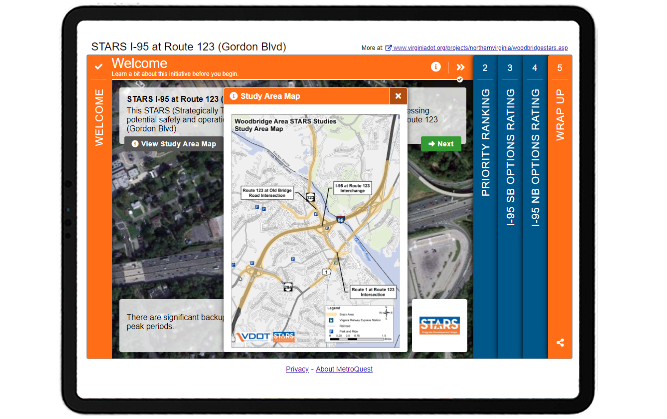
    2. On the Welcome Screen, the extra popup is adequately utilized to include the study area map to inform visitors visually where the study area is. Using image maps are effective when the information you need to convey is better presented visually than in text. Image maps deliver a large amount of information in a small space and serve to make them more interactive.VDOT_STARS-I-95_Welcome Screen
    3. As mentioned earlier, the I-95 and Route 123 study is part of a larger program called STARS, which involves planners, traffic engineers, safety engineers and roadway engineers to jointly implement innovative and practical solutions. The STARS branding logo and the branding colors and the branding colors, orange and blue, are used to elicit a sense of pride in the region and are used throughout the Survey for brand recognition.
    4. The Image Rating Screens include an image, text-based description of required work and the outcomes. This is an excellent use of the Screen features to allow participants to view the differences between the alternatives so that they can provide informed input. The visitors have two options to zoom into the images to view more details:
      a) When the magnifying glass icon on the top right corner of the image is clicked, visitors can view a larger image without leaving the Survey. Keeping the participants in the Survey until the end will help you achieve a higher completion rate.VDOT Survey screen 4with the magnifying glass iconb) The hyperlink text “Click here for a full-size image” opens a new tab in the browser to open a much larger image that fills up the screen. In this case, it is essential to include the hyperlink as the participants are presented with complicated map images with legends to digest.
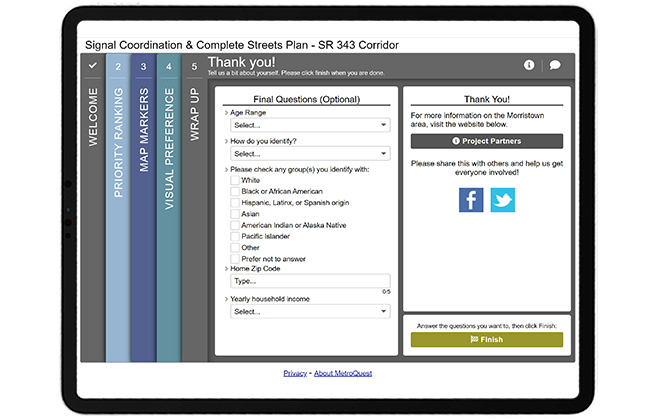
    5. We do not typically highlight the Wrap Up Screen, but in VDOT’s Survey, the simplicity of their team’s demographic questions, used to collect necessary information for their study, is one of the key takeaways! They ask simple yes/no questions about whether they live or work near the study area and the home and work zip codes. To ensure your Survey reaches a diverse population, it is recommended to include demographic questions such as gender, age, race, and income. We often notice that most surveys ask for personal information such as email addresses and home addresses, but you should try as much as possible to avoid collecting personal data. Asking for the participant’s email address as a demographic question is a turn-off for the participants who believe they are doing you a favor by answering your Survey. This practice also assures the anonymity of survey responders.

    Congratulations to the team at VDOT for another successful MetroQuest Survey with an outstanding turnout for their corridor study!

    For more great tips on how to make the most out of MetroQuest, contact your Customer Experience manager or reach out for more information!

    Want to learn more about how MetroQuest supports community outreach on your next transportation plan? Check out our recent webinar:


    The Art and Science of Virtual Public Engagement for Transportation Planning

    The Art and Science of Virtual Public Engagement for Transportation Planning

    The road to success with online surveys is part art and part science. This webinar explores both by unbundling the most successful case studies and what made them so effective. Learn how to create delightful surveys that engage 1000s and deliver the results you need to support a wide range of transportation plans!