[SURVEY OF THE MONTH] Corridor Improvements for All Modes of Transportation
The Survey of the Month series is a monthly blog where we highlight the extraordinary work our customers are doing, along with some takeaways that are relevant for anyone interested in making the most out of online engagement using MetroQuest’s survey platform! To see more in the series, visit the blogs here.
For February’s Survey of the Month, we are featuring a survey developed by Fairpointe Planning and CDM Smith on behalf of the Lakeway Area Metropolitan Transportation Planning Organization (LAMTPO), located in Tennessee. The Morristown Signal Coordination & Complete Streets Plan for SR 343 is a study to transform S. Cumberland St. (SR 343) into a Complete Street that allows safe and accessible travel for pedestrians, cyclists, drivers and transit users. LAMTPO’s MetroQuest Survey gathered information on traffic signalization, potential street features and options for SR 343.
What’s the story? Planning SR 343 Corridor Route Improvements
LAMTPO serves a region that includes Morristown, Jefferson City, White Pine, and portions of the Jefferson and Hamblen Counties in northeastern Tennessee.
The Signal Coordination & Complete Streets Plan – SR 343 Corridor Survey was launched in October 2021 to gather input on potential improvements to State Route 343, also known as South Cumberland Street, which serves as a main artery just south of Morristown’s center. Feedback from this survey informed a Complete Streets plan with a goal of ensuring all transportation modes will function efficiently in the corridor. The survey, offered in both English and Spanish, provides opportunities for input on potential improvements, the location of these improvements and different design options.
Fairpointe Planning worked with the prime consultant, CDM Smith, and LAMTPO to design the survey and advertise it in the community. Through a combination of various outreach mechanisms, including social media posts, website content, emails, door-to-door visits and other “on the ground” outreach, the survey reached a significant portion of the community—resulting in nearly 700 total survey responses! The project team’s combination of virtual and in-person advertising is an excellent example of a campaign approach that ensures engagement of as diverse an audience as possible.
Read on to learn how they used MetroQuest to create a visually engaging survey.
To learn more, visit the LAMTPO website.
Anatomy of a Corridor Survey: Prioritizing Features, Mapping Improvements and Choosing Design Options
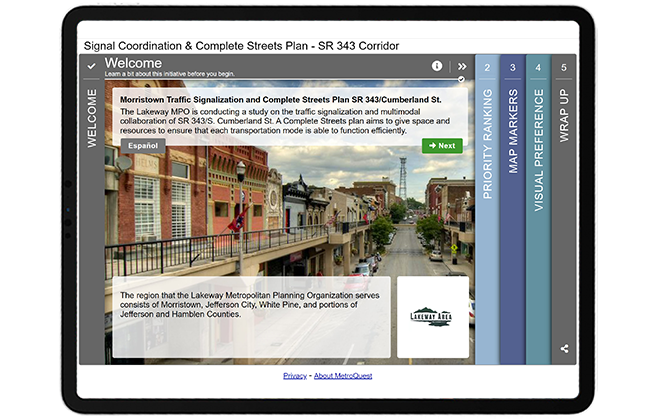
Starting with the Welcome Screen, the Signal Coordination & Complete Streets Plan – SR 343 Corridor Survey introduces participants with an engaging image and features a button linking to the Spanish version of the survey. By adding a button for the translated version in a visible place on the Welcome Screen, participants with a preference of completing the survey in Spanish were easily directed to their preferred language format before starting the English survey.
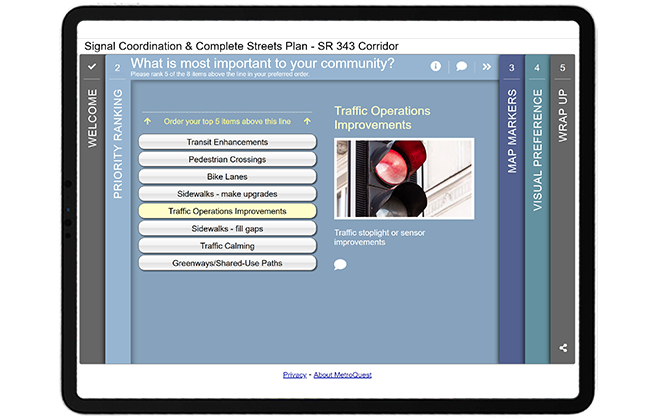
Following the Welcome Screen, participants are asked to provide initial feedback through the popular Priority Ranking Screen. Participants are presented with eight types of transportation infrastructure improvements, such as bike lanes and pedestrian crossings, and asked to order their top five items.
This simple exercise serves as an excellent starting point to introduce people to the survey while providing valuable information. The choice of the first activity after the Welcome Screen is one of the most important decisions when designing a MetroQuest survey; it forms the first impression for most participants, helping them determine whether the survey will be quick, easy and fun to complete. This is often the deciding factor between the participant completing the survey or closing their browser window!
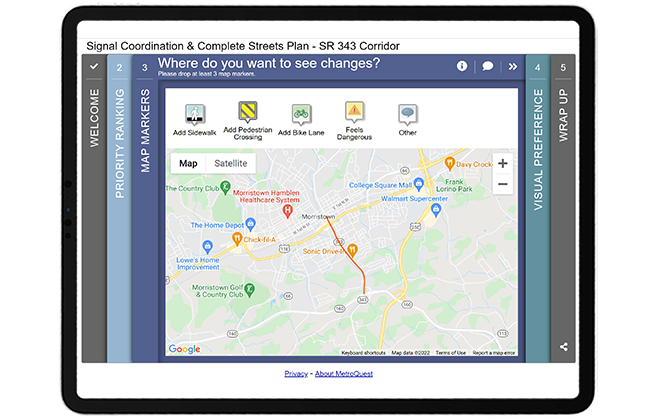
Next, the survey uses another of our most popular Screens, the Map Marker Screen. The map includes a KMZ layer outlining the project location, ensuring that participants will drop markers within the relevant project area.
Five “map marker” options guarantee that respondents can share a variety of geographic feedback, including potential locations for sidewalks, pedestrian crossings and bike lanes, as well as areas with safety concerns and opportunities to leave open-ended feedback. This visual and straightforward exercise allows the project team to collect precise information without asking a series of text questions.
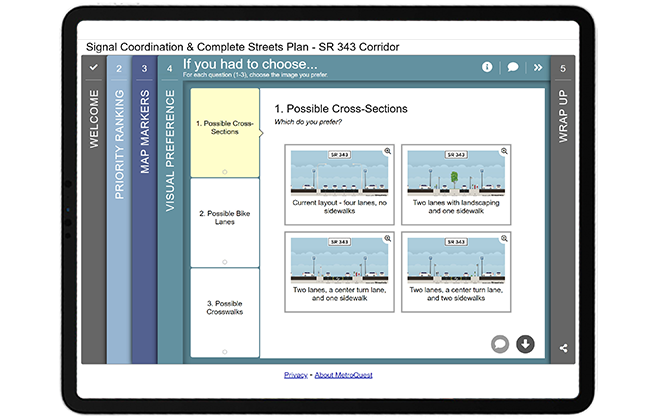
The fourth Screen features our Visual Preference Screen, a visually engaging Screen choice allowing participants to pick their preferred option from a set of images. Selecting clear, differentiated images is integral to receiving quality feedback with this Screen type. This survey was particularly well executed with consistently cropped and formatted images that clearly show the differences between options. Our “image zoom” feature, which allows participants to get a closer-up view, was beneficial for the four cross-section images showing different street configurations, as seen below.
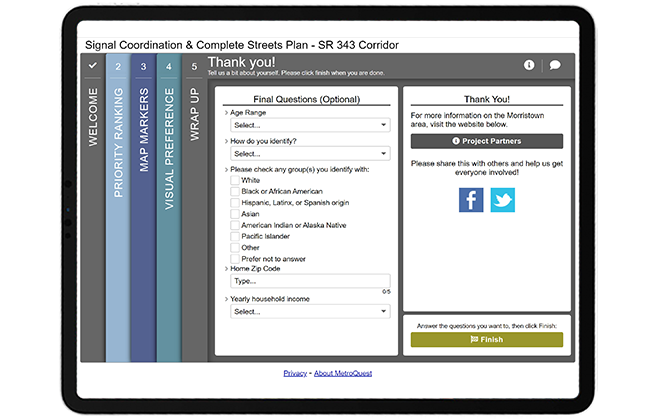
To finish, the Wrap Up Screen includes five simple demographic questions, keeping personal information at a minimum. When collecting personal demographic information, we recommend that customers utilize a dropdown format and write a brief description to explain why the information is being collected.
This Screen also includes a pop-up with links to all four project partner websites, which is especially useful when a number of organizations are involved with a project.
To try it for yourself, visit LAMTPO’s MetroQuest survey. This is a demo version that will not affect the survey results.
5 Tips from the Signal Coordination & Complete Streets Plan – SR 343 Corridor Survey: A Concise Survey with Engaging Visuals
This survey was designed to allow participants to quickly provide detailed input on the SR 343 Corridor. By using three very visual Screen types, a survey that would have normally been extremely technical was simplified through images and concise descriptions. This resulted in an inviting survey that garnered hundreds of responses.
Below are 5 takeaways from LAMTPO’s survey:
- This survey features concise text content, limiting the amount of time it takes for participants to complete each Screen while including descriptions and information pop-ups where necessary to provide additional context for more informed input. Avoiding lengthy text descriptions is an excellent way to keep your participants’ attention through to the end of your survey, resulting in quality feedback and a more complete data set.
- In addition to concise content, survey headers and descriptions are written in an active tone and directed at the participant. For example, titles such as “Where do you want to see changes?” quickly and clearly communicate the purpose of each Screen. The use of an active voice combined with plain language that avoids technical jargon contributes to the engaging tone of this survey.
- This survey is built around relevant and clear visuals. Instead of being greeted by a wall of survey questions, participants are introduced to the survey through the Priority Ranking Screen which includes eight different images. Later in the survey, the Visual Preference Screen presents image options so participants can quickly glance at photos to select their preferred feature. This survey also uses very well-differentiated images which contributes to the Visual Preference Screen’s effectiveness. Read one of our earlier blog posts to learn more about the benefits of creating visual surveys.
- The markers on the Map Marker Screen include questions with dropdown menus to collect quantitative, close-ended data. This ensures that this Screen’s data will be easily quantifiable and simple to analyze while also creating an easy-to-complete task for participants. This survey struck a perfect balance by adding an “other” option with an open-ended comment box, creating a space for participants to share different ideas if desired.
- Additionally, the Map Marker Screen is well-formatted with a KMZ layer, adding a red line to denote the project location. The map is centered on the applicable area so participants know exactly what area to place map markers in.
Congratulations to Fairpointe Planning, CDM Smith, LAMTPO and the broader project team for designing an excellent, visual survey!
For more great tips on how to make the most out of MetroQuest, contact our Customer Experience team or reach out for more information!
Want to learn more about how MetroQuest supports community outreach? Check out this in-depth case study about how COMPASS gathered input to plan future transportation:

COMPASS Gathers Input from 18,500+ Participants to Plan Future Transportation
To help shape the future of the region and determine local growth into 2050, local planning officials at COMPASS turned to the public for input and achieved record-breaking results!