[SURVEY OF THE MONTH] Long Range Transportation Planning with MetroQuest in Northeastern Pennsylvania
![December 2020 SOTM [SURVEY OF THE MONTH] Long Range Transportation Planning with MetroQuest in Northeastern Pennsylvania](https://metroquest.com/wp-content/uploads/December-2020-SOTM.jpg)
Survey of the Month is a blog series highlighting particularly great examples of work our customers have done with MetroQuest. This month, we’re excited to share a survey on a topic that MetroQuest has been involved in since the early days: Long Range Transportation Planning (LRTP, known as Transportation Master Plan or TMP in Canada). Many agencies have used our surveys for LRTPs to great success! As always, we will be sharing some insights of this particularly well-designed survey and highlight simple take-aways to help you with your next public engagement project!
One of our long-standing customers, Michael Baker International (MBI), created a fantastic LRTP survey in conjunction with, and for, The Northeastern Pennsylvania Alliance (NEPA) for the Metropolitan Planning Organization (MPO) of the region. Let’s take a look at the project!
What’s the story? Creating a Better Regional Transportation System in Northern Pennsylvania
Four counties (Carbon, Monroe, Pike, and Schuylkill) in Pennsylvania comprise the NEPA MPO and this is their second LRTP plan since receiving the designation in 2010. LRTPs are an important planning tool, especially when federal funding is as unpredictable as it is currently. They are an opportunity for the MPO and its partners to understand trends and drivers that impact the transportation programs and help decide where future, typically limited, funds should be spent.
NEPA MPO’s LRTP identifies the major transportation projects, programs, and policies that are to be prioritized in the next twenty-five years. It further establishes the vision and goals that will guide public decisions affecting transportation facilities, infrastructure, and services in the entire MPO region.
To learn more about the LRTP public outreach project, visit the NEPA website or take a look at the report, including MetroQuest data.
Anatomy of an MTP Survey: How NEPA MPO Identified Transportation Priorities and Improvements
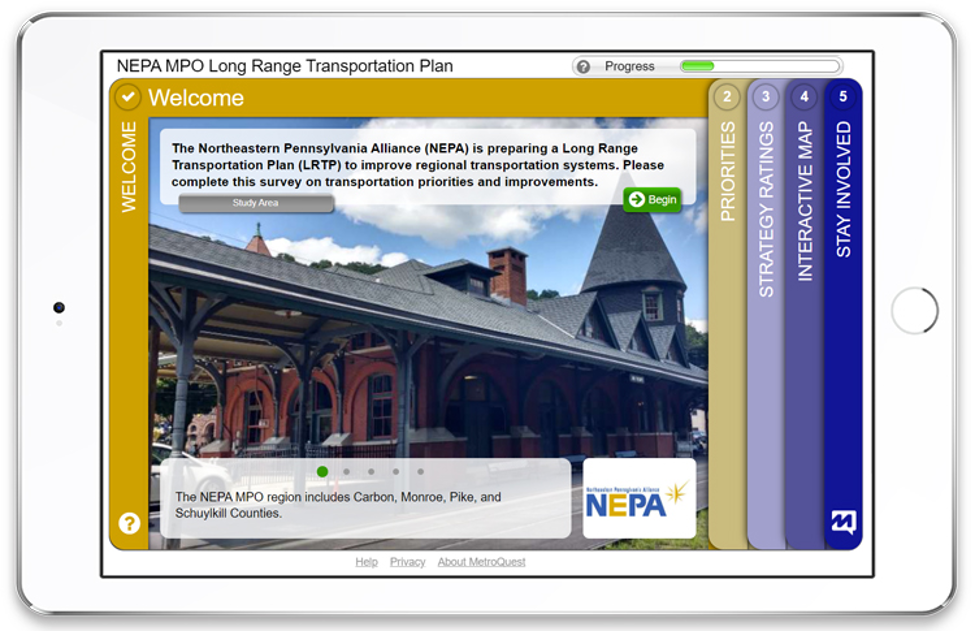
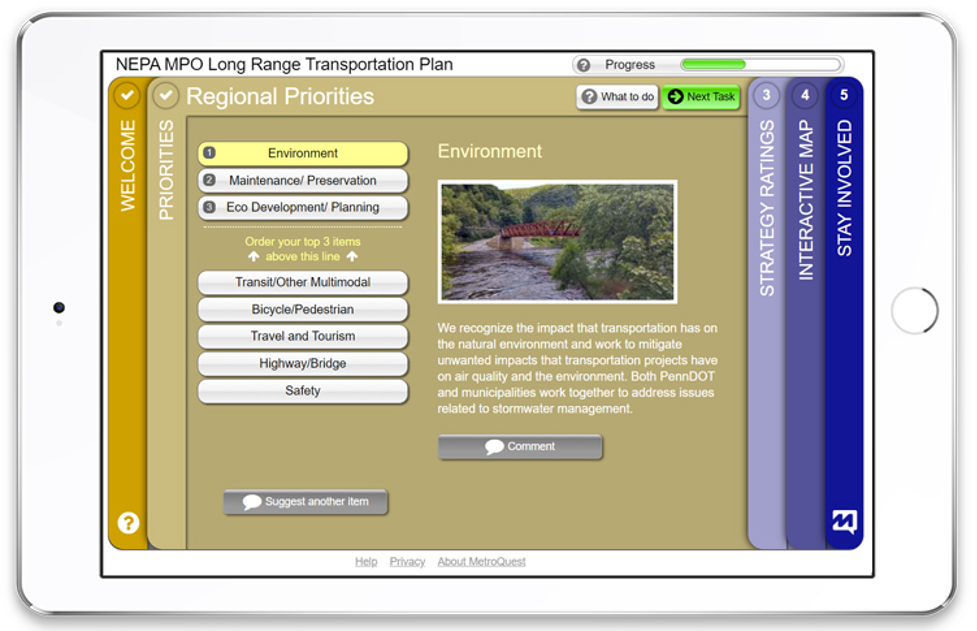
The MetroQuest survey starts with the Welcome Screen which includes facts about the transportation network. This provides context for the participant so that they have some understanding of the situation, and why they are being asked to provide input. The survey’s first interactive screen is a Priority Ranking Screen where participants are asked to rank 3-5 transportation issues that they would like to see addressed, using a list of possible answers, namely Environment, Bicycle/Pedestrian, Eco Development/Planning, Safety, Transit/Other Multimodal, Highway/Bridge, Maintenance/Preservation, as well as Travel and Tourism. These are all priorities that were previously identified by the team.
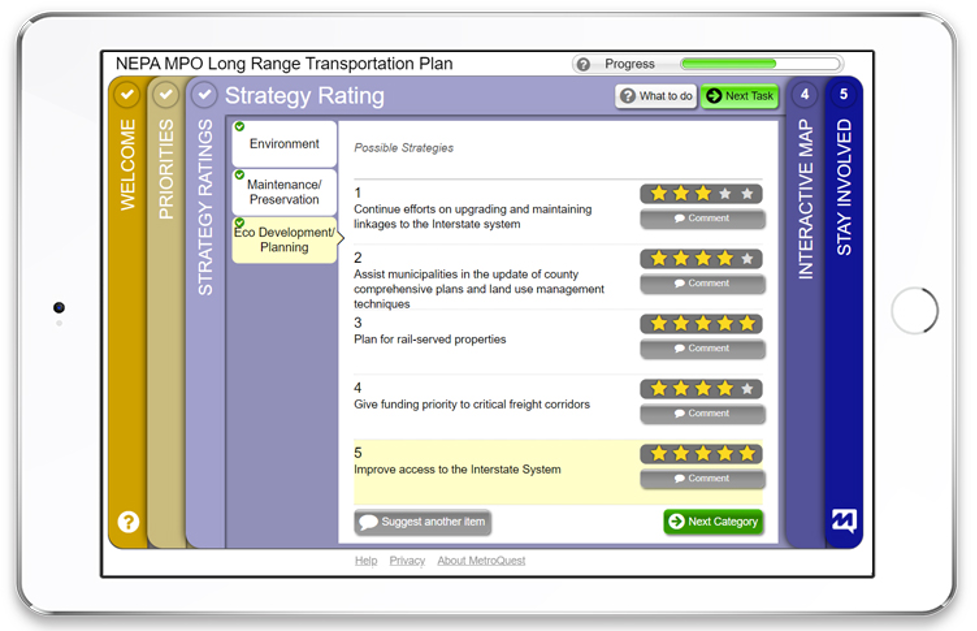
Subsequently, on the Strategy Rating Screen, participants revisit the top transportation issues that they identified as priorities on the initial screen and are presented with a number of corresponding, possible strategies. Their task is to rank each strategy on a 5-point scale and provide input on each item as a potential solution for different issues.
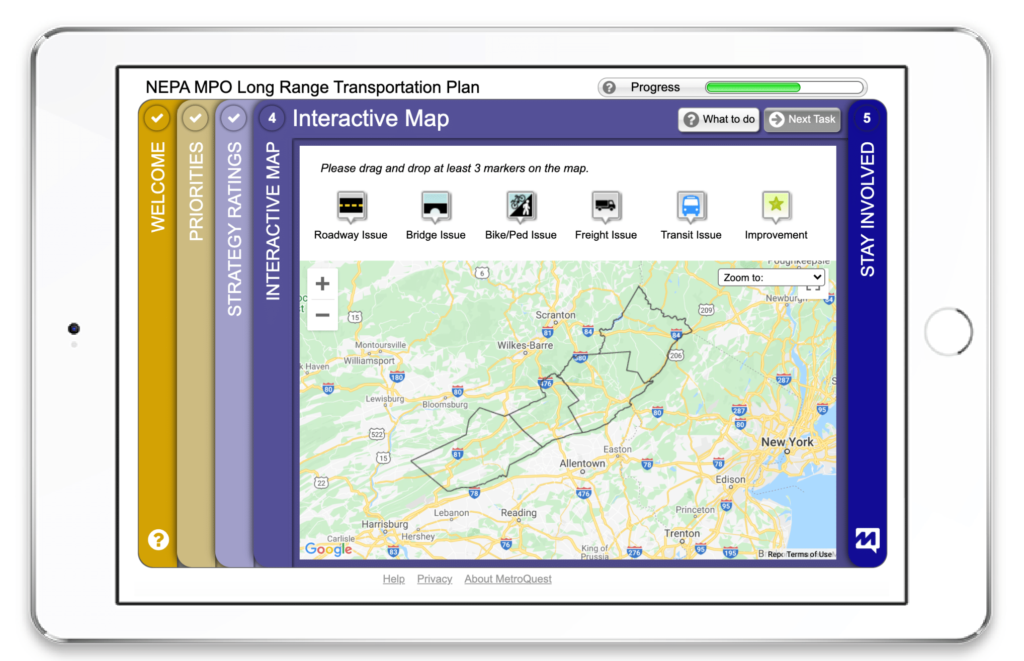
Before providing some demographic information, participants are then asked to identify issues geospatially on a Map Marker Screen. They are asked to drop at least 3 markers onto the map to show where they see transportation-related issues in their day-to-day. This helps the NEPA team to collect information on issues that the research might not have identified. The markers participants can choose from include Roadway Issues, Bridge Issues, Bike/Ped Issues, Freight Issue, Transit Issue and Improvement.
You are welcome to try the MetroQuest survey. This is a demo version that will not affect the survey results.
5 Tips from NEPA MPO LRTP: Making the Most of MetroQuest’s Capabilities
The LRTP survey distills complex material into bite-sized pieces of information by presenting high-level priorities first, then drilling-down into these priorities with strategies, before asking for additional geo-spatial input on a map. The result is an interactive exercise that yielded data from almost 200 participants and helped gain insight on existing conditions as well as give a platform for participants to voice concerns and recommendations. Below are five takeaways from their survey:
- The Welcome Screen is intended to provide background information for survey participants without slowing them down too much. The use of the pop up is great for supplementary information. In this case, the team included a map of the study area, which helps those that are unsure about locations to familiarize themselves with the area of the study. Those that know the study area well can go straight into the activities.
- MetroQuest allows you to set the Screen colors and tailor them to your project. The survey team here chose the colors from the NEPA logo as well as complimentary colors to make the survey recognizable as an activity from NEPA. Brand recognition is always a good idea!
- Connecting the Strategy Screen to the Priority Ranking Screen has a number of benefits; first, the Survey Rating Screen only presents strategies for priorities that participants identified as important in the first activity. This gives the survey a customized feel, making it a more enjoyable experience and keeping the participant interested and engaged. Second, asking participants to weigh in on 40 strategies seems daunting, but providing input on 3-5 strategies for 3-5 priorities is much more doable – again, making it a more delightful experience which means they are more likely to continue taking the survey, leading to more data per participant.
- The survey team opted to include a zoom dropdown on the Map Marker Screen, allowing participants to zoom quickly to the location they are most interested in for more accurate input and data. Particularly if you have a large study area, this is a good idea that’s very helpful for participants!
- Also on the Map Marker Screen, NEPA chose to include follow up questions for some of their map markers; for example, giving them the chance to elaborate on the type of roadway or bike/pedestrian issue. This allows participants to quickly provide input, making it more likely that they do than if they had to type out their answers, and providing more usable data as a result.
Congratulations to NEPA and Michael Baker International on a great looking survey!
For more great tips on how to make the most out of MetroQuest, contact your Customer Experience manager or reach out for more information!
Want to learn more about how online surveys like MetroQuest support community outreach on your next planning project? Check out our recent webinar:
The Art and Science of Effective Online Surveys for Planning
What makes an effective online survey for public engagement? Join expert Dave Biggs as he drills down into the elements of a great survey from content to promotion to data!


