Tag: comprehensive plan

  • [SURVEY OF THE MONTH] Our City, Our Voices – Comprehensive Planning for today and the future with the City of Nanaimo

    [SURVEY OF THE MONTH] Our City, Our Voices – Comprehensive Planning for today and the future with the City of Nanaimo

    The Survey of the Month series is a monthly blog where we highlight the extraordinary work our customers are doing, along with some takeaways that are relevant for anyone interested in making the most out of online engagement using MetroQuest’s survey platform! To see more in the series, visit the blogs here.

    This month, we want to highlight a comprehensive plan in an earlier stage of planning for Nanaimo, a harbour city on the east coast of Vancouver Island in British Columbia, Canada. LANARC Consultants are helping the City and its Mayor with an initiative to engage the community to receive great ideas and collectively create a vision and road map for their city’s future!

    What’s the story? A path to the future, together!

    The City of Nanaimo currently has a population of 100,000. By 2045, they estimate 140,000 people will live, recreate and work there. Nanaimo’s Mayor and Council introduced REIMAGINE NANAIMO, an initiative to collectively imagine how the spaces and places of the city can evolve to better meet the needs of the natural environment and the people.

    REIMAGINE NANAIMO is part of a multi-phase comprehensive plan. The initial phase gathered ideas by sharing information and listening to resident’s views about the city’s future. Now, the city is developing options for achieving its shared vision and is evaluating ways to support the goals.

    The Survey had incredible outreach campaigns working with influencers on various social media platforms to reach diverse demographics. They engaged 1539 participants with 20906 data points. Because of the Survey’s fun and informative components, which we will talk about below, REIMAGINE NANAIMO achieved an impressive participation rate of 64% meaning at least 1 out of 2 visitors shared their input; a typical Survey obtains around 20 to 30% participation rate. They could not be happier with the results!

    To learn more about the project, please visit the project website here.

    Anatomy of a Comprehensive Plan Survey: Priorities, Scenario Exploration, and Scenario Building

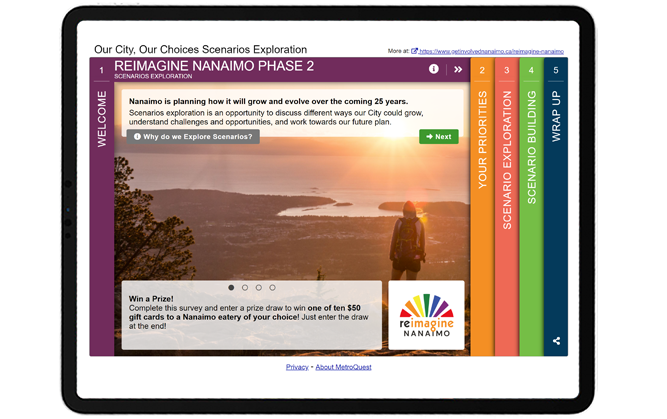
    When visitors open the Survey, they are welcomed by the beautiful scenery of a hiker overlooking the city, a short introduction of their project and information on the significance of their input on the Welcome Screen.
     

    Anatomy of a Comprehensive Plan Survey: Priorities, Scenario Exploration, and Scenario Building


    On the following Priority Ranking Screen, participants are asked to rank their top 5 priorities out of a list of 10 related to transportation, economy, housing and natural environment. The selected top 5 priorities are shown on the following Screen, the Scenario Rating Screen, where participants are asked to explore 3 different scenarios: Current Path, Mobility Hubs and Central Focus.
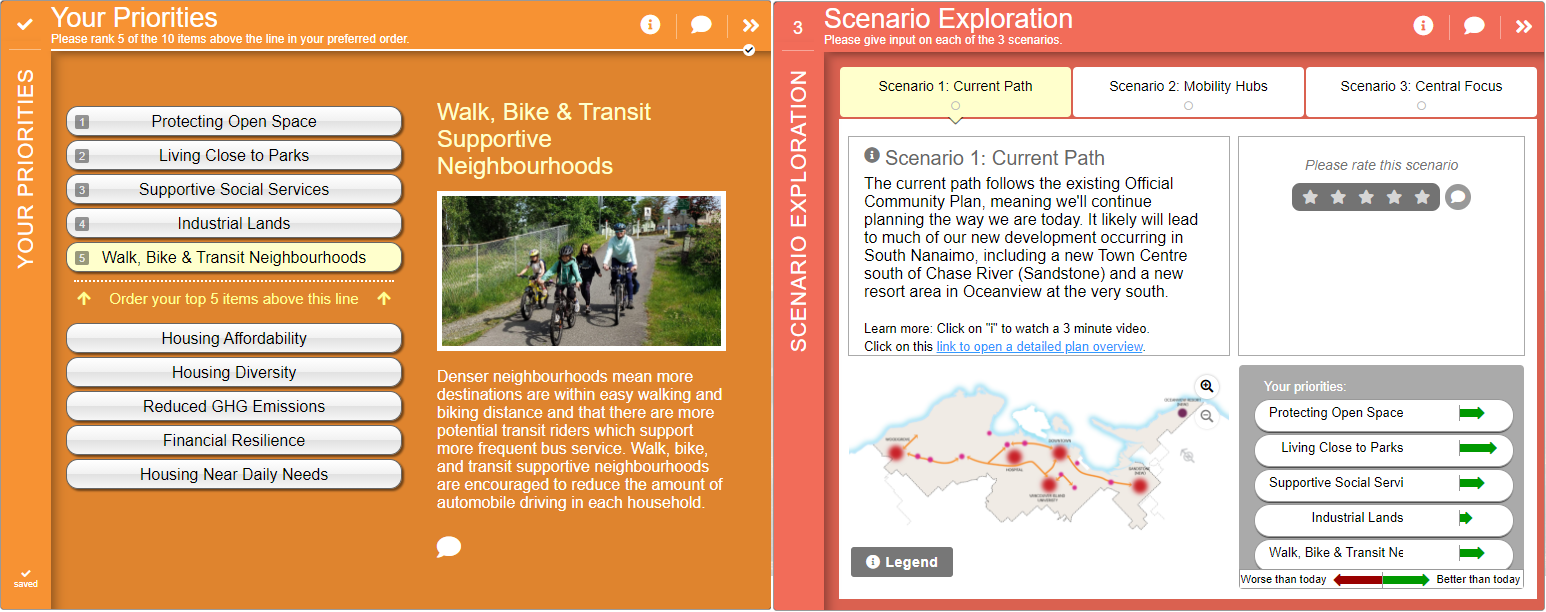


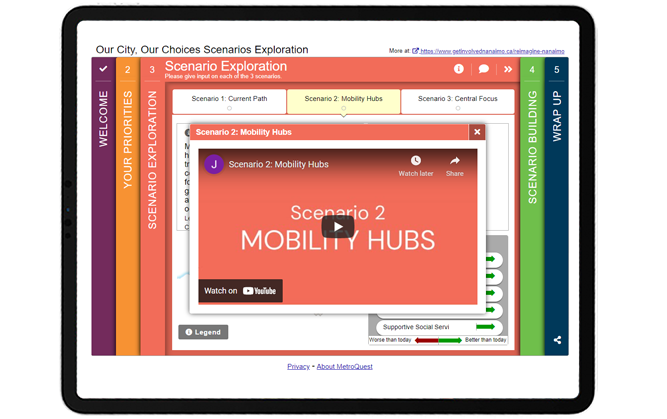
    By showing the priorities with as metrics, participants can discern which scenario performs best given their priorities and make informed decisions! The participants can familiarize themselves with the project by viewing the detailed plan overviews in PDF and short videos.


    On the next Screen, the Map Marker Screen, the participants are asked to provide input on the types of destinations that they feel are missing in Nanaimo by dropping makers on a Google map. The marker types to choose from were “Tall Buildings”, “Infill Neighbourhoods”, “Shops & Services”, “Community Amenities”, “Support Services”, “Active Trans & Transit” and “Other”. Each marker has dropdown options and a comment box for the participants to provide more in-depth input.

    Finally, the Wrap Up Screen asks a few demographic questions, thanks the participant and allows them to enter in a prize draw for a local eatery.

    We encourage you to try the Survey by clicking here. This is a demo version that will not affect the survey results.

    5 Tips from the ‘Our City, Our Choice: Scenarios Exploration’ Survey: Simple call-to-action with informative videos and additional resources

    Nanaimo is a beautiful place and the decision makers care about community engagement and the public’s role in shaping the city’s future. They put together an engaging MetroQuest Survey with many takeaways. Below are just 5 tips from their survey that you can use on your next project:

        1. On the Welcome Screen, the visitors are greeted with an extended background image of the breathtaking scenery of Nanaimo. The positive impression created by the captivating visuals encourages the visitors to continue their survey participation . The positive survey experience results in a higher survey completion rate!
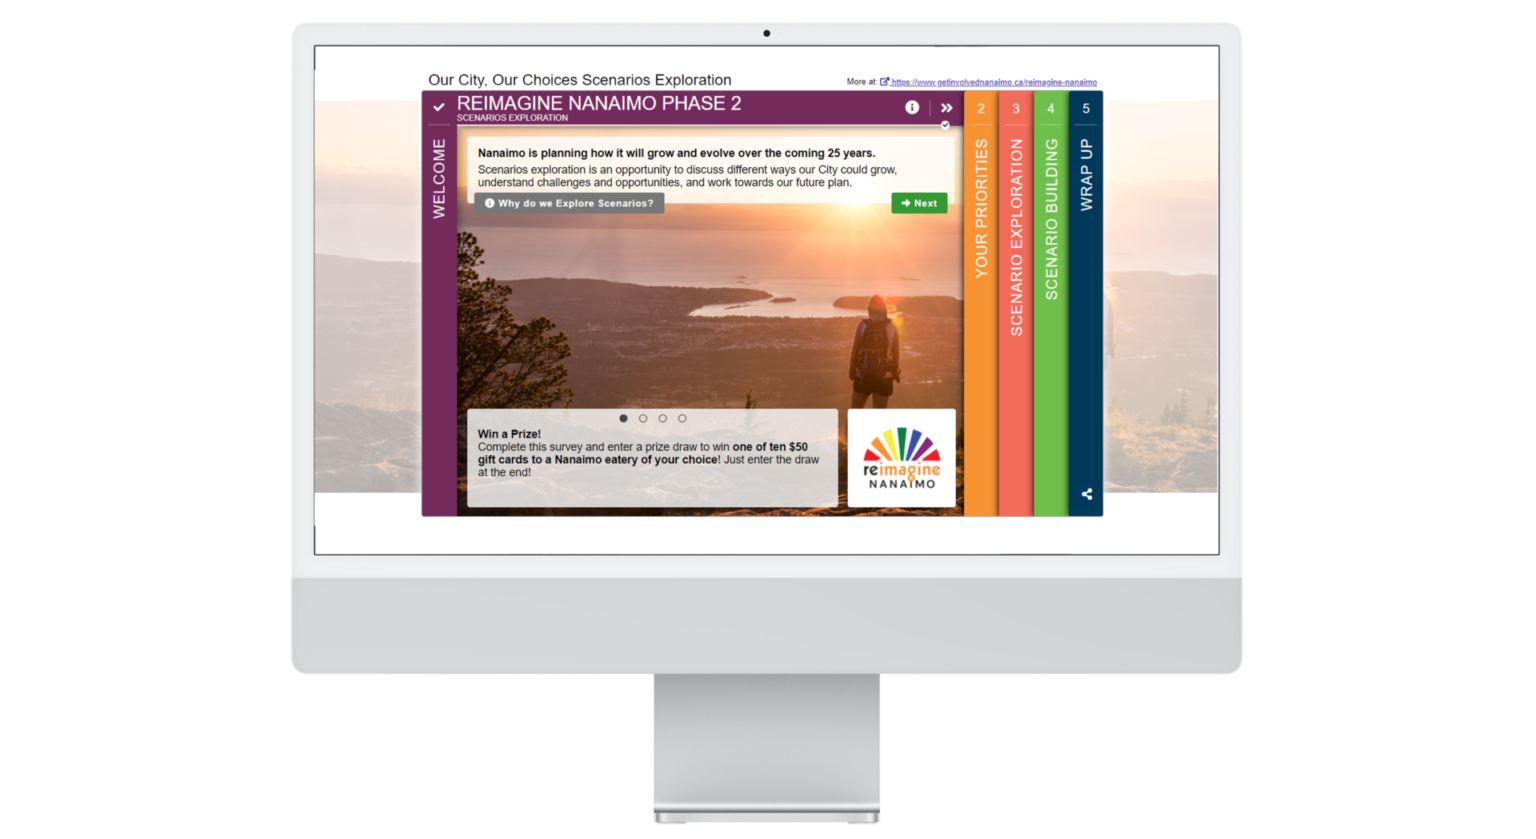
        2. Location-specific survey participation incentive. You may have considered providing incentives for the public to complete the survey in the form of a reward draw for anyone who enters their contact information. LANARC Consultants and the city offer a reward “one of ten $50 gift cards to a Nanaimo eatery of your choice”. It’s recommended to consider using a reward that only community members can use, such as to a local retailer, to avoid ballot box stuffing!
        3. Short educational videos and other resources were presented in the Scenario Rating Screen. You can accommodate different learning styles by providing a variety of resources such as videos, PDFs and images. A study found that the human brain processes an image 60,000 times faster than text. By including visually appealing resources into your survey, participants can process the information and data better and more quickly!
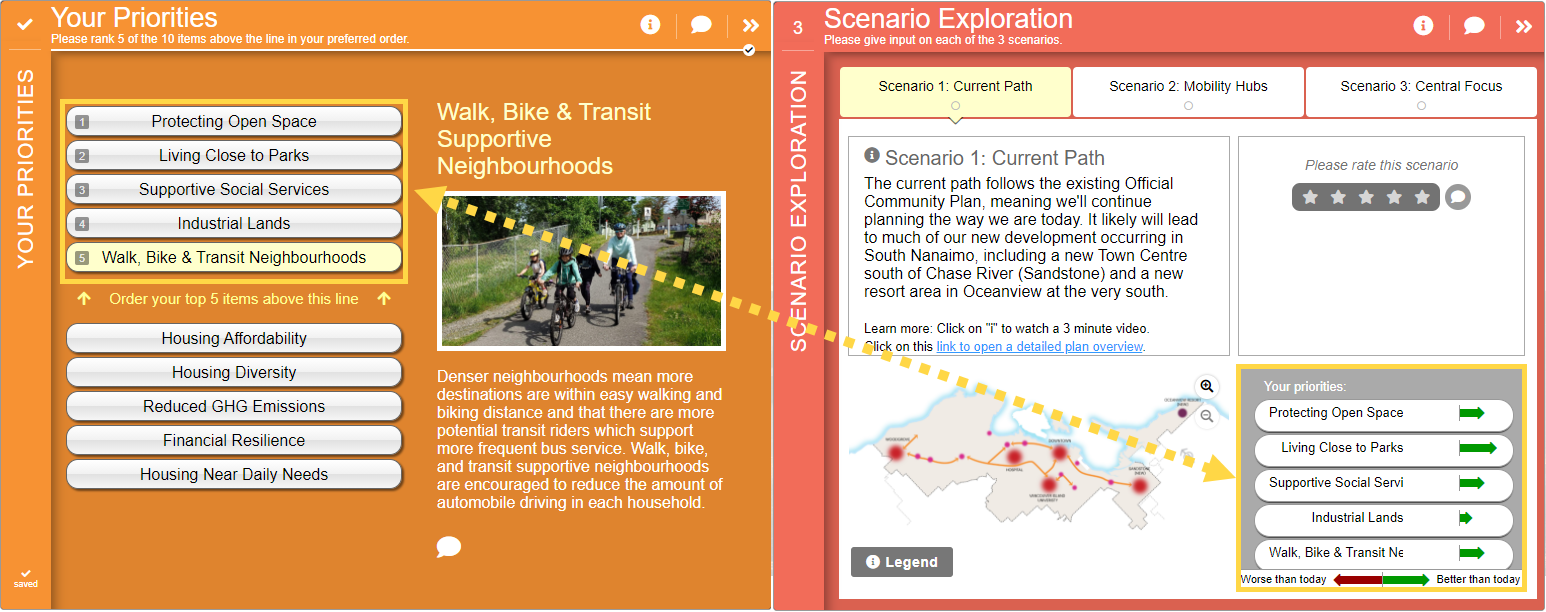
        4. Connected indicators to help participants make informed decisions. Explaining scenarios can be a complex undertaking, making the Scenario Rating Screen one of the more time-consuming Screens. After identifying prioirites in the first screen, connecting the indicators in the scenario exploration screen helps participants understand how various indicators perform on the different scenarios, emphasizing which scenario would likely work better in terms of their selected priorities.
       

      1. Lastly, each marker has easy-to-answer dropdown options on the Map Marker Screen. Participants simply need to click on an option from the list of answers. This reduces the length of the survey and makes it concise, which in turn means more data will be provided. Another advantage of dropdown questions is that they are designed to create easily quantifiable data.

    Congratulations to LANARC Consultants and the City of Nanaimo for an engaging survey using new features and demonstrating best practice for effective online engagement!

    For more great tips on how to make the most out of MetroQuest, contact your Customer Experience manager or reach out for more information!

    Want to learn more about how MetroQuest supports community outreach on your next transportation plan? Check out our recent webinar:

    The Pivotal Role of Public Involvement in the Surface Transportation Bill

    In this webinar, equity and transportation planning experts from Kansas DOT and HDR discuss post-padnemic recovery, the surface transportation bill, and how agencies can prepare a winning strategy!


  • [SURVEY OF THE MONTH] A MetroQuest Survey Identifies Community Priorities for WalkEC, a Comprehensive Pedestrian Plan

    [SURVEY OF THE MONTH] A MetroQuest Survey Identifies Community Priorities for WalkEC, a Comprehensive Pedestrian Plan

    We’re excited to introduce the Survey of the Month: an exceptionally well-done example of a MetroQuest survey created by one of our users. We’re consistently impressed with the amazing public engagement surveys that MetroQuest subscribers launch to gain valuable public input for their plans. We want to share their inspiring work!

    Going forward, every month we’ll show you how one agency or firm put together an outstanding survey and highlight a few takeaways to inspire YOU to create equally engaging surveys!

    This month, we’re thrilled to introduce a Comprehensive Pedestrian Plan for Elizabeth City, in collaboration with MetroQuest subscriber Kimley-Horn and Associates and the North Carolina Department of Transportation (NCDOT). Jonathan Whitehurst and his team at Kimley-Horn created an amazing MetroQuest survey to identify obstacles and solutions to building a more walkable city as part of a strategic plan to stimulate community growth.

    What’s the story behind WalkEC? It’s Elizabeth City’s First Comprehensive Pedestrian Plan

    Elizabeth City’s “Vision 2020” was a community planning initiative that aimed to create economic and community development. Initially, a dedicated committee worked together to create a strategic plan that could guide Elizabeth City’s upcoming developments using data from research and focus groups, reaching all segments of the community. With these, the committee previously recommended that increased sidewalk connections would provide better access to health and social services, trails in nature, parks, and other destinations, elevating Elizabeth City’s ability to serve and support the community.

    As a continuation of this larger community strategy, “WalkEC” is a Comprehensive Pedestrian Plan that will set priorities for new sidewalks, multi-use paths, and street crossings. It will also review policies and programs to ensure that the community can make the best use out of the new infrastructure. Jonathan Whitehurt worked together with Elizabeth City and NCDOT to create the WalkEC MetroQuest survey for this plan, looking for actionable community input that would allow them to identify obstacles and create community-backed solutions!

    Anatomy of a Survey: How WalkEC’s MetroQuest Survey Gathers Actionable Public Input

    WalkEC’s survey has great flow from screen to screen, first identifying how the community prioritizes five themes, then identifying potential obstacles to achieving those goals, and finally creating a space for citizens to safely suggest solutions.

    WalkEC_Rating-Screen

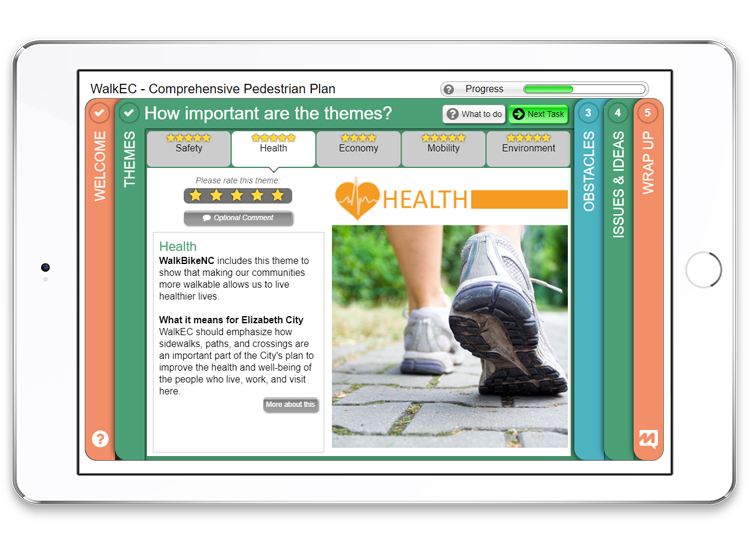
    In more detail, the survey starts by presenting some background information to help provide context and let citizens know how their input will be used: namely, to help ensure that the community will be able to make “the best use of these new investments.” It then dives into the first interactive data collection activity, presenting five themes from the statewide North Carolina bicycle and pedestrian plan, called WalkBikeNC.

    Participants are asked to rate each theme on a 5-point scale and can submit optional comments on each. The five themes are: Safety, Health, Economy, Mobility, and Environment. Understanding how important each of these state-identified themes are to Elizabeth City residents will help shape the pedestrian plan around the topics that are most valuable to them.

    WalkEC_PriorityRanking-Screen

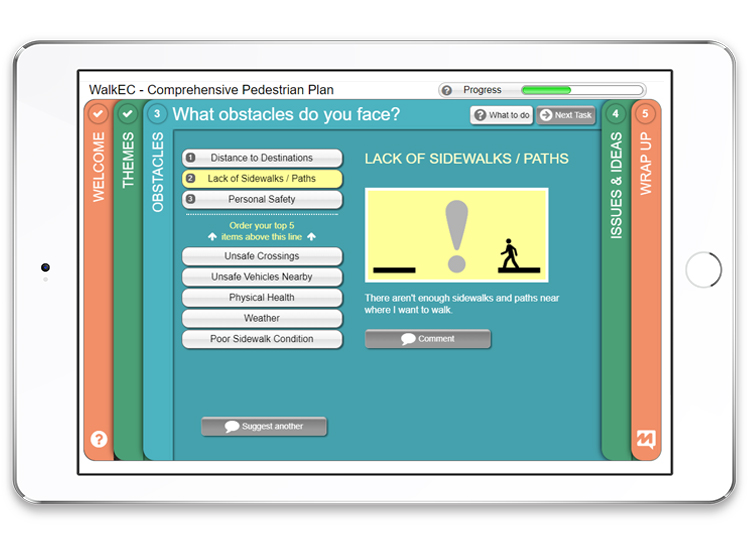
    In the second activity, participants are asked to rank the 5 biggest obstacles that prevent them from walking or from walking more frequently. Because one goal of the comprehensive plan is to help the community utilize pedestrian infrastructure, it is important to the Elizabeth City team to make sure that they identify concerns and attempt to solve them where possible.

    The list of obstacles includes: Personal Safety, Poor Sidewalk Conditions, Lack of Sidewalks/Paths, Physical Health, Unsafe Crossings, Weather, Distance to Destinations, and Unsafe Vehicles Nearby. Understanding obstacles to walking will help Elizabeth City to become safer, more enjoyable, and more accessible.

    WalkEC_Map-Screen

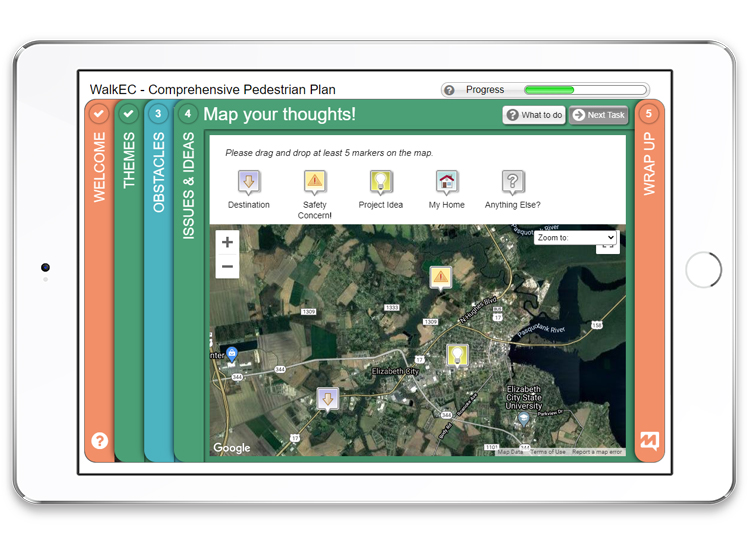
    Finally, before asking a few demographic questions, participants are asked to map their thoughts and show issues and ideas spatially by dropping markers onto a virtual map. Jonathan and his team configured markers that people can use to show the location of their Safety Concerns, Project Ideas, and Destinations, as well as showing where they live (My Home) and providing additional ideas (Anything Else). This survey screen gives participants the option to show exactly where they want more pedestrian infrastructure, where they feel unsafe, and where sidewalks, trails, or crosswalks are needed. By giving participants the option to share these in a clean map (without existing markers that cause bias), Elizabeth City is giving each citizen an equal opportunity to have their voice be heard.

    If you’d like to try a demo of the survey, click the button below. This will not affect Elizabeth City’s survey results, so feel free to click around.

    The accompanying project website can be found here. This survey is currently live, and we are looking forward to seeing great public engagement results!

    5 Tips from Elizabeth City: How to Make an Effective Online Survey for Public Involvement with MetroQuest

    The survey the team created is fantastic in many ways. They made the most out of MetroQuest by translating the goals of their comprehensive plan into an accessible survey that could collect actionable information from the broader community.

    How did they make their survey so engaging? Below are 5 aspects to keep in mind as you build your next MetroQuest survey to ensure that yours is just as successful.

    1. In a brief introduction, convey the goals of your plan and show participants how their input will have impact. There’s no need to go into great detail—that’s what the project website is for—but knowing that their input is valued and will be acted upon will motivate participants.
    2. Use a simple call-to-action so that participants have an immediate and obvious next step. The example WalkEC uses in the introduction screen is simple yet effective: “We want to hear from you!”
    3. Enhance your text with icons and relevant images – it draws the participant in, makes the survey more fun and visual, and encourages the participant to connect to the questions and identify their priorities. For example, the second screen of the survey uses a picture of two children at a crosswalk to illustrate the theme of Safety. Help participants link the concepts in the survey to their everyday lives!
    4. Keep all text short and precise and use simple language instead of jargon. WalkEC is a Comprehensive Pedestrian Plan. While citizens might not know what that type of plan is, they’ll certainly understand that the city is looking to “help ensure our community makes the best use of these new investments.” Follow this rule of thumb in the survey itself, too. For example, when discussing barriers to walking, this survey explains “distance to destination” plainly as “it would take too long to walk from point A to point B.” Simple, everyday language like this helps participants think about their everyday concerns more easily, all the while subtly educating the public and helping you to collect informed input!
    5. Allow for specific and quick answers. Notice that the questions in WalkEC are drag-and-drop or can otherwise be answered in one click! For example, the map uses icons that can be dropped onto different areas, with drop downs that pop up to capture additional information. This makes answering the survey fast and easy, instead of forcing participants to verbalize and type out all their answers. This also makes it easier to aggregate the data afterwards. Win-win!

    Congrats to Jonathan and the entire team at Kimley-Horn & Associates, the North Carolina Department of Transportation, and Elizabeth City for creating a fun interactive experience for WalkEC!

    For more great tips on how to make the most out of MetroQuest, contact your Customer Experience manager or reach out for more information!

    Want to learn more about MetroQuest? Check out our recent webinar:

    Webinar_Optimizing-Planning

    Optimizing Online Engagement for Planning with MetroQuest

    Online tools are a critical part of the planner’s public engagement toolbox, especially as we look for safe, effective methods to engage during the COVID-19 pandemic. Find out which options result in positive, actionable community input for your urban and transportation plans.