[INSIGHTS] Mapping Your Road to Success – Building and Analyzing Map Marker Screens with KMZ

This is one of the most common questions we get from our MetroQuest subscribers as they start building their first MetroQuest survey using the Map Screen: “how can we use maps and map markers to make our data actionable and gain new insights?” In this blog post, we dive into the details to help guide you along this process.
MetroQuest uses decimal degrees for latitude and longitude, the same as Google Maps, for all our mapping screens. We highly recommend using Google Maps as your reference in all Map Marker Screen preparation, both for coordinates and for zoom levels. A zoom of 1 will show the entire earth, while a zoom of 20 will show a single intersection. We tend to use a zoom of 12-14 to show detail, while still covering a specific community. However, this is dependent on the scope of your project and how wide of a map view you’d like to make visible. Participants can always zoom in or out further while filling out your MetroQuest survey, but the base map view gives a frame of reference and an idea of the survey’s scope.
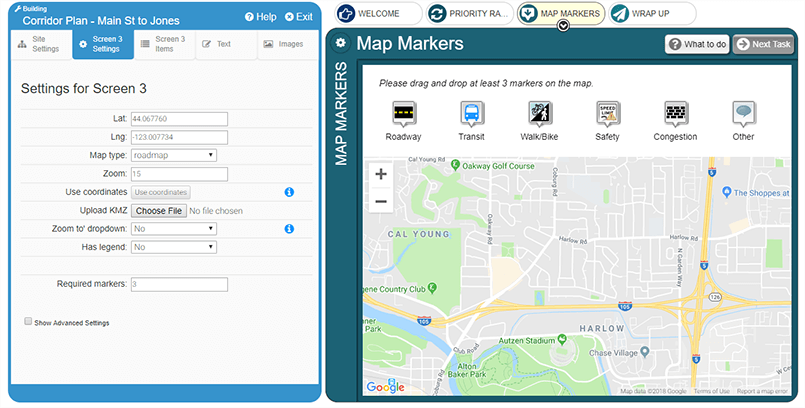
At MetroQuest we have dozens of pre-created Map Marker icons for customers to apply to their mapping screen. This will help participants understand what kind of data you’re asking for. During your data analysis, it will help you isolate specific areas of interest from the rest of the data.
Do you need ArcGIS to make a KMZ layer? The short answer is no. However, if you’re using ArcGIS you will need a trained user. KMZ files can also be made quickly and easily using Google Earth Pro, a free online resource that anyone can download.
The KMZ file must be under 10MB and have less than 1,000 individual features (that is, individual lines or shapes). We have video guides available for our subscribers, which review every step for creating these files. We’d like to note that KMZ’s are a reference layer that sit on top of the map and provide the participants with background about the study area, existing features, or anything else you’d like to highlight!
Participants cannot interact with the KMZ, but they can drop markers on top and around it in your MetroQuest survey. Common KMZ layers added by our customers depict existing bike or bus routes, city limits, major roadways or intersections, peak accident zones, or proposed development areas – you can add whatever elements your project demands.
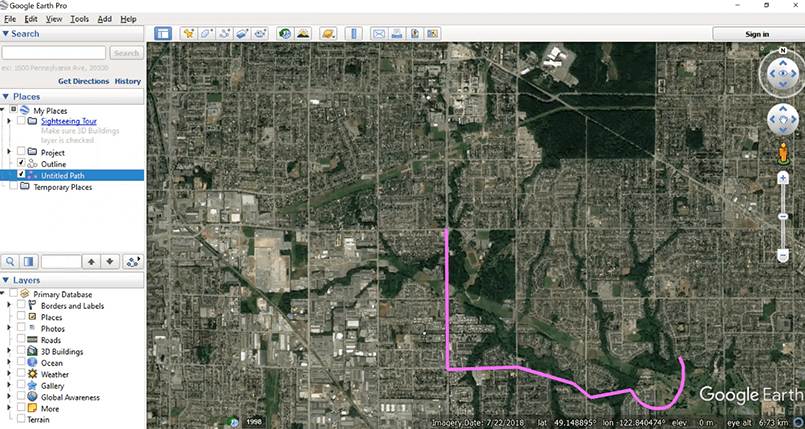
If you’re using an ArcGIS specialist to create a KMZ layer, I suggest that you still upload your file to Google Maps online and explore how the map looks. This is because ArcGIS and Google Maps anchor their points slightly differently, and you’ll want to ensure your map looks exactly how you want participants to view it.
Once your survey has been completed by participants, you can export spreadsheets from the MetroQuest Data Center that are pre-formatted with all the data points you will need to analyze your mapping results … ready for import into ArcMap or Google Maps.
Google Maps
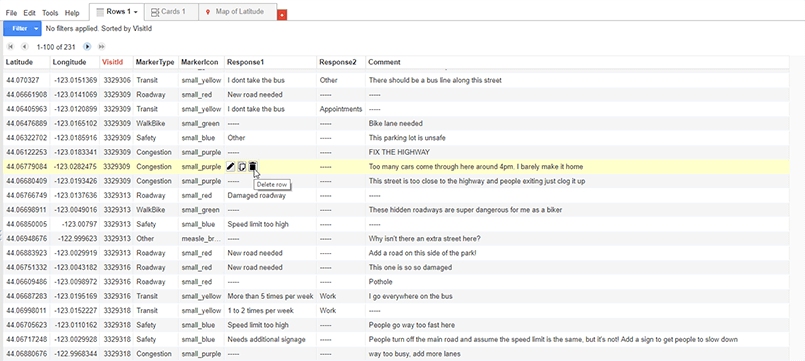
To import your results into Google Maps, you’ll use the Fusion Table export from the MetroQuest Data Center. Using Google Drive in the Fusion Tables online app, you can upload the file and immediately see the full data set in the table and map view. From the table, you can review and edit the dataset as needed, including deleting rows that aren’t applicable to your current project.
Using the map view in Google, you can filter the map by marker type to look for trends and patterns. Markers are shown in different colors to indicate different marker types, and you can find more detail about each marker by clicking on any of the points.
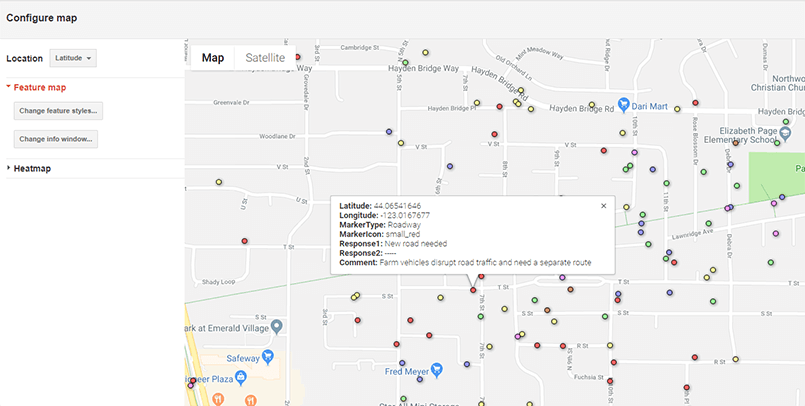
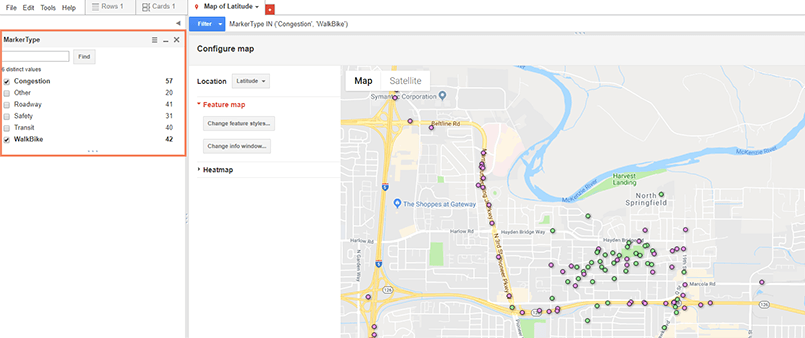
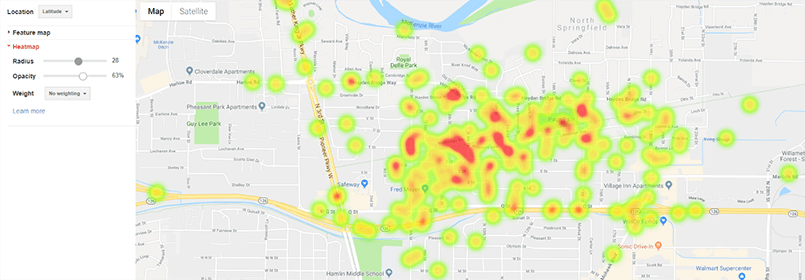
Once the data is in Google Maps, you can view it either in points or in a heat map! You can choose how you want the data presented, filter entries or data fields, and then publish the map exactly how you want it to be viewed.
Publishing and sharing the map online allows people who do not have access to MetroQuest Studio to review the Map Marker data. This can be done using the sharing options, and either selecting share by link or making the map publicly available to all. By making the map public, you can then embed the map into your website, in an email, and more. In my opinion, Google Maps is the best sharing tool, whereas ArcMap is the ideal for deeper analysis. If you want to do a deep dive and share a map, you can always use ArcMap for the analysis and then export those findings into Google Maps for sharing purposes.
Do you want to experience this sample Google Map firsthand? You can explore the shareable point map here, or the heat map version here!
ArcGIS/ArcMap
To export data into ArcMap, you’ll use the Screen Data spreadsheet download from the MetroQuest Data Center. In ArcMap, you’ll use the Import XY Data feature and select the columns that have latitude and longitude as your reference. From there, you can include comments, answers to questions, and marker types as additional fields in the attribute table. Analysis in ArcMap is incredibly versatile. I strongly recommend using any ArcGIS technicians or specialists to do your analysis in this software.