[SURVEY OF THE MONTH] Developing a Data-Driven Decisions Tool with Illinois DOT

The Survey of the Month series is a monthly blog where we highlight the extraordinary work our customers are doing, along with some takeaways that are relevant for anyone interested in making the most out of online engagement using MetroQuest’s survey platform! To see more in the series, visit the blogs here.
This month, we highlight a recent survey from Illinois DOT (IDOT), created by WSP, who has used MetroQuest to create excellent surveys for a variety of projects. The focus here is on IDOT’s new Data-Driven Decisions Tool initiative. This initiative aims to ensure that resources are invested in a fair, equitable manner, prioritizing projects that meet the goals of the department and its constituents. By collecting feedback through a MetroQuest Survey, IDOT gathered input on evaluation criteria and resident priorities to inform development of the Data-Driven Decisions Tool.
What’s the story? Inclusive Data-Driven Decisions Tool for Capacity Projects
This past spring, House Bill 253 was passed by the General Assembly and signed by the Governor. The legislation builds upon federal asset management requirements for roads, bridges and transit, supporting the public in understanding how projects in their communities will impact safety, quality of life and ability to access economic opportunities.
Starting in 2022, IDOT will be required to evaluate any new capacity projects based on a selection process that weighs a variety of factors, such as improvement of traffic operations, economic development, livability, environmental impact, and safety. To support this, IDOT is developing a Data-Driven Decisions Tool that will be used in the Rebuild Illinois capital program, the most extensive capital program in state history.
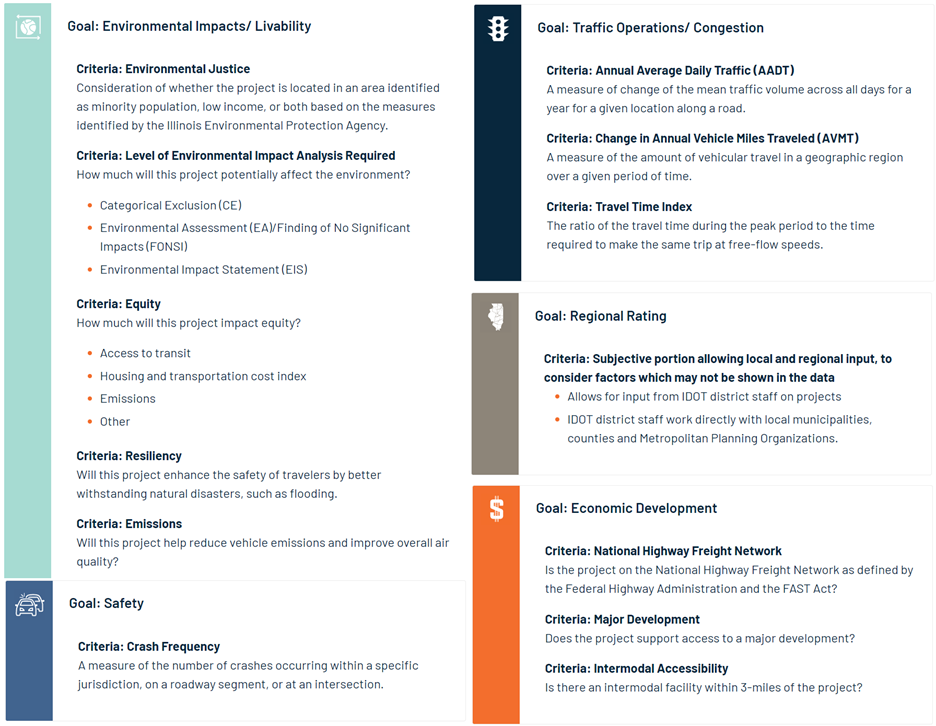
Initial themes of the Data-Driven Decisions Tool were identified through the Long Range Transportation Plan (LRTP) documents created in 2017. The LRTP provides innovative, sustainable and multimodal transportation solutions that support local goals and grow Illinois’ economy. After significant public outreach, they identified five overarching goals: Economy, Livability, Mobility, Resiliency and Stewardship.
Based on these themes, they developed five goal areas with thirteen evaluation criteria:
IDOT sought public input on metrics and priorities that will guide the development of an inclusive Data-Driven Decisions Tool. By gathering this feedback through a MetroQuest Survey, IDOT will be able to understand resident preferences, and most importantly, where those residents are located. Survey data will allow IDOT to weigh priorities and geographically target different transportation needs across Illinois, and eventually ensure efficient, effective, transparent and fair implementation of the Rebuild Illinois capital program.
For more information, please visit the IDOT website.
Anatomy of a Data-Driven Decisions Tool Survey: Increased Transparency in Project Selection Process
By developing the Tool through a MetroQuest survey, IDOT has the opportunity to develop metrics and priorities guiding the decision-making process. Moreover, the inclusion of public input through the survey helps them implement a truly inclusive framework for their projects by including feedback from people who use the transportation system.
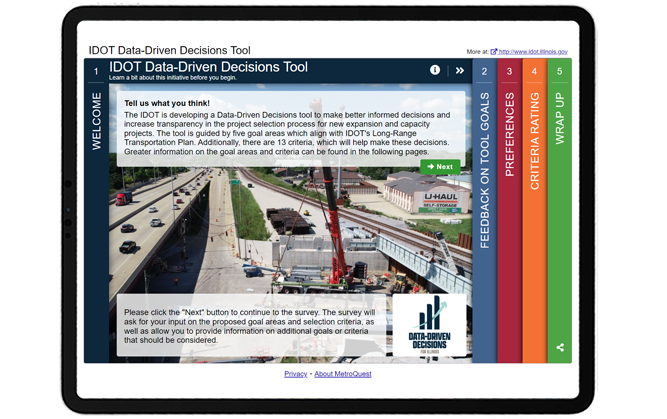
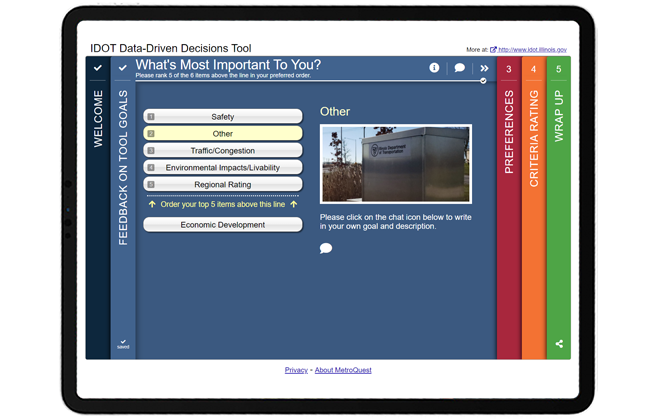
After the Welcome Screen, the Survey uses a Priority Ranking Screen to share six priority items. These items include the five goal areas identified through the LRTP process as shown in the graphic above, and an “Other” category to allow visitors to suggest another goal area that they believe IDOT should consider.
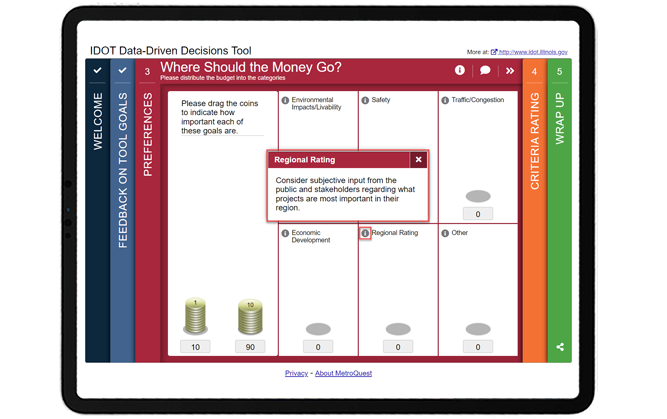
Next, the Budget Allocation Screen is utilized to ask participants to distribute 100 chips to give more weight to the six goal categories they deemed the most important in the previous activity. This Screen also offers visitors another chance to provide input on what is most important to them, similar to the Priority Ranking Screen.
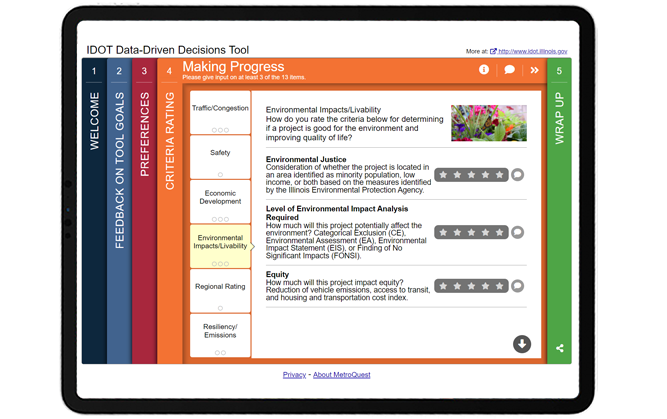
On the following Strategy Rating Screen, visitors are presented with the five goals and thirteen evaluation criteria initially developed by IDOT, based on existing plans, guidance from state and national experts, and best practices of peer states. With that being said, IDOT believes that the feedback from the public is critical to the finalization of the Data-Driven Decisions Tool. They included a short description under each criterion to inform the participants and provide context before they give input.
You can try the IDOT Data-Driven Decisions Tool Survey here. This is a demo version that will not affect the survey results.
5 Tips from the Data-Driven Decisions Tool Survey: A Simple Survey with Quantitative and Qualitative Questions
The IDOT Data-Driven Decisions Tool Survey consists of simple interactive activities with easily quantifiable data. Below are 5 takeaways from their survey that can help you when designing your next MetroQuest Survey:
- On the Priority Ranking Screen, only six priorities, the five goal areas and the “Other” category, are presented to the visitor. Keeping your content to a minimum will keep your visitors captivated and encourage them to complete the survey. It is recommended to design your survey to take no more than five minutes to complete. Studies show that shorter surveys have a higher completion rate.
- On the Priority Ranking and the Budget Allocation Screens, visitors are also given an option to provide a written response on what is important to them, on top of the presented goal areas. While the activity around distributing chips collects quantitative data, adding a separate category labeled “Other” for the written response allows for the collection of qualitative data. Studies found that a blended research approach results in a better understanding of the topic on different levels, supporting both prioritization and exploration.
- On the Budget Allocation Screen, the team utilizes the “Details” popup to include more comprehensive information about each category so that participants can make an informed decision on where they would spend the funding and investment. The gamified experience strengthens the idea of funding prioritization for participants, illustrating options as well as limited resources.
- Visitors are only presented with thirteen evaluation criteria on the Strategy Rating Screen, no more or less. The category descriptions are short and to the point for maximum appeal and ease of use. Like other screens, they also provided the additional comment bubble for visitors to provide more insightful input on each criterion.
- One of the demographic questions asks which district they live in, District 1 to 9. The survey team effectively used a hyperlink to IDOT’s website, where a map image shows the district areas. This ensures that participants select the correct district as they can confirm their location on the official map.
Congratulations to the team at WSP and IDOT for delivering a survey that will help build a truly inclusive Data-Driven Decisions Tool for future projects!
For more great tips on how to make the most out of MetroQuest, contact your Customer Experience manager or reach out for more information!
Want to learn more about how MetroQuest supports community outreach on your next transportation plan? Check out our recent webinar:

Forum on Measuring Public Involvement Effectiveness for Transportation Agencies
In this interactive webinar forum, public involvement leaders from TxDOT, NCDOT and GDOT share how agencies can ensure that their public engagement programs are an effective and efficient use of public resources!