[SURVEY OF THE MONTH] Planning for Safe, Equitable and Efficient Movement Across Greater Portland

The Survey of the Month series is a monthly blog where we highlight the extraordinary work our customers are doing! We feature well-designed surveys and share takeaways that are relevant for anyone interested in making the most out of online engagement using MetroQuest’s survey platform. To see more in the series, visit the blogs here.
When it was time to update their Regional Transportation Plan (RTP), Oregon Metro utilized MetroQuest to launch a survey that engaged over 1,300 people. For this month’s feature, we dive into their survey that effectively gathered thousands of data points! Keep scrolling for inspiration on what you should include in your next project webpage and how to design a survey that seeks input on a wide range of topics.
What’s the story? Engaging 1,300+ on Movement in the Region
Oregon Metro launched the 2023 RTP survey to gather input to inform the broader goal of improving transportation in greater Portland, an area estimated to grow to over two million residents by 2045. As with most transportation plans, this process will guide future investment for all modes of travel: driving, transit, biking, walking, and the movement of goods and services.
Updating the plan creates an opportunity for the region to come together to address these key questions:
- What do we need most from our transportation system–now and in the future?
- How do we pay for new projects while taking care of our existing roads, bridges, bikeways, sidewalks and transit services?
- How should we measure progress toward our climate, safety, equity and mobility goals?
The project team promoted the survey through the project webpage, a public notice, email lists of interested parties, advisory group lists and social media. They also utilized connections with public involvement staff at partner jurisdictions and community-based organizations to spread the word about the survey.
When launching a survey, it is essential to consider where you will host the survey link. The 2023 Regional Transportation Plan project webpage serves as an excellent starting point for those wishing to provide input. We always recommend including the survey link and project information on a project webpage or website for several reasons:
- It provides a place to present content about the project before and after the survey closes and can serve as a place to continually update the community.
- It provides legitimacy to your survey and brand recognition.
- As surveys alone are not findable on search engines, it increases the chance of people finding your survey via an online search.
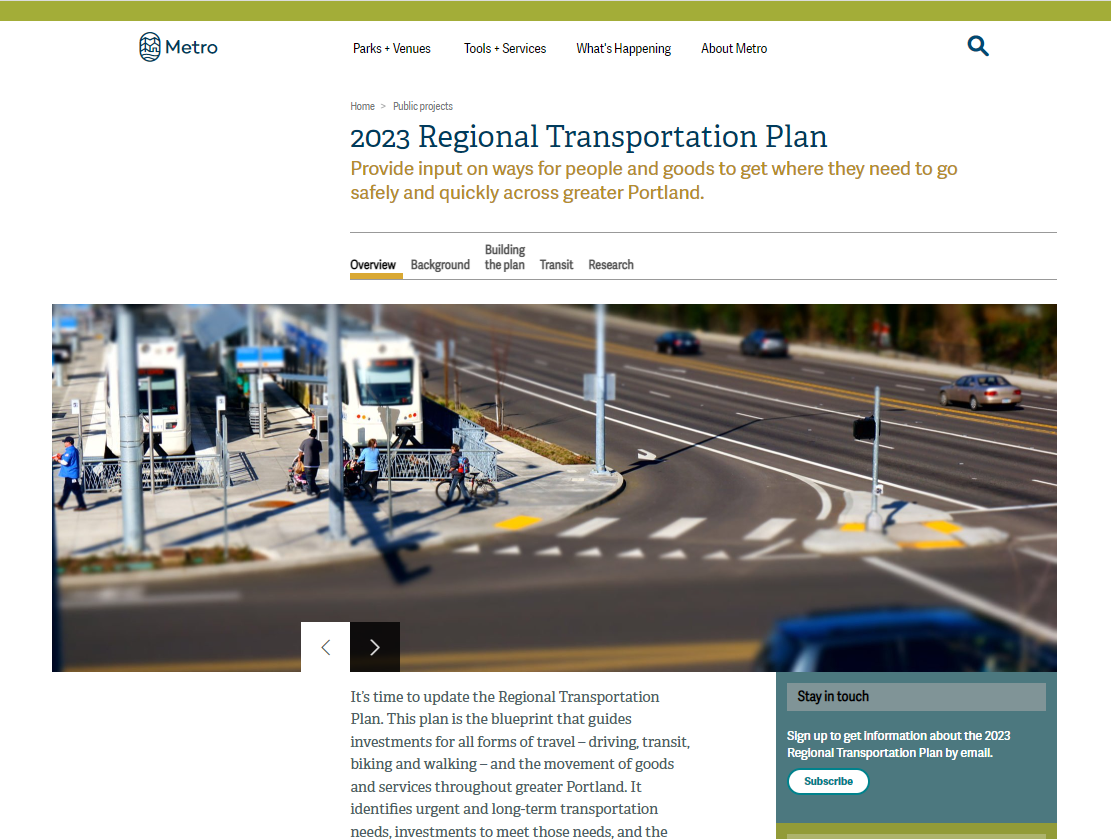
2023 Regional Transportation Plan webpage
Email distribution lists can be extremely effective when engaging the public, especially for multi-phase engagement projects. The inclusion of the “Stay in touch” section pictured above on the right sidebar ensures that those interested in the project are easily reachable for future engagement phases.
To help provide a full picture of the planning process, consider including a timeline for the project phases and engagement activities, such as the one from Oregon Metro’s webpage below.
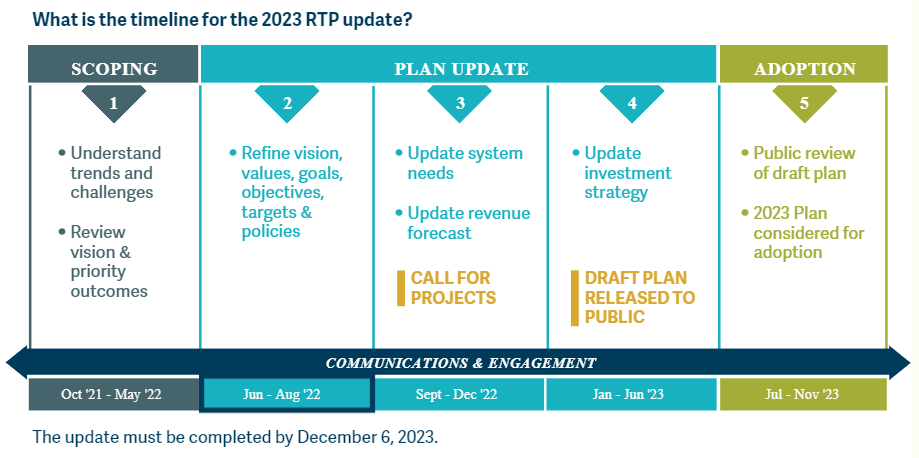
Project timeline showing five phases: Scoping (1), Plan Update (2-4), Adoption (5). The project is currently in the second phase of the plan update: refine vision, values, goals, objectives, targets and policies.
Visit the 2023 Regional Transportation Plan webpage to see an excellent example of a well-designed project webpage and for more details on the planning process.
Anatomy of a Regional Transportation Plan Survey: Shaping Future Regional Transportation
For their RTP, Oregon Metro was looking to gather quantitative data on transportation challenges, changes pre- and during the pandemic, as well as opinions on the future vision and goals.
Follow along as we go through the Screens utilized and highlight some unique details about this survey:
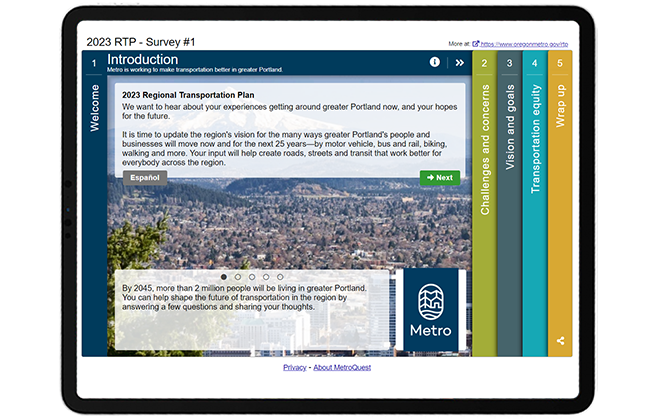
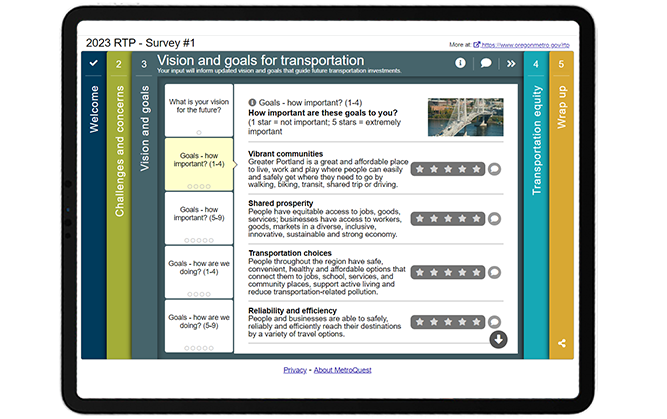
Screen 1: Welcome
Participants are welcomed with an aerial shot of the greater Portland area that blends seamlessly with the navy-blue project branding. The description on this Screen immediately identifies the purpose of the survey and how input will be considered, while the sliders at the bottom highlight key facts and details.
Screen 2: Strategy Rating
Starting on a practical note, the first Screen is a Strategy Rating Screen which features several tabs divided into three topics:
- Transportation challenges (part 1 and part 2)
- Travel before COVID-19
- Travel during COVID-19
In situations where there is a lot of information to gather, the Strategy Rating Screen can be used for more than just strategies. This one Screen allows the team to gather 23 individual quantitative data points per participant without making the survey appear too long or challenging.
We also like how the team clearly defined the rating scale at the top, which is an excellent idea, especially if you are using different rating scales on different tabs of the same Screen.
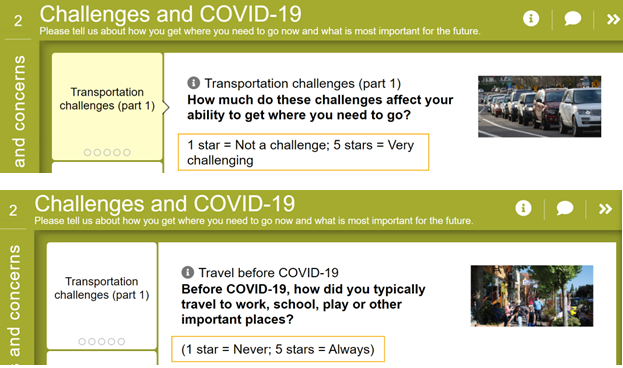
Images showing Strategy Rating Screen with the rating scale explained.
With the Strategy Rating Screen, you have the flexibility to use five stars or thumbs up/down.
![]()
You also have the option to include a comment bubble for each statement so participants can provide their reasoning or ideas.
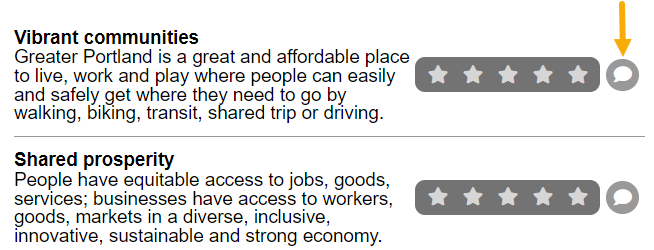
Image showing the Strategy Rating Screen with the optional comment box next to the five-star scale.
Screen 3: Strategy Rating
Screen three continues with the Strategy Rating format but includes more detailed statements describing the vision for transportation in the region and a series of nine goals. Participants are asked to rate how important each goal is to them, and their perception of how effectively Oregon Metro is achieving each goal.
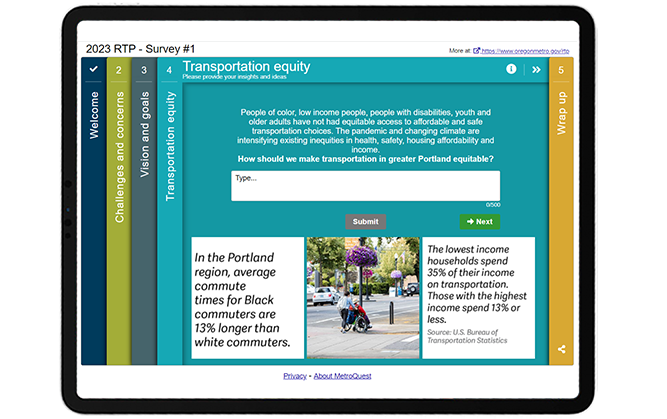
Screen 4: Vision Statement
Diverging from the quantitative format, the fourth Screen uses the Vision Statement format to pose a question about how Oregon Metro should make transportation more equitable. The Vision Statement screen gives participants the opportunity to answer the question in free form, sharing their opinion with the agency. The question is framed with details and data regarding the current situation of inequality and how the pandemic and changing climate are intensifying existing inequalities.
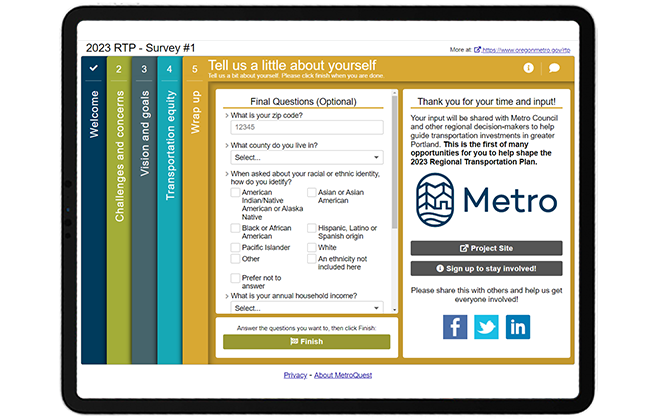
Screen 5: Wrap Up
This leads us to the final Wrap Up Screen where the project team gathered specific demographic data to ensure they engaged a diverse audience.
The Wrap Up Screen of this survey follows many best practices:
- Participants are greeted with a thoughtful pop-up statement explaining why the information is being collected:
Thank you for sharing what is important to you. These next few questions are optional but are important as they will help us determine whether we are hearing from a representative group of people reflecting the region’s diverse communities and broad range of experiences.
- All questions are quantitative and most utilize a dropdown format. Dropdown questions ensure your participants select one option out of a pre-set list, allowing you to quantify the results. (Tip: use census categories when asking about age, income and other demographics so you can compare your data with local census statistics.)
- Additionally, project next steps are outlined, the project site is linked, and there is an option to sign-up for the project email list.
As with many MetroQuest surveys, the Wrap Up Screen contains a zip code question. This question takes advantage of one of our latest Data Center features, the zip/postal code heat map! The data can be aggregated based on participant input, and generate a graphic, below, which shows that for this survey, most participants were in the Portland area. With a closer zoom, you can see specific areas to identify who you have engaged and better target areas that are underrepresented.
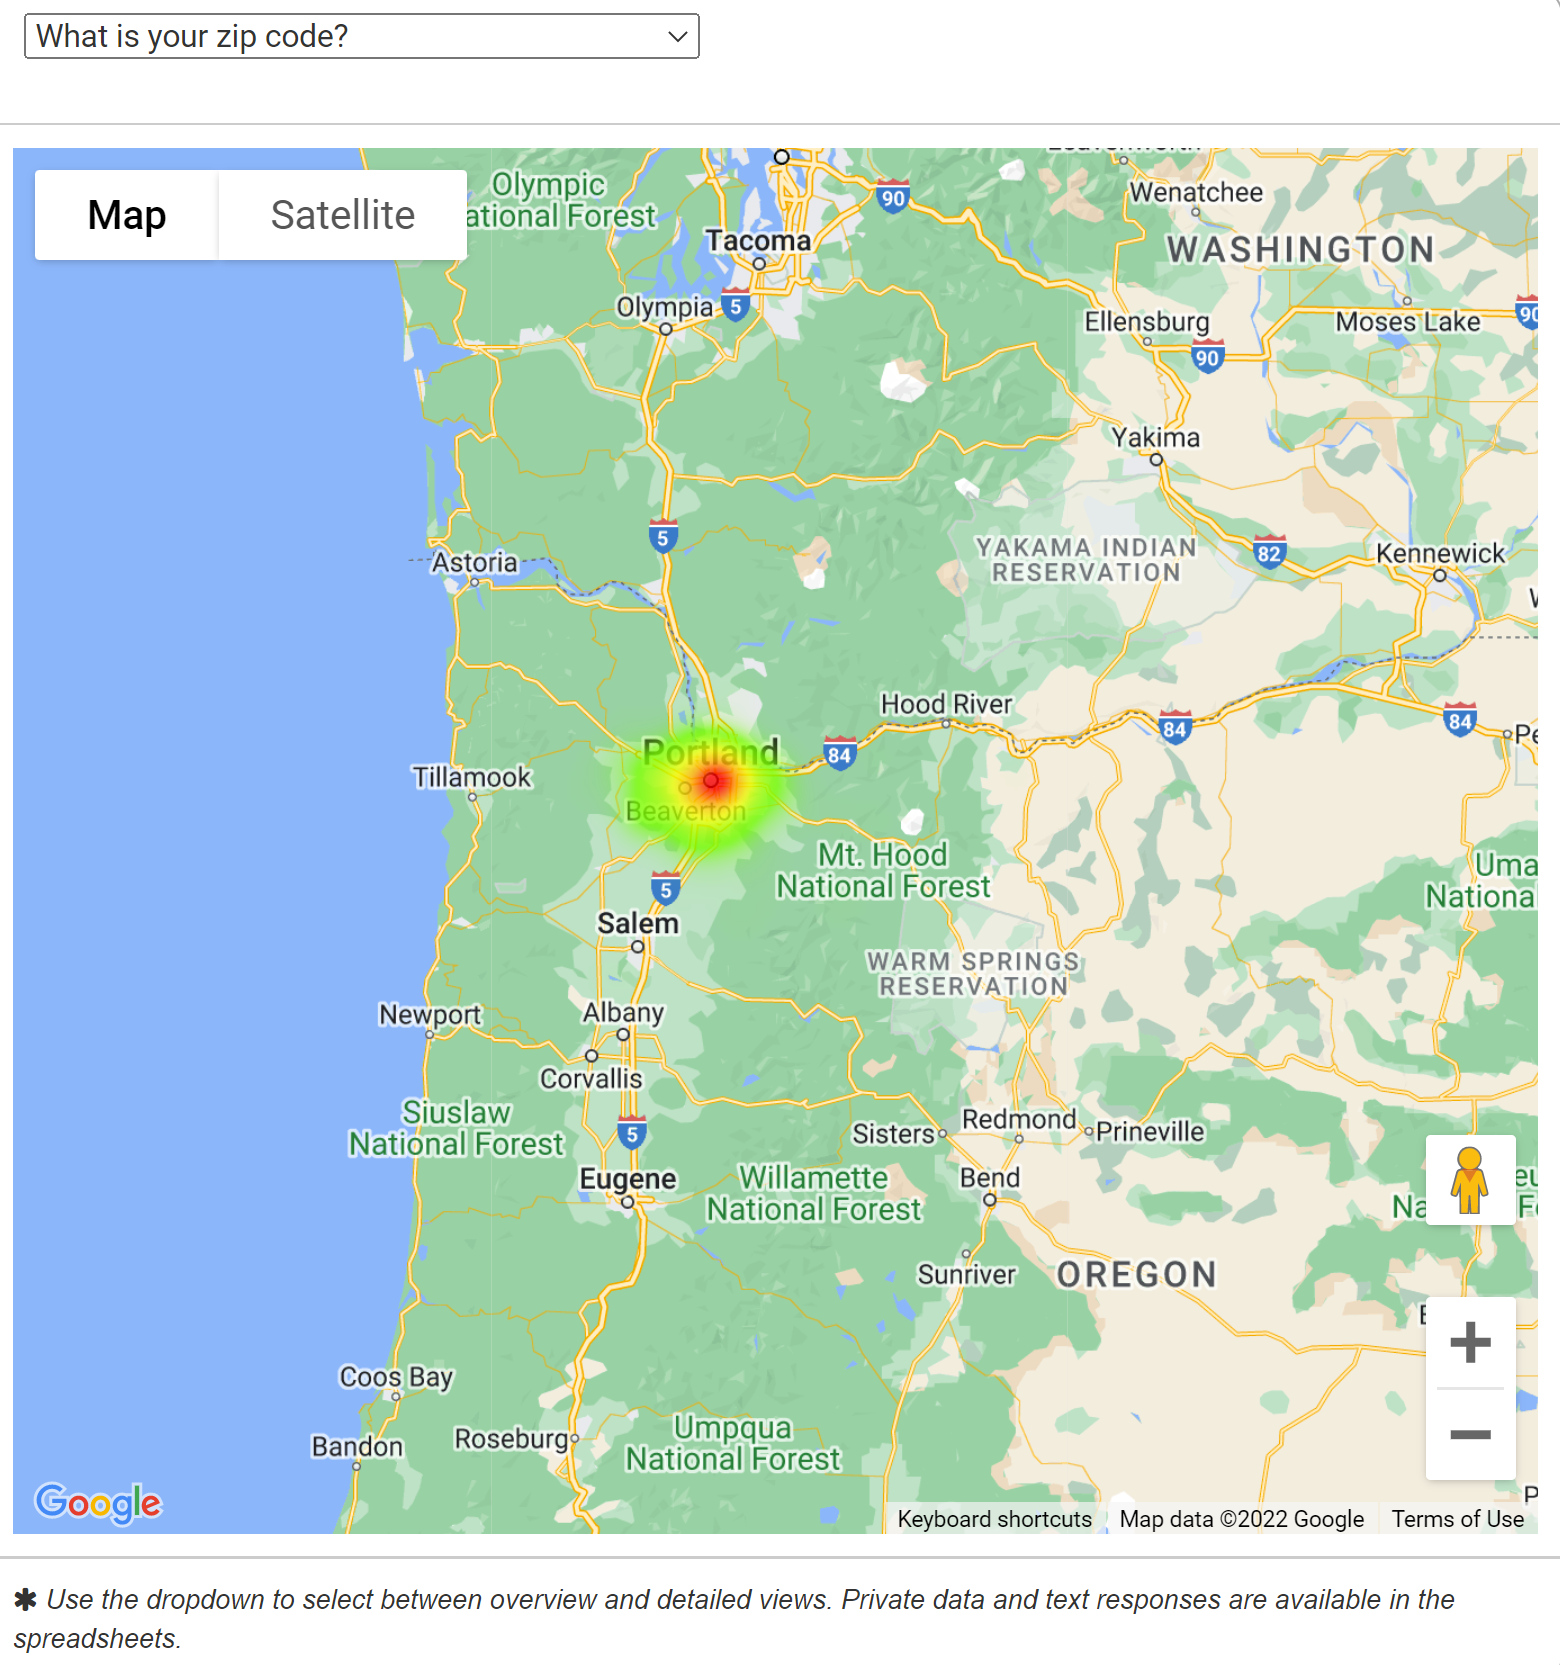
Heat Map showing the results from the zip code question.
Following these Wrap Up Screen best practices will ensure that your survey is backed by quantifiable and informative demographic data. Whether you are trying to reach a diverse audience or a specific group, being thoughtful about demographic data collection goes a long way and is an essential part of an engagement initiative.
Fill out this demo version of the 2023 Regional Transportation Plan survey to learn more about this initiative and experience the survey format.
5 Tips from Oregon Metro’s Regional Transportation Plan Survey: Remember to Think About Your Survey’s Online Presence
- Develop a website or webpage to house your survey: As outlined in the first section of this post, this survey benefited from an engaging, visual and extremely informative project website. For ongoing projects such as this, it is very important to have a location where the community can learn about the project status and establish a place to post information once input has been considered.
- Be transparent about the plan, purpose of the survey and timeline: Creating an engaging and informative project webpage takes time but is always worthwhile. By providing more details on the planning process, timeline, public engagement plan, and how input will be incorporated, the community is more likely to take the time and effort to complete your survey. They will also be more honest and careful with their answers if they feel their opinions matter. Plus, sharing more background information on the website than in the survey allows your survey to remain simple, visual and to the point.
- Utilize the Strategy Rating Screen when you need to gather a large amount of information: It is always best to keep your survey quick to complete, with only the questions that are necessary to gather input on your plan. Where that is not possible, we recommend checking out our Strategy Rating Screen as you have the option to separate strategies in up to eight tabs. If your statements can be complemented with images, consider our Image Rating Screen for a more visual approach.
- Provide additional instructions for complex rating scales: If you are using the Strategy Rating Scale, it is best to be consistent with your statements so the same rating type works for everything. In unique cases like this survey where questions require different rating scales, include a clear disclaimer upfront to define the rating scale being used.
- Consider where you will benefit from qualitative feedback: It takes time to analyze qualitative feedback and can be difficult to summarize it when you receive 1,000+ responses, but there are plenty of benefits in collecting qualitative input. Incorporating a Vision Statement Screen provides an opportunity to gather focused qualitative data on a certain topic without exhausting participants with endless comment questions throughout the survey.
Congratulations to the team at Oregon Metro for a superb survey! It is always great to see a well-designed survey complimented by an excellent project website and engagement plan.
For more great tips on how to make the most out of MetroQuest reach out for more information or, if you are an existing subscriber, contact our Director of Client Services, Norma Hogan.
To learn more about how agencies like Tennessee DOT and Memphis MPO coordinate their public engagement efforts, check out our most recent webinar!
Exploring TDOT and Memphis MPO’s
Next Level Public Involvement Strategy
In this webinar, we will highlight how local and state agencies are working together to engage the broader Tennessee community with a deep dive into the Memphis MPO’s Regional Transportation Plan, Moving Together 2050!