[SURVEY OF THE MONTH] Shaping the Transportation Future of the Memphis Area

The Survey of the Month series is a monthly blog where we highlight the extraordinary work our customers are doing! We feature well-designed surveys and share takeaways that are relevant for anyone interested in making the most out of online engagement using MetroQuest’s survey platform. To see more in the series, visit the blogs here.
This month, we are sharing a long-range transportation plan initiative led by the Memphis Urban Area Metropolitan Planning Organization (MPO) for the Mid-South Region, an area spanning southwestern Tennessee and northwestern Mississippi.
The Moving Together: 2050 Regional Transportation Plan (RTP) sought feedback on future transportation priorities, broad ideas and potential enhancements with the goal of improving overall transportation conditions in the Mid-South Region.
The team launched a MetroQuest survey at the start of 2022, and it demonstrated clearly that a survey can be quick to complete yet still collect thousands of data points to inform future planning. Every day we are bombarded with constant notifications and information from social media, traditional media, family, friends, and work. Today, surveys must compete with a ton of other priorities. That’s why MetroQuest’s fun, interactive surveys are so effective at turning initial visitors into actual survey participants.
Below, we will showcase why the Moving Together 2050 RTP Survey was such a great example of an easy-to-digest format that still collected key feedback by engaging over 500 people!
The secret? A fun, engaging survey and a well-thought-out outreach strategy.
What’s the story? Engaging the Region about Transportation Goals, Objectives and Priorities
The Moving Together: 2050 RTP is the Mid-South Region’s plan for defining the vision of future transportation in the region. To ensure that recent trends and priorities are reflected in the plan, the RTP is updated every four years.
The MetroQuest survey was launched on January 6, 2022 and remained open for input until February 11. It gathered a mix of qualitative and quantitative feedback from over 500 participants!
Before the release of the survey, the MPO had developed an extensive outreach campaign that was aimed towards getting higher engagement and participation levels, as compared to their past outreach efforts. Due to the online nature of the survey, special attention was given to the development of social media and other online content for sharing, with the primary focus to make the information catchy and interesting. Beyond sharing the survey through daily posts on the MPO’s social media accounts, the MPO also:
- Partnered with its member agencies, which in turn shared the MPO’s postings on their social media accounts;
- Featured the survey in local agency newsletters;
- Distributed posters with a QR code to the survey to the major libraries and community centers;
- Added a website pop-up notification with a survey link;
- Promoted the survey on the Nextdoor App, a new tool that had not been used in past efforts.
See below for some examples of the social media posts shared by Memphis MPO and partner organizations during the engagement process.
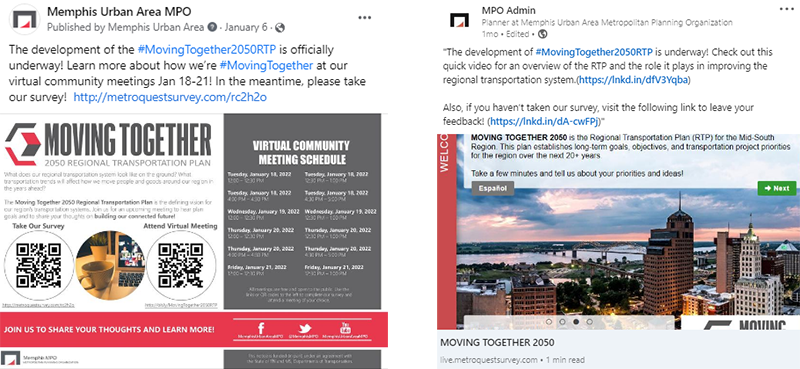
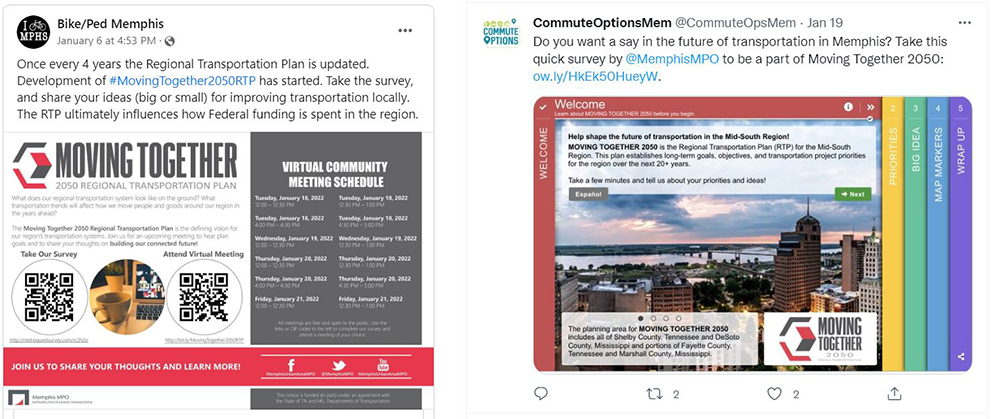
Example social media posts on Twitter, Facebook and LinkedIn
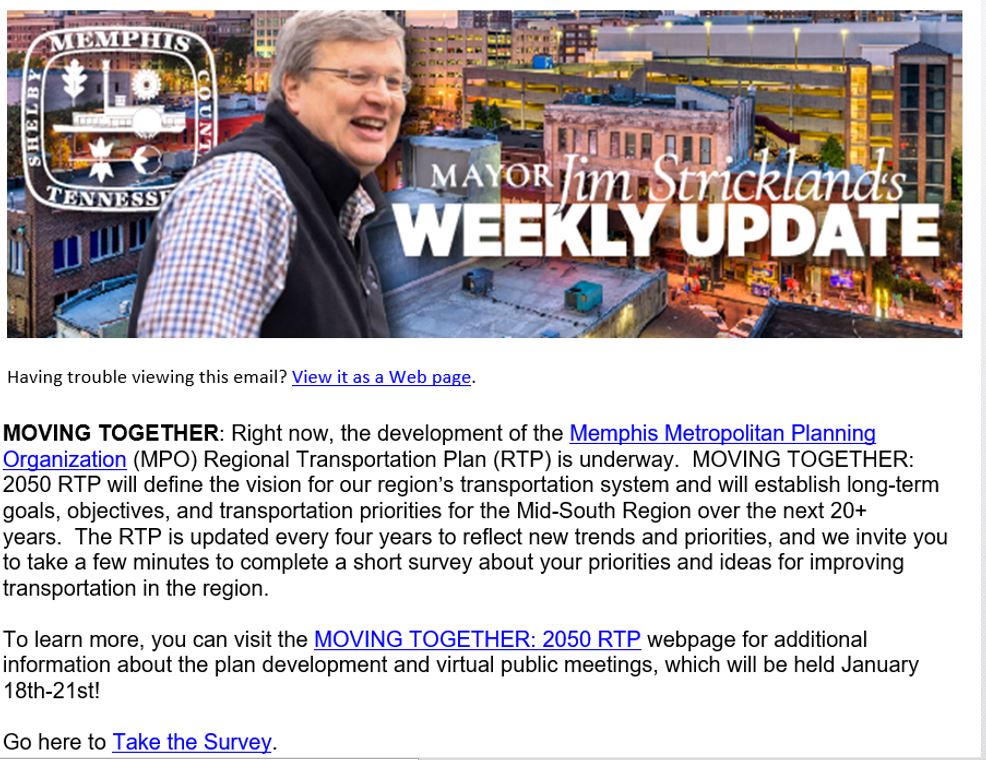
Inclusion in the Memphis Mayor’s Newsletter
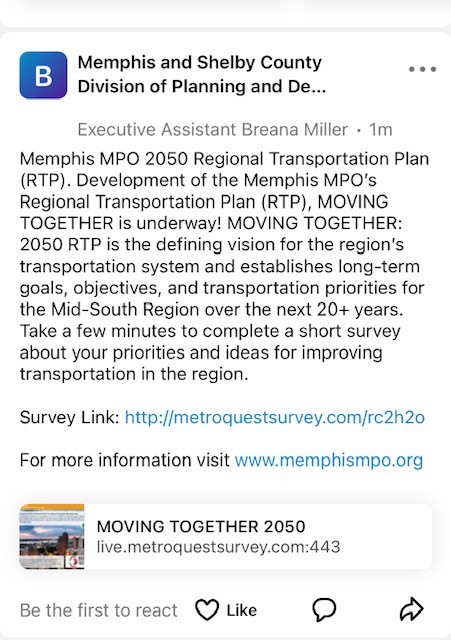
Post on Nextdoor App
This campaign strategy exemplifies how a well-planned, comprehensive outreach campaign is key to ensuring your survey reaches your audience and engages hundreds, if not thousands, of participants and gathers the input you need to move your project along.
To learn more about this initiative, visit the Moving Together: 2050 Regional Transportation Plan webpage.
Anatomy of a Regional Transportation Plan Survey: Gathering key input to help the region continue moving together!
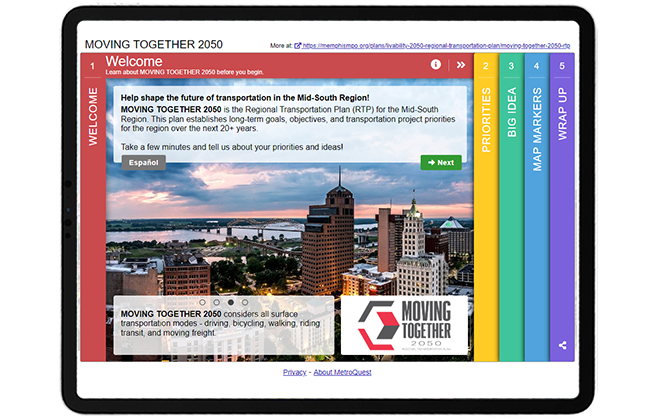
Right away, the survey draws visitors in with a colorful scheme and captivating Welcome Screen image. This first Screen also features many other key items we recommend: a brief project description, a well-designed project logo and a link to the alternate language version of the survey. You’ll notice that the Screen quotes “a few minutes” for the length of the survey, indicating right at the start that this survey won’t take too long. For the best participant experience, we recommend aiming to create surveys that take approximately 5-minutes to complete.
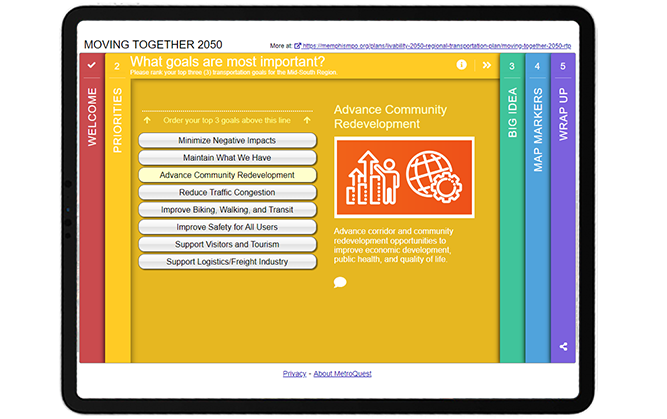
As with many MetroQuest surveys, the first interactive Screen is a Priority Ranking exercise. The priorities are written in plain language and easy to understand. Each priority is matched with an icon graphic allowing participants to immediately identify the topic. By asking for three of the eight goals to be ranked, the exercise is simple and will elicit actionable data on what goals matter most to the region.
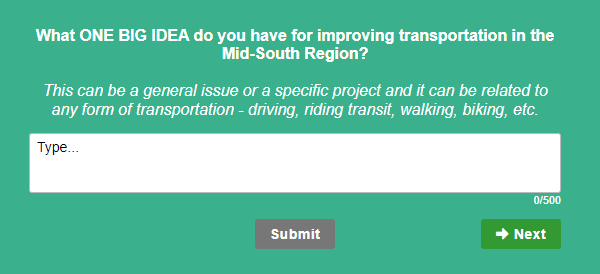
The middle Screen presents a unique method for open-ended feedback, asking participants to indicate “ONE BIG IDEA” for improving transportation in the Mid-South Region. The Vision Statement Screen is an excellent tool to gather broad qualitative feedback and allow participants to vocalize their opinions entirely in their own words.
We love how this survey took this Screen and, rather than asking for feedback on a pre-written statement, asked the community to come up with ideas. The question is specific and detailed enough to elicit quality responses.
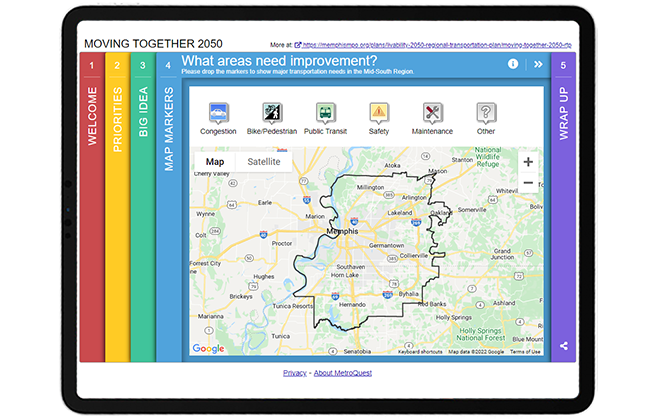
If you are familiar with MetroQuest surveys, you will likely recognize this fourth Screen—the Map Marker Screen! By placing this Screen fourth, participants had a chance to warm up to the project and prepare their thoughts to provide specific location-based data about transportation improvements. Six different markers allow for a huge range of data on various improvements needed for: traffic congestion, bike/pedestrian transportation, public transit, safety and maintenance.
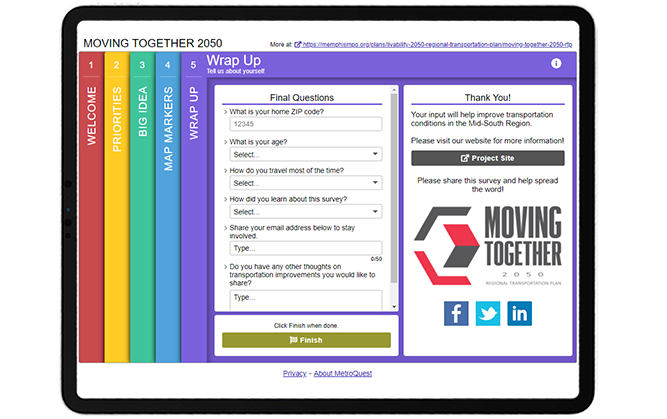
As with all MetroQuest surveys, the final Wrap Up Screen provides a space for few quick final questions to gather demographic information, optional contact details and final thoughts.
Try out the survey yourself through this demo version!
5 Tips from the Moving Together 2050 Survey: Great Visuals and Quick Activities to Engage Hundreds
We’ve highlighted many great features of this survey above. Here are five key tips to remember for your future surveys to turn visitors into participants!
- Make sure your Welcome Screen is inviting: By featuring eye-catching colors and a beautiful aerial image on the first Screen, participants instantly know this is not your standard survey and will be interested to continue. It is important to make sure your Welcome Screen highlights why you want feedback and that the survey will be quick to take, as this survey introduction indicates.
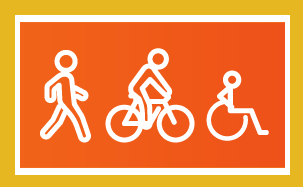 2. Use consistent, clear graphics and visuals: The use of icon graphics on the Priority Ranking Screen is an excellent way to include visuals if you don’t have images that represent each topic. Graphics which are all designed in the same color and visual style can help prevent bias that comes from comparing images, as naturally we are always drawn to select the best-looking image.
3. Write a well-defined question on the Vision Statement Screen: Rather than gathering feedback on a vision statement for the project, this survey took a unique approach with this Screen and asked residents to come up with one big idea. Since this question was written with a direct ask, participants are more likely to provide quality answers. Generally, the more specific you are with open-ended questions, the more precise the feedback will be.
4. Make sure your Map Marker Screen map is properly centered: The KMZ/KML layer on the Map Marker Screen is automatically centered on the Screen so participants do not need to move or zoom-in/out to see the project area. The black border outline clearly defines the area for input.
5. Use dropdown questions on the Map Marker Screen: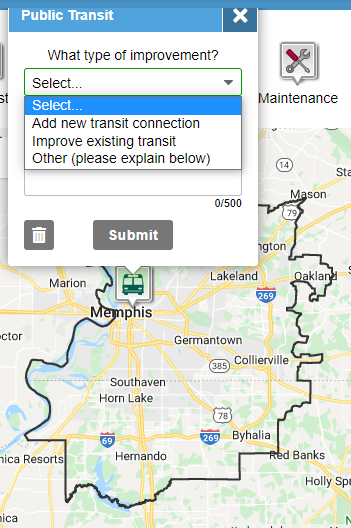 The Map Marker Screen is an excellent way to gather geospatial data but it’s important to consider what each Marker is asking. We recommend always including a dropdown question (example shown left) in addition to a comment box for each Marker so you can gather a mix of quantitative and qualitative data. Qualitative responses can be time-consuming to analyze so it can be very helpful to also gather data on consistent items to compare in aggregate.
Kudos to the Memphis Urban Area MPO team on their excellent survey design! The Moving Together 2050 survey is a perfect example of how to effectively engage a region about their transportation future while keeping the survey simple and quick to complete.
For more great tips on how to make the most out of MetroQuest, contact our Customer Experience team or reach out for more information!
Want to learn more about how MetroQuest supports community outreach on your next transportation plan? Check out our recent webinar:

Forum on Measuring Public Involvement Effectiveness for Transportation Agencies
In this interactive webinar forum, public involvement leaders from TxDOT, NCDOT and GDOT share how agencies can ensure that their public engagement programs are an effective and efficient use of public resources!