With an increased focus on inclusivity and achieving broad community engagement, our team is excited to announce a recent product enhancement to the MetroQuest survey software that aims to help planners achieve more diverse public participation and engage with a broader audience online.
Translating MetroQuest surveys – a new, streamlined approach.
When seeking inclusive, broad-based public engagement for planning, it’s important for planners to find ways to reach out to and connect with community members who don’t utilize English as their primary language. Depending on the make-up of the community, this can sometimes entail creating several different language editions of your survey and promoting them to targeted groups through different communication channels and campaigns.
The option to translate MetroQuest surveys into a variety of additional languages is a feature that has been around for a while. Historically, our Customer Support team was heavily involved in the process. With the objective to make this more efficient and less time consuming, we recently made a series of enhancements to MetroQuest to better support the translation process.
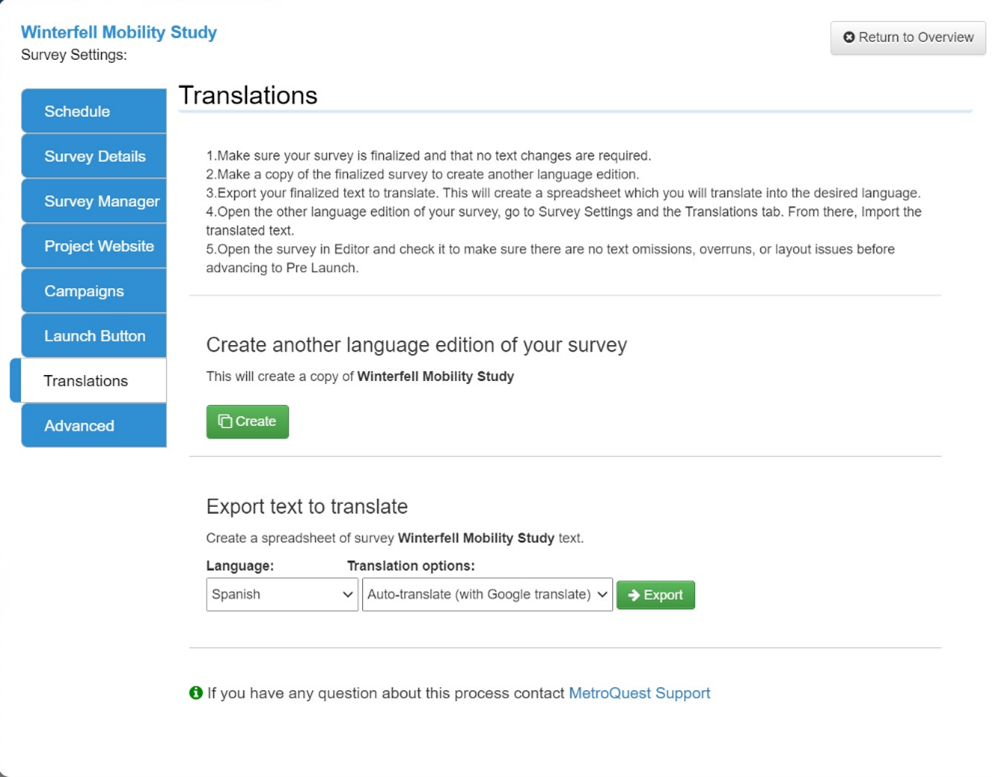
Now, when your team is in MetroQuest Studio, they will see a section dedicated to Translations and find all the information they need to facilitate a translation of any survey.
After creating a replica of your primary language survey and selecting the target language, confirming the new survey title and the launch and end dates of your new language edition, your team will be prompted to export the text to translate into the language(s) of your choosing. The next step, translating the text, can be done using our new Google Translate integration! Once the translation is complete, the translated text will be imported to your new language survey. At this stage, our Customer Support team will work with you to ensure your survey is ready to go before progressing past Pre-Launch.
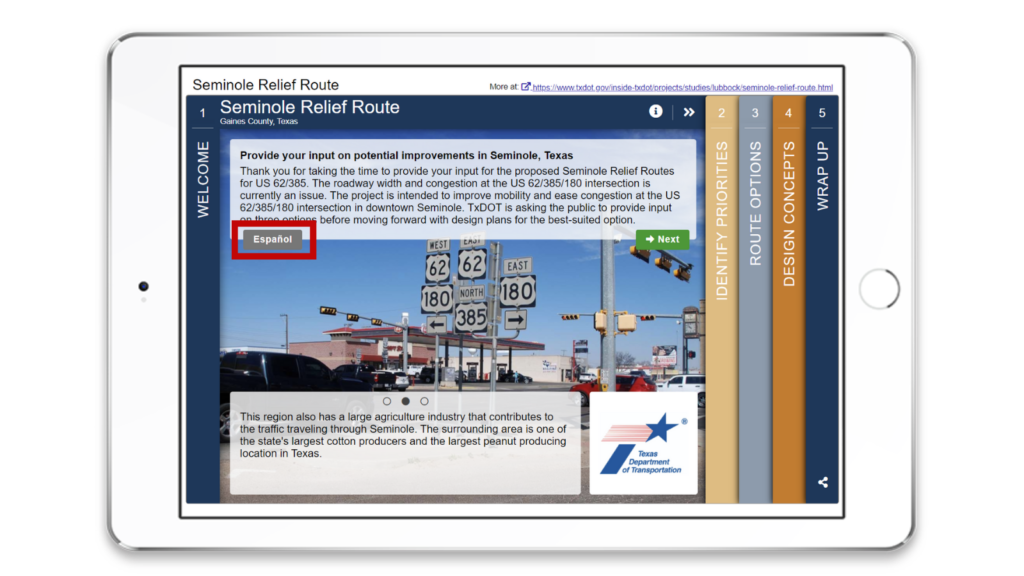
Once you have a finalized edition of your survey in another language(s), a button – or buttons – will automatically appear on the Welcome Screen of your survey where participants can navigate to the survey of their choosing. Here’s an example:
We believe that everyone has a voice, and that together, we can plan better, more sustainable, and inclusive communities. MetroQuest’s mission is to deliver great online public engagement experiences that broaden outreach and bring people together to plan more livable places and move more people. With this enhancement, we hope to enable planners to work towards achieving that goal!
The Survey of the Month series is a monthly blog where we highlight the extraordinary work our customers are doing, along with some takeaways that are relevant for anyone interested in making the most out of online engagement using MetroQuest’s survey platform!
For a change, this month we are leaving North America to highlight a customer in Australia who has created one fantastic survey after another: Blue Mountains City Council in New South Wales (NSW). This agency is unique in many ways, including the fact that the local government area in question is almost 75% National Park!
What’s the story? Developing a vision for recreational visitor destination
The survey we are highlighting this month is the Southern Escarpment Masterplan, a strategic planning initiative by Blue Mountains City Council, to guide future development as well as the ongoing management of nature- and culture-based recreation and tourism. The survey seeks input on how the visitor destinations in the Southern Escarpment are currently used, and the priorities of those who live, work, or visit the area.
The Masterplan is one initiative out of several current planning projects by the Council, all aimed at helping shape the future of the City of Blue Mountains. The plan’s purpose is to coordinate planning, to prioritize infrastructure upgrades, to guide amenity improvements and to provide a strategic planning document to attract public and private sector investments.
Anatomy of a Masterplan Survey: Priorities, Use, and Values
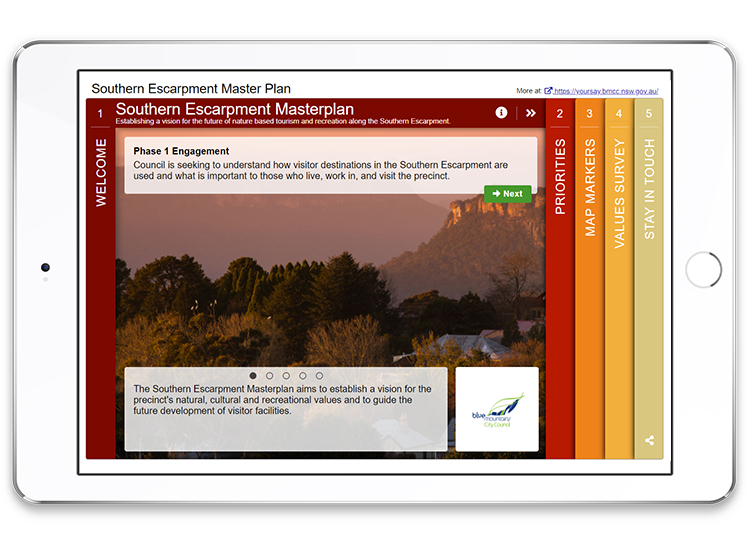
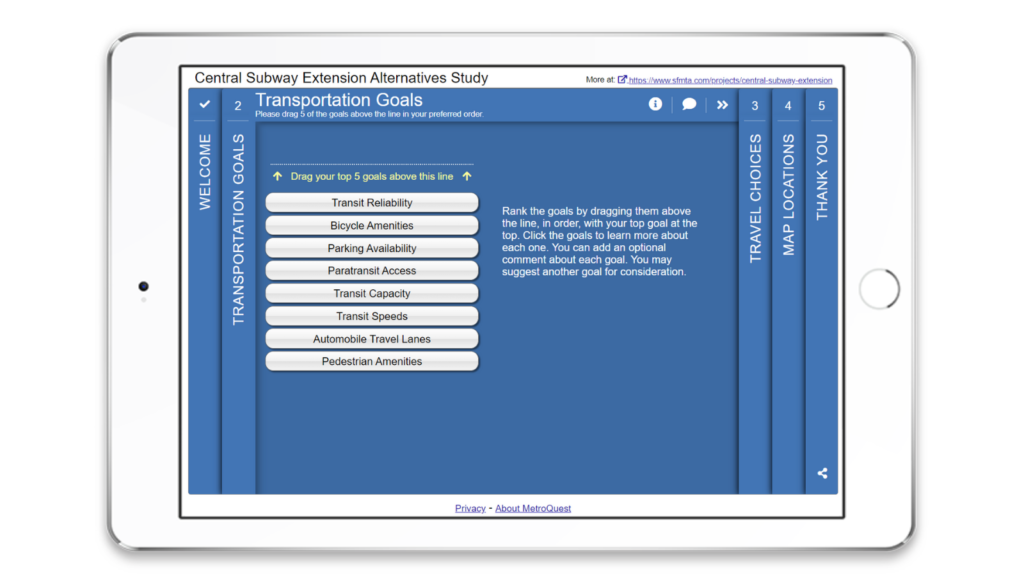
Upon landing on the survey, visitors are presented with a beautiful scenic image of the area in question as well information on the project and the tasks at hand. They are asked to provide input on what they prioritize in the Southern Escarpment on a Priority Ranking Screen. Participants are asked to choose their top 5 in order out of a list of 8 priorities, namely: Exercise, Residential amenity, Nature, Accessibility, Tourism, Culture, Recreation or the option to input an additional priority in text form.
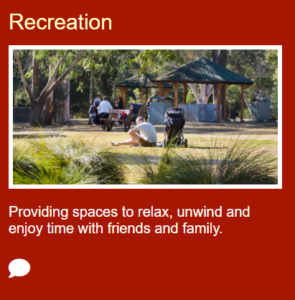
Participants can indicate their priorities for the area, such as Recreation.
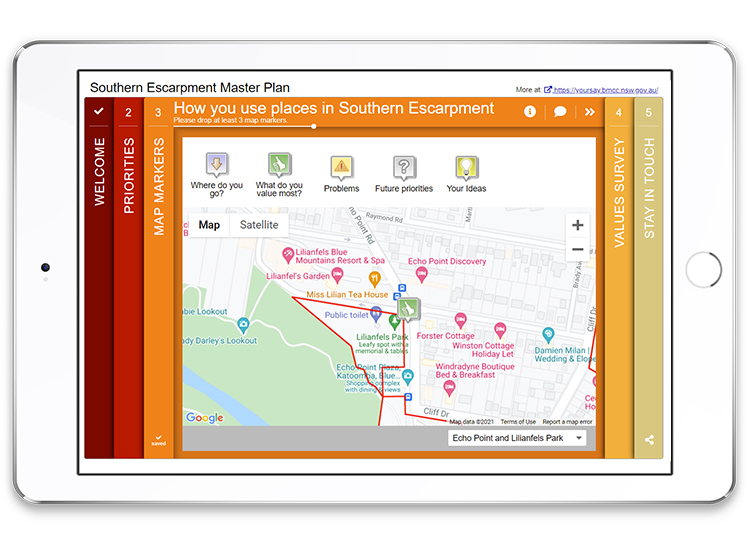
Next, participants are presented with a Map Marker Screen and asked to show how they use places by dropping markers on a Google map. The choices for different markers are “Where do you go”, “What do you value most”, “Problems”, “Future priorities”, as well as “Your ideas”.
The final interactive exercise, before the survey wraps up with demographic questions and a thank you message, is a Standard Survey Screen on values. Participants are asked follow-up questions on the priorities they’ve previously identified as important to them, often asking for clarification on how important an aspect is or how satisfied they are with the current status.
If you’d like to try the survey, visit the MetroQuest survey here. The survey is currently live, but this is a demo version that will not affect the survey results.
5 Tips from Southern Escarpment Master Plan: Using the Plan’s Advantages to Your Benefit
Not every survey is fortunate enough to be discussing a stunningly beautiful landscape, but visual appeal can be applied to almost any context and makes the survey experience more pleasant! Below are 5 takeaways from the survey:
First impressions matter! What instantly stands out is the beautiful image in the Welcome Screen background that ties in perfectly with the color scheme of the survey. A prominent background image can be found for just about any context or project, and helps create a positive initial experience. For example, aerial images always look captivating, and the right lighting or editing can make a picture of a standard bus look striking! MetroQuest’s Image Library offers some choices to get your team started, but you can always upload your own.
The way the team tied-in the colors of the background image with the gradient colors of the Screens makes the entire Survey look remarkable. When choosing colors for each Screen, which are completely customizable, use appealing colors or match a project logo or page for brand recognition. If you do not have marketing guidelines or requirements in respect to colors, have a look at the many MetroQuest-created palettes for inspiration!
The Map Marker Screen utilizes a location drop down at the bottom of the Screen which allows participants to zoom into any and all areas that they are most interested in. This makes for a better user experience as a participant can hone in on exactly where they would like to provide feedback, and also gives you more accurate geospatial data.
This survey used the Priority Ranking Screen as their first interactive activity, and we always highly recommend this for a number of reasons: it warms up participants to this new way of providing input online; it gives you very relevant data on what is important to your participants; and it allows you to give the survey a tailored feel by following-up on participant priorities in a subsequent Screen, as done here with the Standard Survey Screen. This connection also makes the Standard Survey Screen more manageable because it limits the questions to focus on what the participant already identified in the first Screen as important to them. As a result, they are more likely to provide input and meaningful data.
Finally, speaking of the Standard Survey Screen, if you are using it to gather data on very specific areas, we recommend that you place it at the end of the survey as this one does, because a survey taker has already provided input, and is more likely to keep going and complete the survey. If this Screen is up front, a participant might think the entire survey is just survey questions which may discourage them from continuing.
Congratulations to the team at Blue Mountains for a great, interactive, and one of the most beautiful MetroQuest surveys we have come across!
For more great tips on how to make the most out of MetroQuest, contact your Customer Experience manager or reach out for more information!
The Art & Science of Big Online Engagement for Small Plans
Learn from hundreds of case studies and interviews from exceptional planners across the country! This webinar focuses on strategies behind creating delightful surveys for public input and dives into using social media and other advertising tools.
I recently had the privilege of virtually connecting with Hugh Conroy, the Director of Planning for the Whatcom Council of Governments (WCOG). They’re a federal and state-designated regional planning organization located in Bellingham, Washington and a new MetroQuest subscriber!
The agency has had great community engagement success with us, and I wanted to touch base with Hugh to learn more about their transition to online engagement, their remarkable MetroQuest survey and the impressive comprehensive promotional strategy they created to help achieve high levels of online engagement.
Read on for an inside scoop on my conversation with Hugh…
Can you tell me about Whatcom COG and the types of projects you’re currently working on?
We’re a small US metropolitan planning organization (MPO) serving a population of about 225,000. As the federal recognized MPO and state designated regional transportation planning organization (RTPO), we’re responsible for managing the region’s long-range transportation plan and undertake a variety of other transportation planning and programming activities.
We’re currently updating the region’s long-range transportation plan. While the last two plan updates have included public input and review opportunities, a more dedicated regional assessment of the public’s transportation investment priorities hadn’t been conducted since 2001.
“As part of the continuous planning process, we saw the need to begin the 2022 update with a higher profile effort that would allow us to take stock of how our community’s goals for transportation investments may have changed over the last 20 years.”
We used MetroQuest to launch our 2021 Whatcom Transportation Survey for this project, which gives the public an opportunity to weigh in on our region’s long-range, 20-year transportation plan.
Can you tell me about Whatcom COG’S journey from traditional public engagement strategies to online tools and tactics?
I wouldn’t say it was so much a transition as an addition to what we’ve done in the past. As a metropolitan planning organization, we have ongoing public engagement activities related to publication of plans and actions of the regional Transportation Policy Board. With our main, 20-year plan update coming up next year, we wanted to take a bigger leap into broader public engagement and looked at online tools to do so.
“I think a combination of things made it really obvious that an online platform as our primary public engagement mode would be the way to go.”
We’d already done some of that on a smaller scale using tools like Google Forms and COVID-19 definitely limited what we would do in terms of face-to-face meetings and attending community events.
The option to leverage the relative ubiquitousness of internet-connected devices pointed to an engaging online platform like MetroQuest and proved to be a great fit with our goal of hearing and recording feedback from a much wider audience than we’ve connected with in the past.
Why did the organization decide to use MetroQuest for this project? What kind of impact has the transition had?
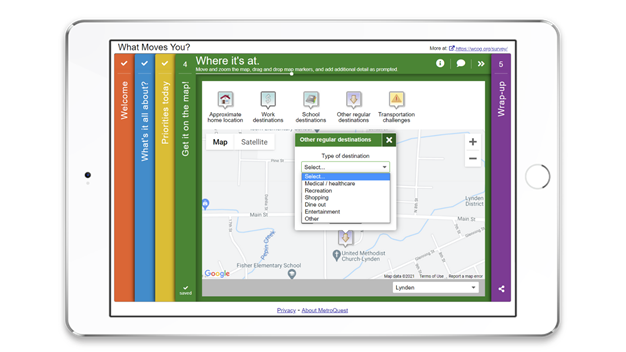
We looked at a variety of online platforms and surveys, but knew we wanted to have a mapping component. Not only is the extra richness of the resulting mapping information attractive for our team, but I think respondents have more fun and feel find that giving input about specific geographic locations is a lot more satisfying.
The survey is still open to the public, and we’ve already engaged 1,845 participants online! This is a drastic difference between the amount of public input we collected back in 2001.
“The 2001 Whatcom Regional Transportation Summit convened roughly 120 community members, compared to our MetroQuest survey that has reached nearly 1,900 participants and still growing.”
“At the end of the survey, participants are given the option to share their email address so that we might ask them a couple of follow-up questions and notify them when the survey summary report becomes available. So far, over 600 individuals have shared an email address which, if managed carefully, could be an important resource for some ongoing public engagement.”
WCOG developed a comprehensive promotional strategy to help increase its public engagement numbers. Can you walk us through some of the promotional tactics you used?
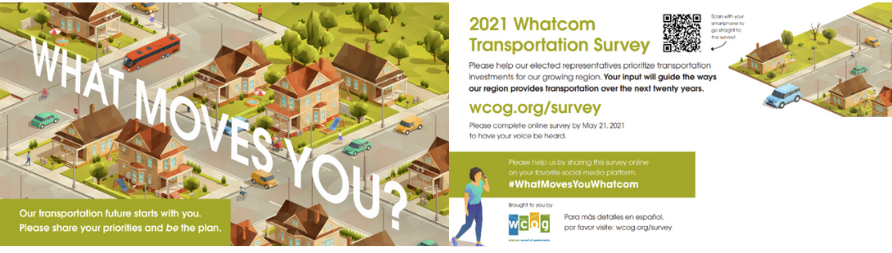
After completing a regional household travel survey four years ago, we were familiar with the effectiveness of old-fashioned mail. We worked with a graphics professional to design a postcard and worked with a mailing service to help ensure the postcard, which was randomly mailed to 40 percent of all households, was equally distributed within the region’s local jurisdictions.
Whatcom COG What Moves You Postcard
“We generated distinct URLs to track where people were coming from and, so far, the bulk of our responses have been generated from our postcard initiative.”
We also leveraged the in-house marketing expertise of our transportation demand management program, known as Whatcom Smart Trips, to assemble a press kit for print and radio media and partner agencies to announce the survey effort through the publications and websites they manage. We used our project website and social media accounts to advertise the survey. We’re also currently working on a second press release to help drive more engagement towards the end of the survey period.
Any tips for agencies and firms looking to reach their target demographics?
On the mail carrier routes in census areas at or below the metrics we use to track low-income or ethnic minority households, we mailed a postcard to 100% of the households in those areas to help us reach a more diverse audience and hear from traditionally underrepresented groups in our community. If you’re using mail and don’t have funds to mail to every single home, I recommend a mix of randomized selection approach and targeted saturation to increase the potential for hearing from traditionally underrepresented community members.
Congratulations to Hugh and the entire team at WCOG! We’re so impressed by your community engagement efforts and look forward to seeing the survey’s final results in the coming weeks.
Two months ago, we introduced MetroQuest Minute, our new series where we share a short, one-minute video every month about a community engagement tip, strategy, or technique. In case you haven’t seen our March or April MetroQuest Minute videos, I’ll insert links to them here:
For this month’s MetroQuest Minute, I’m excited to share an effective technique to increase your level of public participation and online survey completion rates. Click on the video below to watch:
In-Video Resources
Feel free to try out the three demo surveys that I shared in the short clip above! These versions do not collect data and will not affect the survey results.
For each survey, you can choose five interactive components from our library of fourteen, to match your project needs.
These components, which we call screens, provide a different, interactive experience, and are designed to provide project context while collecting participants’ feedback.
This makes a survey experience fast, engaging and informative.
This blog was originally published on November 19, 2014.
Whether or not your community is familiar with public engagement, improving the overall experience of filling out an online survey or taking part in a public meeting can make it easier for community members to take part, and help establish a culture of trust.
We’ve identified five questions that participants often ask practitioners and 21 corresponding tips to help you can use to help enhance the public’s online experience and your public engagement results! Let’s get started…
Question 1: “How long will this take?”
In the digital age, attention spans are shorter and there’s more and more taking up our time. Aim to keep the online engagement process short for participants.
Tip #1: Get people started in 10 seconds or less. Avoid complicated instructions or registration pages where participants must create an account in order to participate. If you’re using something like Zoom for online public meetings, send out links with the password embedded!
Tip #3: Show people what’s at stake and how their input will be used.
Tip #4: Start with the right question. At MetroQuest, we’ve found that asking people to identify their priorities is one of the most engaging ways to start. Check out one of our priority ranking screens to see for yourself how you can do that in a survey!
Tip #5: Start engaging early on in the planning process. People want to weigh in before decisions have been made.
Tip #6: When collecting input, create a sense of urgency. Let people know that there is a limited time for them to provide their input.
Question 2: “What’s in it for me?”
People are self-interested. Your calls-to-action, branding and content must draw people in.
Tip #7: Test out different calls-to-action. Different demographic groups will respond to different messaging. The different channels you use can have an impact as well.
Tip #9: Connect with people emotionally. Stories and images are more powerful than words and statistics.
Tip #10: When asking participants to identify priorities, highlight the pros and cons of each and help them link it back to their own experiences.
Tip #11: Give people input opportunities that matter to them and their community. Think about what kind of input people might want to get off their chest and give them a safe and accessible way to share it.
Tip #12: Understand sharing on social networks. Develop visuals, messaging and an experience that people will be proud to promote, and that others will like, leave comments on, or share.
Question 3: “Am I comfortable with this?”
When providing input, individuals may feel intimidated or reluctant to share their real thoughts. Try to make the online engagement experience safe and comfortable for participants.
Tip #13: Ensure that your questions are clear so that participants understand exactly what’s being asked of them. Use simple language, avoid jargon and make sure that the process to provide input is straightforward and simple.
Tip #15: Don’t allow for grandstanding or bullying. People are more likely to share their true views and opinions if they feel safe and know their ideas won’t be challenges or ridiculed online.
Question 4: “Can you help me with this?”
Planning issues can be intimidating, and many people don’t feel qualified to register an opinion. It’s important to help people learn in a way that doesn’t turn them off.
Tip #16: Ask questions that people feel qualified to answer. Everyone knows what they like and dislike and what priorities are most important to them in their community.
Tip #17: Allow people to discover insights for themselves by embedding learning in the experience. For example, a budget allocation exercise can help inform participants that funding for the project is limited.
Tip #18: Educate before asking for opinions to ensure the public is well-informed about the project. By providing context, you help to ensure that participants provide you with educated input and knowledgeable answers to the questions being asked.
Question 5: “I’m in a rush. Do I really need to finish this?”
For people in a rush, i.e., 95% of participants, it’s important to work hard to get them to finish a survey and answer as many questions as they can.
Tip #19: Leverage people’s curiosity and sense of accomplishment. Share graphics of survey results, and show the community how their input was used.
Tip #20: Ask for personal information at the end, rather than at the beginning. People are much more willing to provide this information at the end of the engagement experience, when they’re already invested in the project.
Tip #21: Prizes work! Offer something of value, such as a chance to win a tablet or gift card, to encourage more people to participate.
Over to you. What insights do you have that could help improve online engagement?
The Survey of the Month series is a monthly blog where we highlight the extraordinary work our customers are doing, along with some takeaways that are relevant for anyone interested in making the most out of online engagement using MetroQuest’s survey platform! To see more in the series, visit the blogs here.
What’s the story? Seminole Relief Route
Seminole, Texas, is a major hub and a part of an important transportation corridor that connects and provides access to the area’s energy sector. Heavy use of the roads through the city by semi-trucks increase congestion and require wide roads. Furthermore, the region’s large agricultural industry contributes to additional pressures on the roadway system. The Texas Department of Transportation (TxDOT), one of MetroQuest’s most active customers, is conducting a study to improve mobility and ease congestion in Seminole. The study evaluated existing roadway, explored funding options and considered all alternative solutions, including the option to defer the project.
In addition to a virtual public meeting, they created a MetroQuest survey in both English and Spanish, discussed in detail below, to gauge community priorities and collect opinions around these options.
Anatomy of a Mobility Survey: How they used MetroQuest
The Seminole Relief Route survey starts with the Welcome Screen, as do all MetroQuest surveys, where TxDOT provides background information on the study to explain the intent of the survey and thank participants for their input.
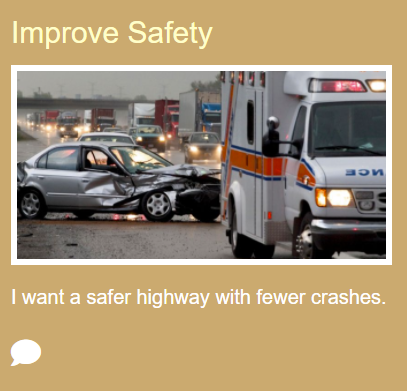
The first interactive Screen is a Priority Ranking Screen, where participants are presented with seven priorities, namely (in random order) Protect the Environment, Support Economic Growth, Maintain the Existing Highway, Enhance Mobility, Relieve Congestion, Improve Safety, and Limit Right-of-Way Impact. Each priority is presented with an image and a short and clear “I want …” description to help participants decide what is most important to them.
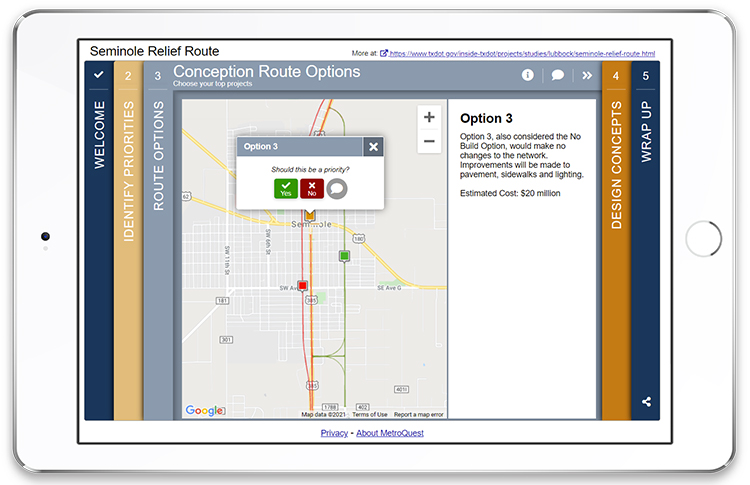
The second activity is on the Project Selection Screen, presenting the three conception route options on a Google Map so that participants can visualize the options geographically. Each option is explained in more detail, including their estimated cost. Participants are asked to review the options and their location, and decide if the options in question should be a priority.
Finally, before answering a few demographic questions on the Wrap Up Screen, participants are asked to provide input on the same three options on a Scenario Rating Screen.
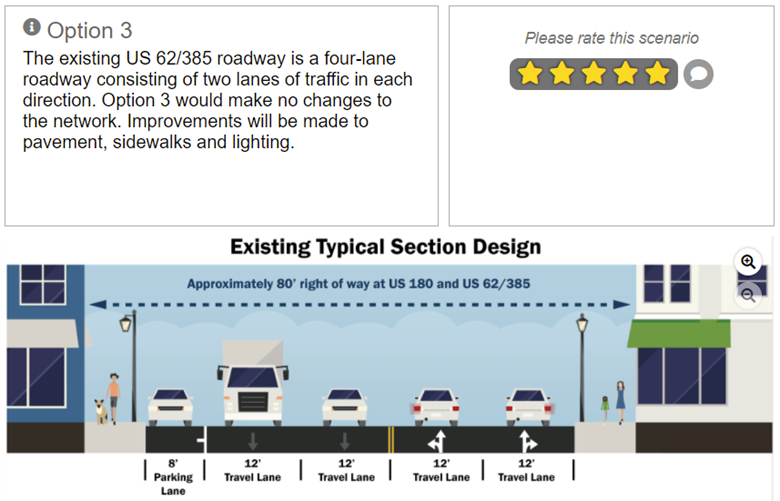
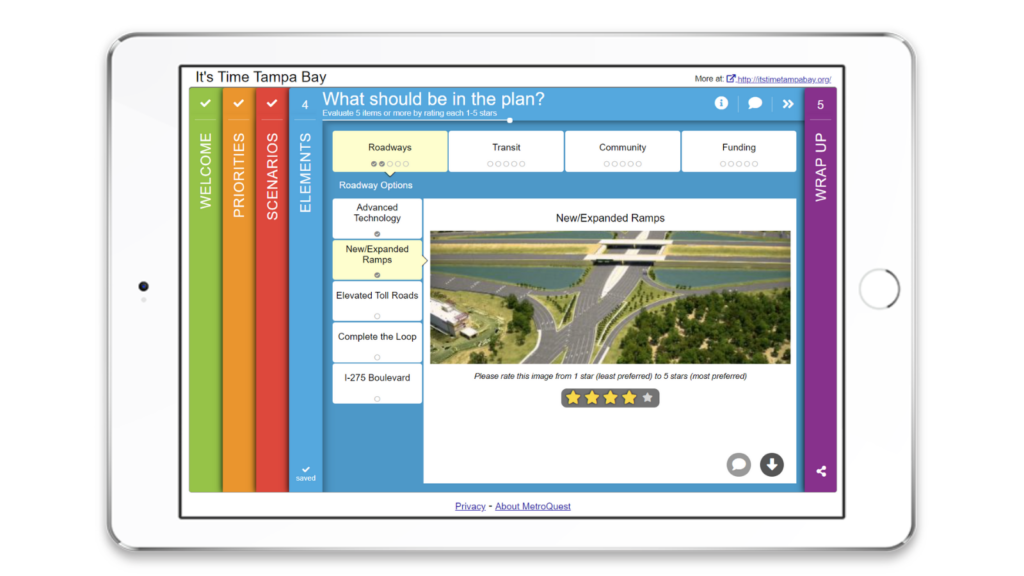
Here, the three options are presented as design concepts showing what a typical section design would look like conceptually. The task is to rate each on a 5-point scale. Asking for input on the same three options in two different ways is a smart way for the survey team to capture preferences for the three options from people, irrespective if they are more drawn to visual concepts or lines on a map!
If you’d like to try it out, visit the demo survey here. This version that will not collect data or affect the survey results.
5 Tips from the Seminole Relief Route Survey: Using MetroQuest to Understand Participant’s Preferences
TxDOT’s ample experience using MetroQuest for online engagement is reflected in this survey. The team make the most of built-in capabilities that help participants to recognize the importance of the study and understand the value of their contribution, while also helping the survey team to understand participants preferences and make a well-supported decision on the project. Below are 5 takeaways from their survey:
Both the Welcome and the Wrap Up Screen have space for a project or partner logo. This survey utilizes these spaces to feature the official TxDOT logo which is great for brand recognition as well as legitimacy – participants can rest assured this is an official survey created by their DOT!
Similarly, the colors of both the Welcome and the Wrap Up Screen are found in the TxDOT logo and many of their surveys utilize the same or similar color palette. This too is great for its recognition factor. MetroQuest allows the survey builder to completely customize the color palette to match a project or partner logo, or an official palette. This type of color branding helps trigger recognition and is great for building a brand around the agency or project. You can also choose one of our many pre-set palettes that follow best practices in terms of visibility, contrast, and appeal!
On the Priority Ranking Screen, the survey team opted to feature seven possible priorities and asked participants to choose their three favorites. We always recommend doing exactly that – limit the number of priorities so that participants can easily digest the options, and ask participants to prioritize only a subset for better input. In this case, participants only had to pick three out of seven total. This nudges participants to decide on what is truly important to them and also keeps the task simple and fast.
TxDOT opted to utilize the Scenario Rating Screen to present the three options’ design concepts visually and ask for input. This is a great use of the comparative nature of this Screen as it allows participants to switch back and forth to understand differences between the options so that they can make an informed choice. It’s a great way to provide a lot of context and options in a short time!
Finally, as previously alluded to, it is an excellent idea to utilize multiple Screens to ask for input on the same topic, especially if that is the core of your study. In this case, that is the three options for the Seminole Route. This conceptually connects the two Screens but presents the options in two very different ways: spatially on a map and visually as design concepts. This allows the team to capture input on the options in complimentary ways, allowing for the most informed input from the widest possible audience.
Congratulations to the team at TxDOT for yet another well-executed survey and great engagement success!
For more great tips on how to make the most out of MetroQuest, contact your Customer Experience manager or reach out for more information!
Public Involvement – How TxDOT Engages Beyond Meetings
Input from online engagement is informing transportation decisions in Texas. Learn how TxDOT embraces innovation to successfully educate and engage residents on projects at any scale.

![[SURVEY OF THE MONTH] Exploring Strategic Planning in Australia: the Southern Escarpment Master Plan](https://metroquest.com/wp-content/uploads/Exploring-Strategic-Planning-in-Australia.png)

![[METROQUEST MINUTE] 5-Minute Survey Experience for Better Public Engagement](https://metroquest.com/wp-content/uploads/METROQUEST-MINUTE-5-Minute-Survey-Experience.png)

![[SURVEY OF THE MONTH] How Texas DOT is Improving Mobility and Easing Congestion with MetroQuest](https://metroquest.com/wp-content/uploads/SURVEY-OF-THE-MONTH-How-Texas-DOT-is-Improving-Mobility-and-Easing-Congestion-with-MetroQuest-1.png)