Category: [SUCCESS]

  • [SURVEY OF THE MONTH] COVID-19 Survey Series: Regional Economy Development Recovery Plan

    [SURVEY OF THE MONTH] COVID-19 Survey Series: Regional Economy Development Recovery Plan

    The Survey of the Month series is a monthly blog where we highlight the extraordinary work our customers are doing, along with some takeaways that are relevant for anyone interested in making the most out of online engagement using MetroQuest’s survey platform!

    To see more in the series, visit the blogs here.

    This month, we are changing gears and highlighting a survey series relevant to everyone after the last year and a half: the Nashua Regional Planning Commission (NRPC) is developing an economic development recovery plan in response to the fallout from the COVID-19 pandemic. The three-survey series will help NRPC identify the challenges businesses face and develop practices and strategies to stimulate the economy and foster and increase support for businesses.

    What’s the story? COVID-19 Impact on Businesses

    The NRPC serves 13 municipalities in the greater Nashua region located in Southern New Hampshire. The Commission focuses on developing and implementing innovative planning strategies to preserve and improve the quality of life.

    NRPC was awarded a grant from the Economic Development Administration (EDA), and started the process to develop a comprehensive economic development recovery plan for the greater Nashua region. The initiative addresses the impact of the COVID-19 pandemic on the region’s economy, including job loss, business closure, workforce challenges and the disparate impact of recent economic disturbances on traditionally disadvantaged and underserved businesses.

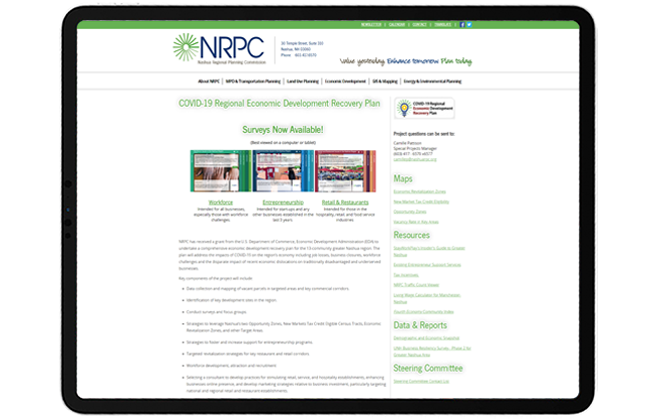
    The Survey series consists of 3 modules: Workforce, Entrepreneurship and Retail & Restaurants. NRPC built a brilliant project website, which is an essential part of successful online engagement. Here are some key takeaways from the NRPC’s project website:
     

    NRPC_projectWebsite


    1. Building a project website allows the engagement team to develop a brand around the project. In this case, while NRPC used MetroQuest for the online survey, the name of the tool is not relevant to participants. NRPC followed their branding guidelines by using the organization’s vibrant green color and built the branding around the project. Moreover, the project website will be available for longer than the MetroQuest Survey’s engagement period, allowing visitors and participants to follow the project for updates.
    2. At the top of the project website, visitors are presented with large, prominent Survey launch buttons linking to their 3 Surveys. Having the Survey links readily available on the project website delivers a clear call to action and is key to driving traffic to the Survey.
    3. Below the Survey launch buttons and before sharing their input in the Surveys, visitors are given the opportunity to learn about the intended audience for each Survey with detailed but concise background information about the project.

    I encourage you to visit their project website and see how following these guidelines creates a welcoming environment for Survey participants.

    Anatomy of the Economic Recovery Plan Survey Series: Identifying Challenges & Strategies and Weighing Support Options

    The Survey series consists of three parts: Workforce, Entrepreneurship and Retail & Restaurants. Each of the three surveys are intended for different audiences:

    1. Workforce Survey for all businesses, especially those with workforce challenges.
    2. Entrepreneurship Survey for start-ups and any other businesses established in the last three years.
    3. Retail & Restaurants Survey for businesses in the hospitality, retail, and food service industries.

    Upon landing on each Survey’s Welcome Screen, visitors are greeted with representative images for each topic along with a short introduction with the purpose of the project and statistical facts.
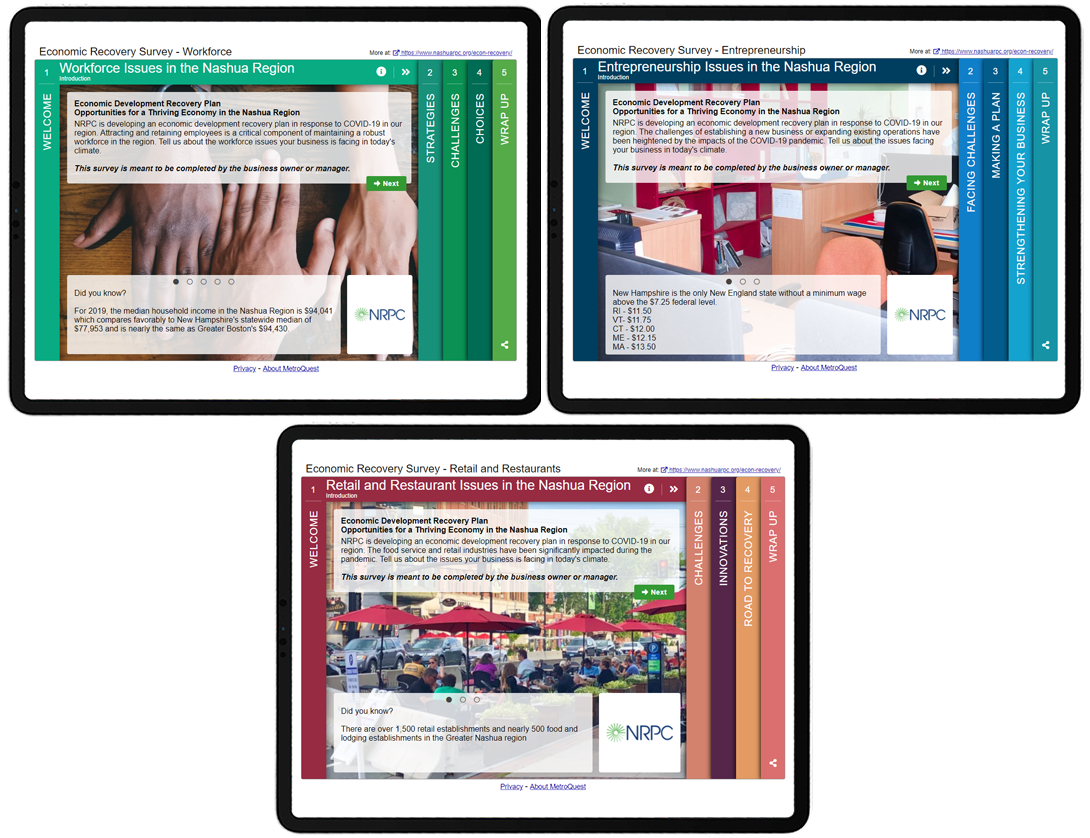


    Like many other MetroQuest Surveys, the pandemic recovery surveys begin the interactive portion of the Survey with Priority Ranking Screens. The visitors are asked to rank five challenges the business has faced due to the pandemic. For example, two of the surveys ask visitors to rank factors that have adversely affected their ability to maintain and expand operations in the hospitality industry or as a start-up. In contrast, in the Workforce Survey, participants are asked to rank five strategies the business is willing to implement to expand its available workforce. These challenges and strategies were previously identified by the team at NRPC.


    Next, different rating Screens were utilized to suggest and inform the visitors of any options and strategies that could be implemented to conquer the challenges they currently face. Visitors were asked to give input on the strategies based on how well it would work for their business, whether by responding to a Tradeoffs Screen, Budget Allocation Screen or Strategy Rating Screen.

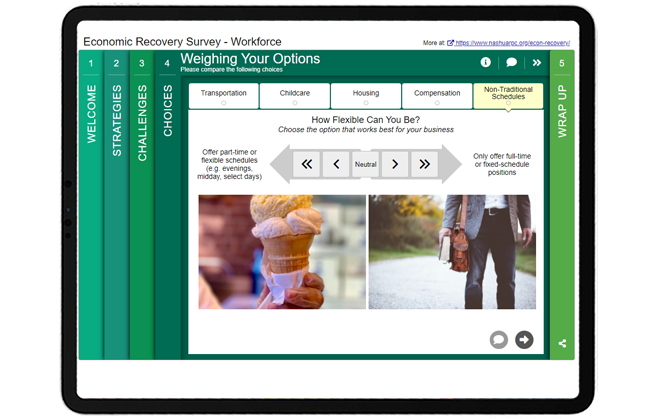
    For example, the Workforce Survey used a Tradeoffs Screen to display five tradeoffs presented to the visitor in the previous Screen: Transportation, Childcare, Housing, Compensation, and Non-Traditional Schedules. Visitors were asked to indicate which tradeoff they prefer. For example, under Non-Traditional Schedules, they were asked to indicate their preference regarding flexible hours or traditional fixed and full-time hours.


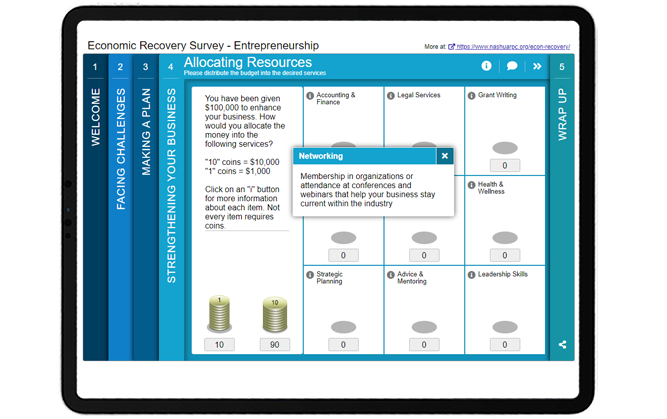
    Similarly, the entrepreneurship Survey included a Budget Allocation Screen to ask participants to distribute theoretical funding of $100,000 across nine categories: Accounting & Finance, Legal Services, Grant Writing, Marketing & Communication, Networking, Health & Wellness, Strategic Planning, Advice & Mentoring and Leadership Skills.

    Each category provides more details so that participants can make an informed decision on where they would spend the funding and investment. This interactive activity strengthens the idea of funding prioritization for participants, illustrating options and limited resources.


    If you would like to try the Surveys, here are the links for each Survey:

    These are demo versions that will not affect the Survey results.

    5 Tips from the COVID-19 Recovery Plan Survey Series: Clear calls to action!

    From the project website to the Survey series, NRPC’s message is clear and straightforward. Below are 5 takeaways from their project:

    1. Essential elements of the project website are providing concise background information for the participants to learn about the project initiative and a clear call to action with prominent survey links and eye-catching screenshots of the three Surveys.
    2. Once visitors land on the Welcome Screen, they are greeted with the purpose of the Survey and the importance of the public’s input in a succinct manner. This is followed by the statistical facts on the relevant topic on the bottom rotating sliders, helping visitors understand the context and relevance of their input.
    3. In all three Surveys, Priority Ranking Screens serve as the first interactive Screen to easily show participants how to share their input using this new, fun method. It is a simple yet effective exercise. Your participants get warmed up to using MetroQuest’s interactive activity while you gather data-driven insights that are easy to understand!
    4. Instead of using cumbersome standard survey questions, gamify the experience so that participants have more enjoyment while providing feedback for your project! The Budget Allocation Screen is an excellent choice to educate participants about limited resources and solicit input about where they would allocate them, while playing a quick game. A fun survey experience will help you achieve a higher survey completion rate. The participants will also be more likely to share your Survey with others that you might not be able to reach otherwise.
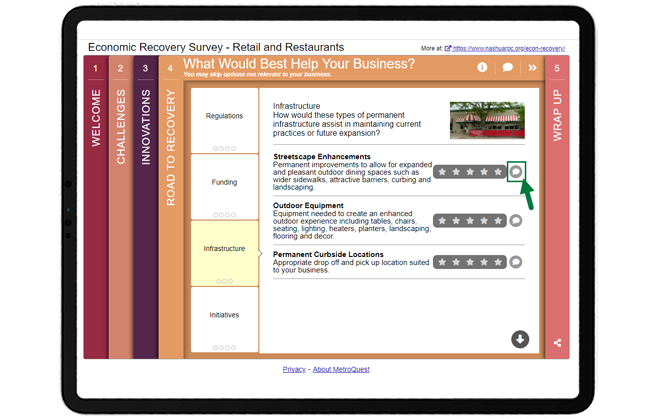
    5. Using different rating Screens, including the Image Rating and Strategy Rating Screens, allow you to gather qualitative data quickly; simultaneously, you can also allow participants to provide optional written feedback by providing the comment button where appropriate. This will enable you to gather both qualitative and quantitative data!
     

    Congratulations to NRPC for creating a fantastic survey series to help the businesses in their community!

    For more great tips on how to make the most out of MetroQuest, contact your Customer Experience manager or reach out for more information!

    Want to learn more about how MetroQuest supports community outreach on your next transportation plan? Check out our recent webinar:

     

    The Art and Science of Virtual Public Engagement for Transportation Planning

    The Art and Science of Virtual Public Engagement for Transportation Planning

    Online surveys have come to the forefront as safe, effective measures for engaging a large and diverse audience. Learn how to create delightful surveys that engage 1000s and deliver the results you need to support a wide range of transportation plans!


  • [SURVEY OF THE MONTH] Our City, Our Voices – Comprehensive Planning for today and the future with the City of Nanaimo

    [SURVEY OF THE MONTH] Our City, Our Voices – Comprehensive Planning for today and the future with the City of Nanaimo

    The Survey of the Month series is a monthly blog where we highlight the extraordinary work our customers are doing, along with some takeaways that are relevant for anyone interested in making the most out of online engagement using MetroQuest’s survey platform! To see more in the series, visit the blogs here.

    This month, we want to highlight a comprehensive plan in an earlier stage of planning for Nanaimo, a harbour city on the east coast of Vancouver Island in British Columbia, Canada. LANARC Consultants are helping the City and its Mayor with an initiative to engage the community to receive great ideas and collectively create a vision and road map for their city’s future!

    What’s the story? A path to the future, together!

    The City of Nanaimo currently has a population of 100,000. By 2045, they estimate 140,000 people will live, recreate and work there. Nanaimo’s Mayor and Council introduced REIMAGINE NANAIMO, an initiative to collectively imagine how the spaces and places of the city can evolve to better meet the needs of the natural environment and the people.

    REIMAGINE NANAIMO is part of a multi-phase comprehensive plan. The initial phase gathered ideas by sharing information and listening to resident’s views about the city’s future. Now, the city is developing options for achieving its shared vision and is evaluating ways to support the goals.

    The Survey had incredible outreach campaigns working with influencers on various social media platforms to reach diverse demographics. They engaged 1539 participants with 20906 data points. Because of the Survey’s fun and informative components, which we will talk about below, REIMAGINE NANAIMO achieved an impressive participation rate of 64% meaning at least 1 out of 2 visitors shared their input; a typical Survey obtains around 20 to 30% participation rate. They could not be happier with the results!

    To learn more about the project, please visit the project website here.

    Anatomy of a Comprehensive Plan Survey: Priorities, Scenario Exploration, and Scenario Building

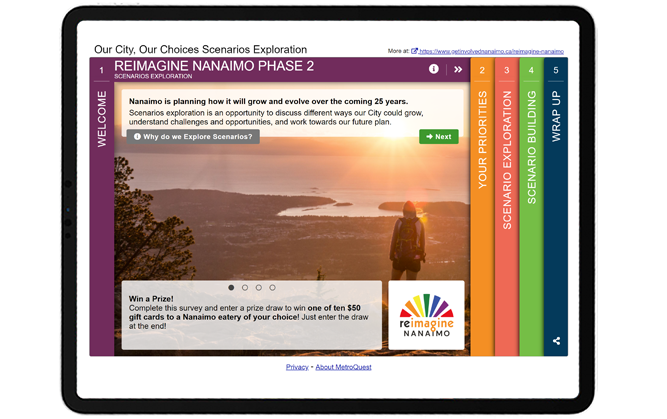
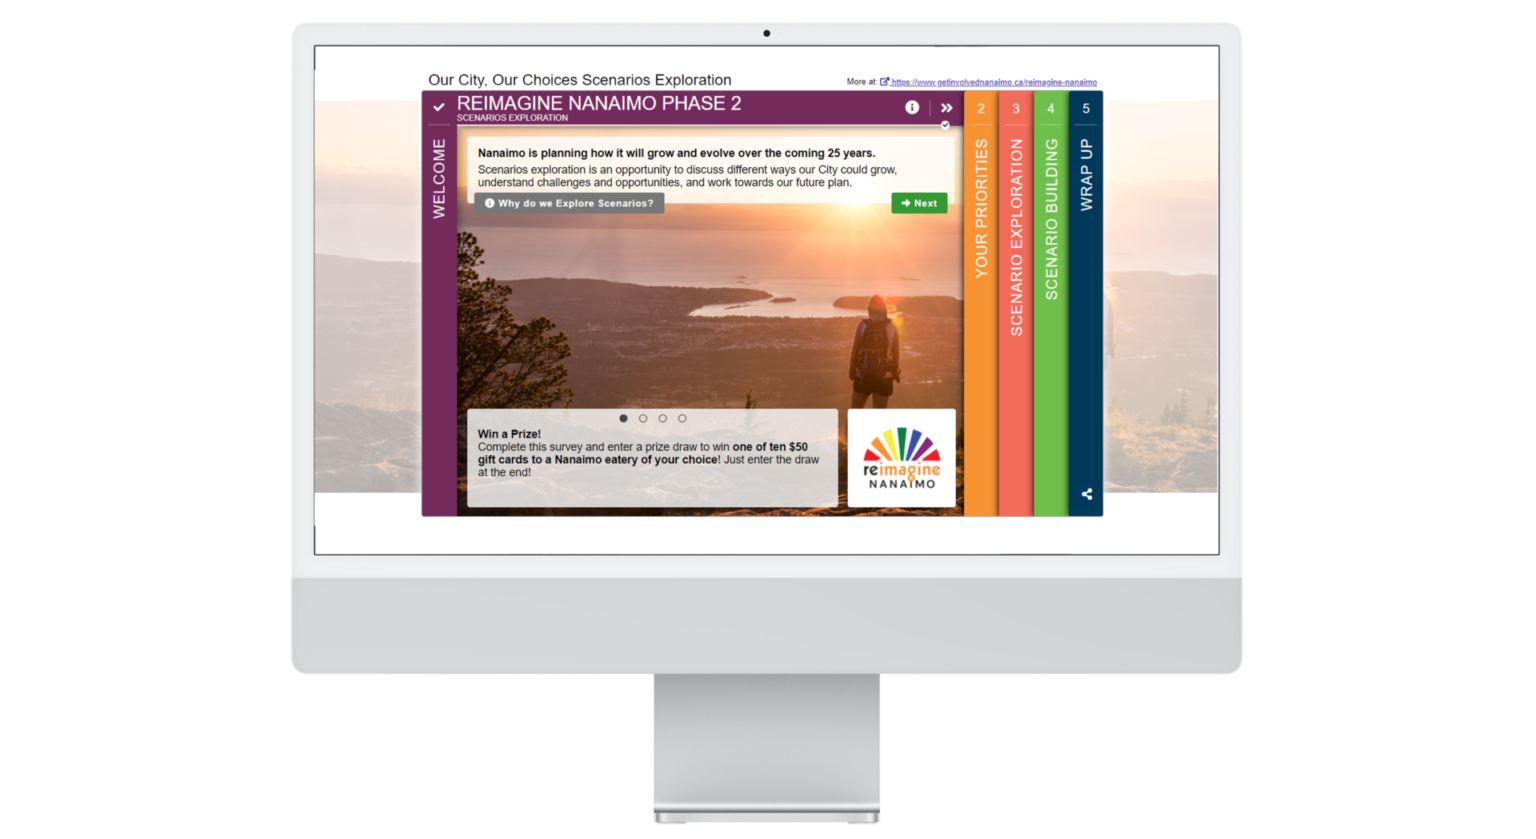
    When visitors open the Survey, they are welcomed by the beautiful scenery of a hiker overlooking the city, a short introduction of their project and information on the significance of their input on the Welcome Screen.


    Anatomy of a Comprehensive Plan Survey: Priorities, Scenario Exploration, and Scenario Building


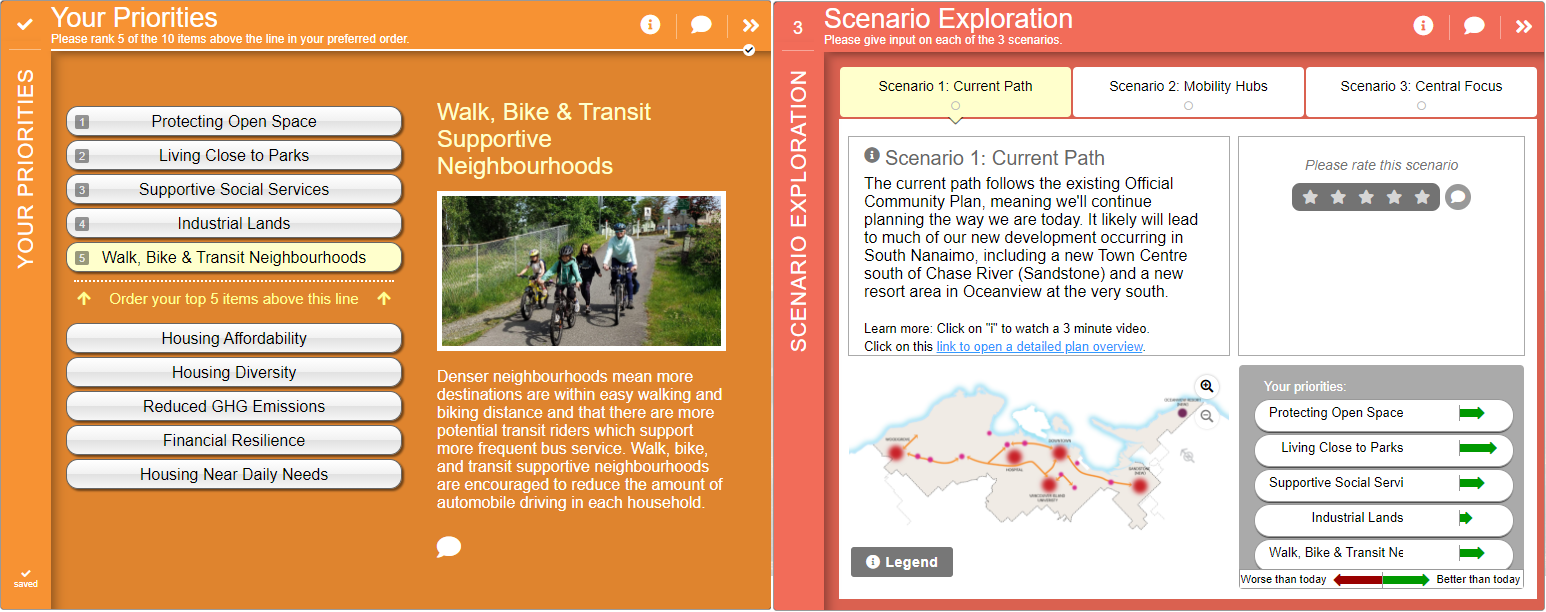
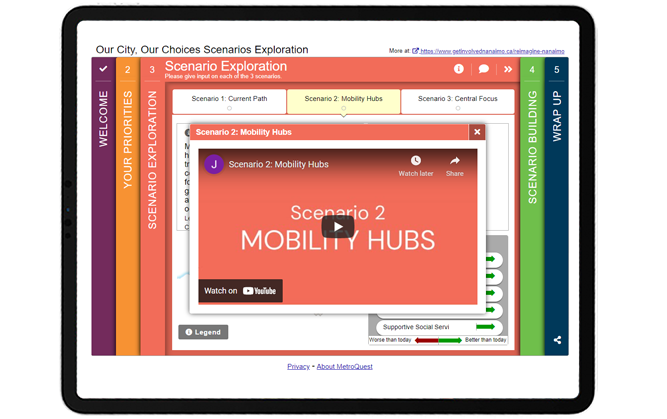
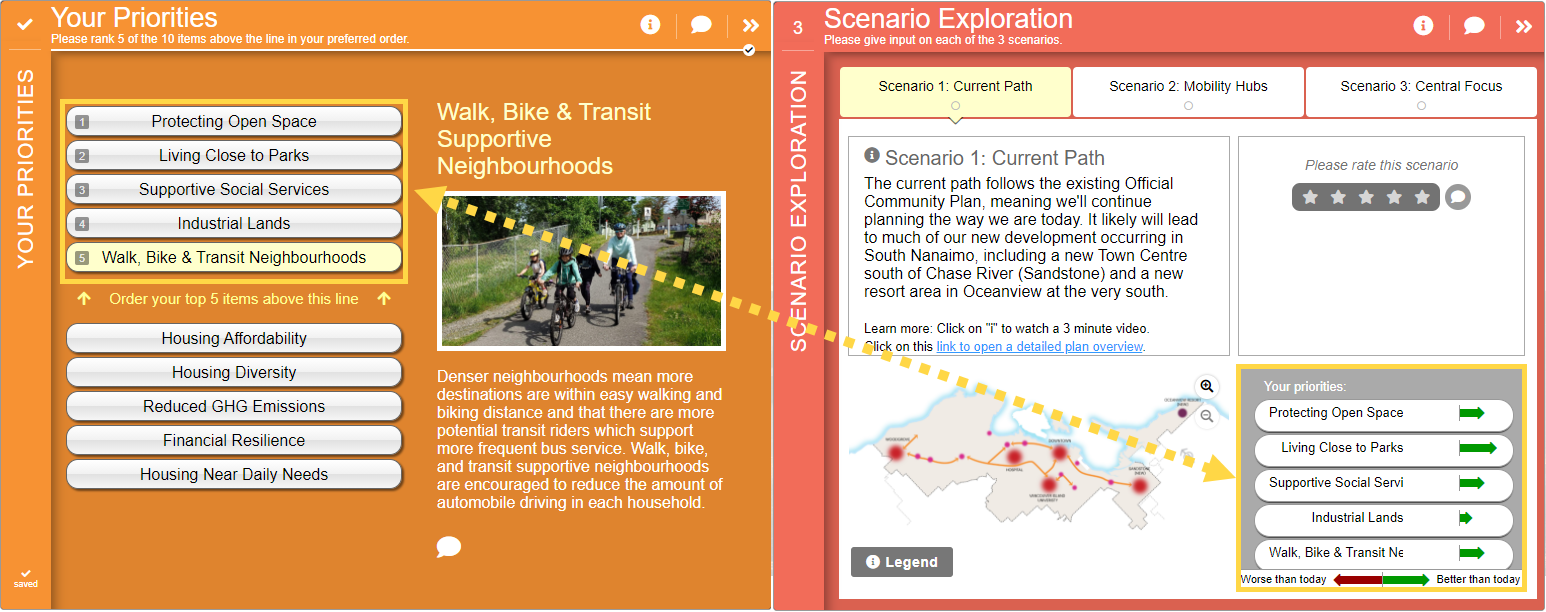
    On the following Priority Ranking Screen, participants are asked to rank their top 5 priorities out of a list of 10 related to transportation, economy, housing and natural environment. The selected top 5 priorities are shown on the following Screen, the Scenario Rating Screen, where participants are asked to explore 3 different scenarios: Current Path, Mobility Hubs and Central Focus.


    By showing the priorities with as metrics, participants can discern which scenario performs best given their priorities and make informed decisions! The participants can familiarize themselves with the project by viewing the detailed plan overviews in PDF and short videos.


    On the next Screen, the Map Marker Screen, the participants are asked to provide input on the types of destinations that they feel are missing in Nanaimo by dropping makers on a Google map. The marker types to choose from were “Tall Buildings”, “Infill Neighbourhoods”, “Shops & Services”, “Community Amenities”, “Support Services”, “Active Trans & Transit” and “Other”. Each marker has dropdown options and a comment box for the participants to provide more in-depth input.

    Finally, the Wrap Up Screen asks a few demographic questions, thanks the participant and allows them to enter in a prize draw for a local eatery.

    We encourage you to try the Survey by clicking here. This is a demo version that will not affect the survey results.

    5 Tips from the ‘Our City, Our Choice: Scenarios Exploration’ Survey: Simple call-to-action with informative videos and additional resources

    Nanaimo is a beautiful place and the decision makers care about community engagement and the public’s role in shaping the city’s future. They put together an engaging MetroQuest Survey with many takeaways. Below are just 5 tips from their survey that you can use on your next project:

        1. On the Welcome Screen, the visitors are greeted with an extended background image of the breathtaking scenery of Nanaimo. The positive impression created by the captivating visuals encourages the visitors to continue their survey participation . The positive survey experience results in a higher survey completion rate!
        2. Location-specific survey participation incentive. You may have considered providing incentives for the public to complete the survey in the form of a reward draw for anyone who enters their contact information. LANARC Consultants and the city offer a reward “one of ten $50 gift cards to a Nanaimo eatery of your choice”. It’s recommended to consider using a reward that only community members can use, such as to a local retailer, to avoid ballot box stuffing!
        3. Short educational videos and other resources were presented in the Scenario Rating Screen. You can accommodate different learning styles by providing a variety of resources such as videos, PDFs and images. A study found that the human brain processes an image 60,000 times faster than text. By including visually appealing resources into your survey, participants can process the information and data better and more quickly!
        4. Connected indicators to help participants make informed decisions. Explaining scenarios can be a complex undertaking, making the Scenario Rating Screen one of the more time-consuming Screens. After identifying prioirites in the first screen, connecting the indicators in the scenario exploration screen helps participants understand how various indicators perform on the different scenarios, emphasizing which scenario would likely work better in terms of their selected priorities.


      1. Lastly, each marker has easy-to-answer dropdown options on the Map Marker Screen. Participants simply need to click on an option from the list of answers. This reduces the length of the survey and makes it concise, which in turn means more data will be provided. Another advantage of dropdown questions is that they are designed to create easily quantifiable data.

    Congratulations to LANARC Consultants and the City of Nanaimo for an engaging survey using new features and demonstrating best practice for effective online engagement!

    For more great tips on how to make the most out of MetroQuest, contact your Customer Experience manager or reach out for more information!

    Want to learn more about how MetroQuest supports community outreach on your next transportation plan? Check out our recent webinar:

    The Pivotal Role of Public Involvement in the Surface Transportation Bill

    In this webinar, equity and transportation planning experts from Kansas DOT and HDR discuss post-padnemic recovery, the surface transportation bill, and how agencies can prepare a winning strategy!


  • Gauging Community Interest in Active Transportation

    Gauging Community Interest in Active Transportation

    What is active transportation?  

    Active transportation (AT) can be described as any type of transportation where one’s own power is used to move from place to place. Most often, it is used to refer to walking or biking/cycling. Although there is a lot of research describing AT’s many benefits, transportation planning agencies still need a good understanding of community interest to support potential AT plans. Particularly in the post-pandemic era, patterns of transportation behavior have changed, and active transportation is expected to play a bigger role in coming years.

    Before we take a deeper look into how agencies can gauge community interest in active transportation, let’s review the many benefits of AT.

    Benefits of Active Transportation

    There are numerous benefits on many levels attributed to active transportation, including: individual health, social health and cohesion, and support for the transportation system, environment, and economy.  

    AT activities such as walking or biking contribute positively to individual human health; physical activity reduces the risk of obesity, diabetes, heart disease, and stroke, among other chronic health conditions. This not only benefits the health of the individual but the entire public health system at large.

    Further, it tends to increase social exchanges, helping to develop social cohesion, and is widely accessible as there are few costs associated with AT activities, and little or no equipment needed. It also reduces congestion, benefiting the transportation system as well as the environment due to lower greenhouse gas emissions; is emission-free itself, and helps individuals save money on insurance, gas and parking as well as other costs associated with driving single occupancy vehicles.

    Overall, the benefits of active transportation are far-ranging and go beyond the individuals engaging in walking, bike, and other activities, and has positive repercussions for infrastructure and overall social health.

    Gauging Community Interest in Active Transportation

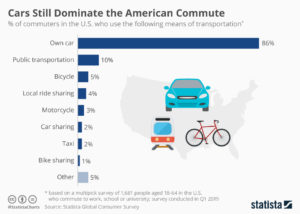
    As of 2019, 86% of commuters in the US used a car as their primary mode of transportation


    People’s interest in active transportation depends on a number of factors. Certainly, comfort levels, personal preference and existing infrastructure play a role. Over the course of the COVID-19 pandemic, many urban areas transformed roads into pedestrian friendly areas, and the trends of transportation preferences are shifting as a result of remote-working and stay-at-home orders. To understand motivations and limitations, many agencies use tools like MetroQuest to create engaging and educating surveys to collect public input.

    For example, Indianapolis MPO has created several surveys around active transportation. A notable example is the Regional Bikeways plan, which updated a plan from 2015 with a proposed additional 2000+ miles of bikeways. The plan is a resource for communities as well as a potential tool for federal funding. The survey was designed to understand preferences for bike infrastructure funding in Central Indiana by receiving data-driven project prioritizations based on public input and identify locations for improved connectivity. Ultimately, this survey received over 1500+ participants!

    The team behind the survey discusses some of their active transportation plans and studies at length in this webinar on Indianapolis MPO’s formula for actionable public input.

    Infrastructure and Active Transportation  

    There are correlations between the built environment and higher levels of active transportation. Mixed land-use leading to more accessible amenities and services, shorter distances between origin and destination, as well as the presence of infrastructure such as sidewalks, crosswalks, or bike lanes all correlate to higher active transportation levels in the community.

    The lack of the same infrastructure creates barriers. Particularly, the lack of sidewalks, crosswalks or dedicated bike lanes is a major deterrent as people fear for their safety. The role of active transportation infrastructure is well studied. Documents show that dedicated bike lanes or boulevards or other paths separate from roads are correlated with increased levels of biking. In addition, other factors include intersection density, traffic calming features, and population density. In another of Indianapolis MPO’s active transportation surveys, the team found that lack of amenities, unsafe intersections or crossings, traffic conditions, and perceived crash risk, along with poor health were also cited as barriers.

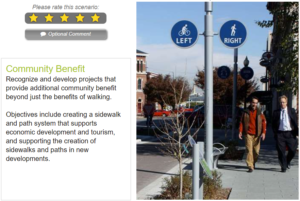
    Indianapolis MPO asked community members to rank pedestrian plan goals, such as community benefits, quality of life, and safety


    To try out the agency’s survey for yourself, take a look at this demo. This version does not collect data.


    Active transportation has benefits for individuals as well as communities, from personal health, to increased social exchanges, to benefits on a wider scale. As transportation patterns shift, methods and tools that support a better understanding of community interest in alternative transportation, transit, or pedestrian/biking infrastructure, will support agencies in building communities that meets the needs of their people.


    What do you think is the future of active transportation? Let us know in the comments!