Author: Bailey Macgillivray

  • How to Host a Dynamic Virtual Event For Community Engagement Success

    How to Host a Dynamic Virtual Event For Community Engagement Success

    Grace Lau is the Director of Growth Content at Dialpad, an AI-powered cloud communication and computer telephony integration (CTI) platform for better and easier team collaboration. She has over 10 years of experience in content writing and strategy. Currently, she is responsible for leading branded and editorial content strategies, partnering with SEO and Ops teams to build and nurture content. Here is her LinkedIn.


    The changing world has led to the rise of virtual events, yet hosting one for the first time can be daunting. Fortunately, although different, hosting a virtual event is more similar to the physical events we’re familiar with than many of us realize. Public meetings, for example, have shifted to hybrid or virtual versions with success.

    That being said, there are certain important things to consider to make sure your virtual event is as engaging and dynamic as possible. This guide has been created to help you with this.

    Virtual Events: Are They Here to Stay?

    Despite the in-person world beginning to open up again, people have now discovered that some things actually work better online. From book festivals to training conferences and even intimate concerts, it seems virtual events will be sticking around in one form or another for a while longer.

    After all, they have the unique benefits of being globally accessible, requiring fewer set-up costs and traveling fees, and of being easily recorded for future viewing. Those are not benefits to be scoffed at.

    Virtual events, managed well, can also increase your opportunity to interact with and engage the community, build a longer-term relationship, and develop a feedback loop that benefits both planners and community members. By being online, the transition from the build-up to post-event can be made much smoother.

    For this reason, among others, many are looking ahead at virtual events as here to stay!



    The Pre-Event: Six Ways to Get the Community Involved

    So, where to begin? There’s no need to wait for the event to get going before starting successful online community engagement. From your first point of contact, open the conversation with participants and get them involved. Encourage them to promote your event and to get others excited too. Community-driven engagement is very effective.

    Let’s look at how you can do this:

    1. Set clear goals from the start

      Why have you decided to host a virtual event? It might seem an obvious question, but having a clear idea of this can help you get your planning team on the same page. Deciding on a goal will identify which parts are essential to your aim and which are bonuses and perhaps don’t need the same level of planning energy.

    2. Choose the right platform to host your virtual event

      Each platform has pros and cons and is suited to different types of events. The perfect platform for putting your team’s virtual celebration ideas into action may not be as ideal for a three-day conference.

      Is screen sharing something that’s going to come in handy or is space for discussion more essential? Looking at your event goals will help pinpoint the features you most need from your virtual event platform and make sure everything runs smoothly.

    3. Choose the right time for your event

      Just because you don’t have to factor in travel time, doesn’t mean any time of day will work. Depending on your audience, different times of days will be more effective. If you’re trying to reach working parents, for example, weekday afternoons will be difficult: consider where your participants likely are, and choose times that you know will work for them.

      Likewise, don’t forget to set timings for your event – allocating time for Q&A sessions, presentations, and breaks will make your event even slicker.
    4. Send out engaging activities before the actual date

      Don’t wait for the big day to get participants involved. Send out social media posts, utilize your email list to share questionnaires or online surveys, or launch a competition ahead of time as part of your marketing strategies, to get participants excited and talking about your event. Set the stage and make it interesting for participants to learn about your virtual event before they even get there!

      Getting your staff and event team involved will make their faces known and help to build that all-important sense of community.

    5. Promote your virtual event

      No one will come to your event if they don’t know it’s going on. Promote it across your channels and encourage those signed up to do the same. Cognitive automation can make this simple by working out where promotions will be most visible and when to publish them.

      Include information that will draw in the audience you want, such as key speakers, workshop topics, and clear directions on how to register. If you’re trying to generate attendance among hard-to-reach communities, use tactics like partnering with community groups, targeted social advertising, or even mix it up with some in-person promotions at community centers, at transit stations, or other public places in the neighbourhood.

    6. Prepare backup plans

      We all know technology doesn’t always go to plan. All it takes is a weak internet connection or badly timed update and the best-planned virtual event can fall to pieces.

      Prepare alternatives for these worst-case scenarios, including sharing plans for workshops with multiple co-leaders, testing your conference call services beforehand, and providing clear guidance on what participants should do if worst comes to worst. Ensure a top-notch customer experience platform.


    Here’s How You Make Virtual Events Engaging:

    Onto the event itself. You may be familiar with ‘virtual meeting fatigue’. The last thing you want is for that to set in.

    By keeping things exciting and engaging, you should ensure everyone stays awake and paying attention. But how?



    Get moderators for your event

    You can employ moderators for all aspects of your virtual event, from corresponding with speakers or fixing mic echo to keeping an eye on chat rooms for unsavory comments, encouraging participants to share their input, and helping educate on how to use various engagement tools. Essentially, their role is to make sure the event runs smoothly.

    It’s likely you already have members of your planning team taking on moderator roles; however, you may want a few extra people on hand on the day.

    Have a fun, engaging program

    If you look at your program and yawn, you can only imagine what participants are going to think. Intersperse talks or seminars with activities that require audience participation or response, and make sure your event is suitable for a range of attention spans.

    You might want to set challenges or activities that can be peppered throughout longer presentations or allow time for reflection after a particularly jam-packed session.

    Involve your speakers and audience equally

    Q&As are super popular ways to foster discussion within the group, helping everyone to get the most from your virtual event. The depth and breadth of opinions and knowledge sat in the audience may surprise you.

    By providing space for conversation, questioning, and sharing ideas, you may find your speakers come away having learned something too!

    Have an “ask me anything” (AMA) session at the end

    AMAs started as part of a subreddit but have risen to fame due to the interest they bring and the opportunity they give askers. They encourage questions not directly related to the topic and can lead to really interesting answers.

    Where appropriate, an AMA session after the event where participants can ask additional questions can provide a place of transparency and ongoing communication that your team can monitor and respond.



    It All Starts With a Virtual Event…

    By now, you should see that virtual events aren’t all quizzes and “I think you’re on mute”. All it takes is a bit of planning to host a dynamic event and engage your community.

    Although the event is a key part of the process, it’s not the only part. Ultimately, community is built through the bits in between events and how you keep people interacting. Developing this takes time and consistent effort but is well worth it in the long run.
  • [SURVEY OF THE MONTH] Shaping the Transportation Future of the Memphis Area

    [SURVEY OF THE MONTH] Shaping the Transportation Future of the Memphis Area

    The Survey of the Month series is a monthly blog where we highlight the extraordinary work our customers are doing! We feature well-designed surveys and share takeaways that are relevant for anyone interested in making the most out of online engagement using MetroQuest’s survey platform. To see more in the series, visit the blogs here.

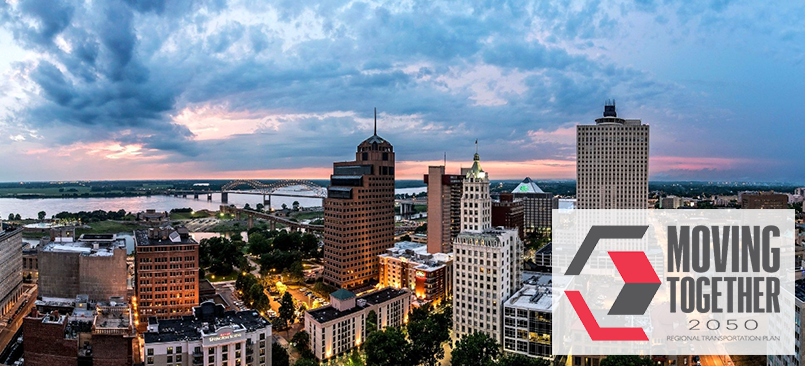
    This month, we are sharing a long-range transportation plan initiative led by the Memphis Urban Area Metropolitan Planning Organization (MPO) for the Mid-South Region, an area spanning southwestern Tennessee and northwestern Mississippi.


    The Moving Together: 2050 Regional Transportation Plan (RTP) sought feedback on future transportation priorities, broad ideas and potential enhancements with the goal of improving overall transportation conditions in the Mid-South Region.

    The team launched a MetroQuest survey at the start of 2022, and it demonstrated clearly that a survey can be quick to complete yet still collect thousands of data points to inform future planning. Every day we are bombarded with constant notifications and information from social media, traditional media, family, friends, and work. Today, surveys must compete with a ton of other priorities. That’s why MetroQuest’s fun, interactive surveys are so effective at turning initial visitors into actual survey participants.

    Below, we will showcase why the Moving Together 2050 RTP Survey was such a great example of an easy-to-digest format that still collected key feedback by engaging over 500 people!

    The secret? A fun, engaging survey and a well-thought-out outreach strategy.

    What’s the story? Engaging the Region about Transportation Goals, Objectives and Priorities

    The Moving Together: 2050 RTP is the Mid-South Region’s plan for defining the vision of future transportation in the region. To ensure that recent trends and priorities are reflected in the plan, the RTP is updated every four years.

    The MetroQuest survey was launched on January 6, 2022 and remained open for input until February 11. It gathered a mix of qualitative and quantitative feedback from over 500 participants!

    Before the release of the survey, the MPO had developed an extensive outreach campaign that was aimed towards getting higher engagement and participation levels, as compared to their past outreach efforts. Due to the online nature of the survey, special attention was given to the development of social media and other online content for sharing, with the primary focus to make the information catchy and interesting. Beyond sharing the survey through daily posts on the MPO’s social media accounts, the MPO also:

    • Partnered with its member agencies, which in turn shared the MPO’s postings on their social media accounts;
    • Featured the survey in local agency newsletters;
    • Distributed posters with a QR code to the survey to the major libraries and community centers;
    • Added a website pop-up notification with a survey link;
    • Promoted the survey on the Nextdoor App, a new tool that had not been used in past efforts.


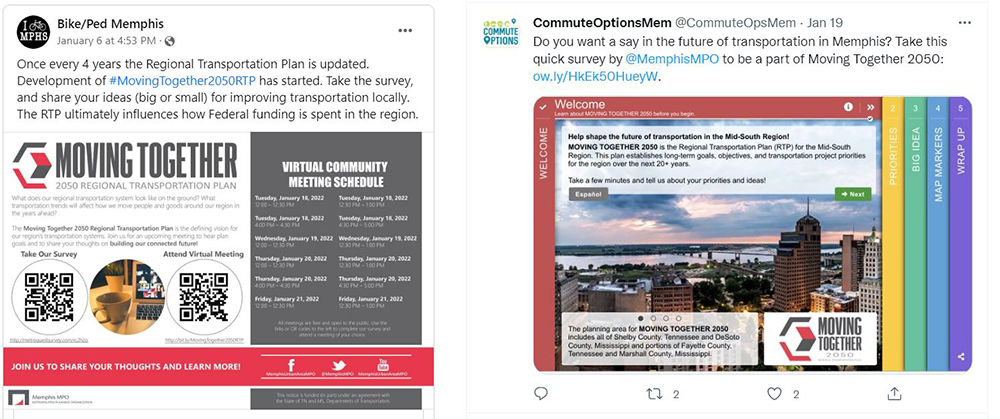
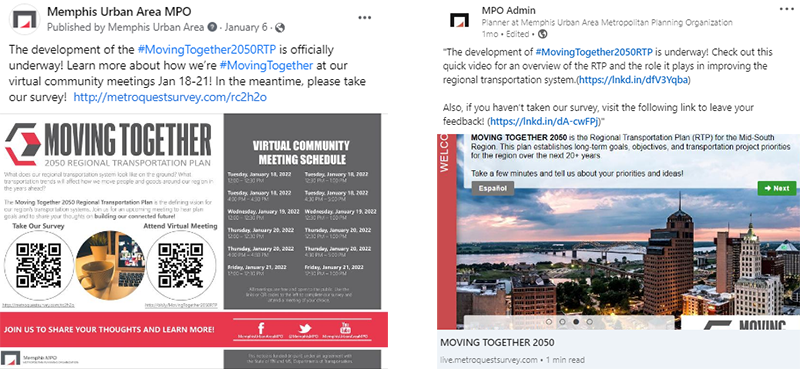
    See below for some examples of the social media posts shared by Memphis MPO and partner organizations during the engagement process.


    Example social media posts on Twitter, Facebook and LinkedIn


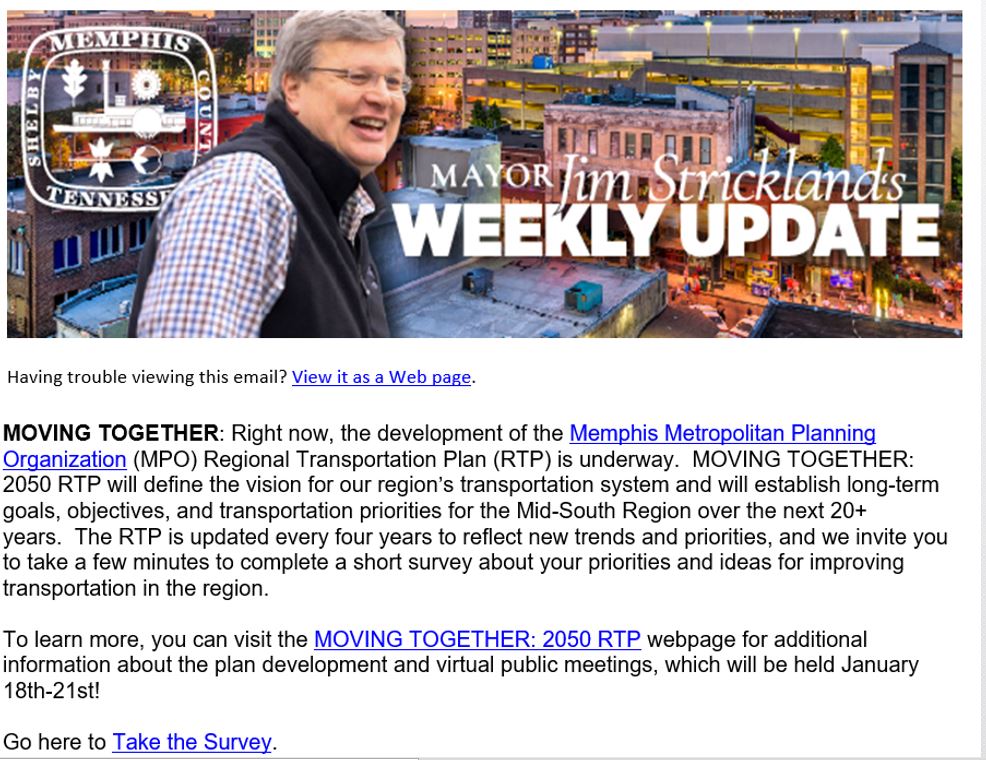
    Inclusion in the Memphis Mayor’s Newsletter


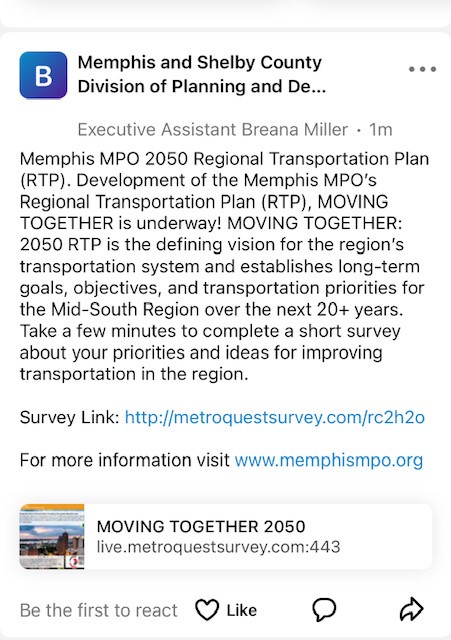
    Post on Nextdoor App


    This campaign strategy exemplifies how a well-planned, comprehensive outreach campaign is key to ensuring your survey reaches your audience and engages hundreds, if not thousands, of participants and gathers the input you need to move your project along.

    To learn more about this initiative, visit the Moving Together: 2050 Regional Transportation Plan webpage.

    Anatomy of a Regional Transportation Plan Survey: Gathering key input to help the region continue moving together!

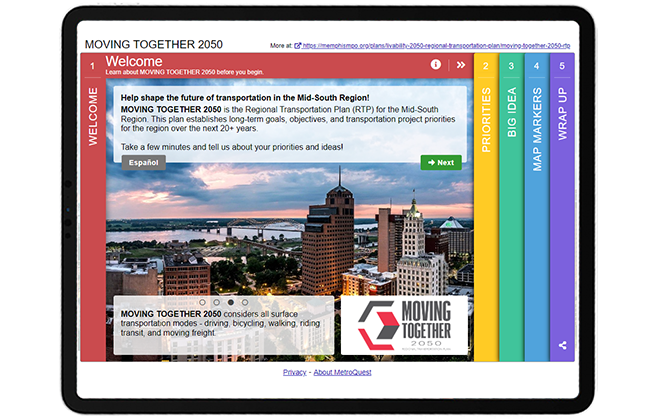
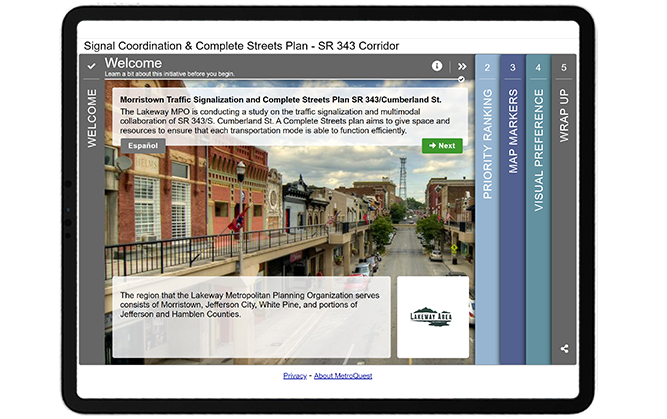
    Right away, the survey draws visitors in with a colorful scheme and captivating Welcome Screen image. This first Screen also features many other key items we recommend: a brief project description, a well-designed project logo and a link to the alternate language version of the survey. You’ll notice that the Screen quotes “a few minutes” for the length of the survey, indicating right at the start that this survey won’t take too long. For the best participant experience, we recommend aiming to create surveys that take approximately 5-minutes to complete.


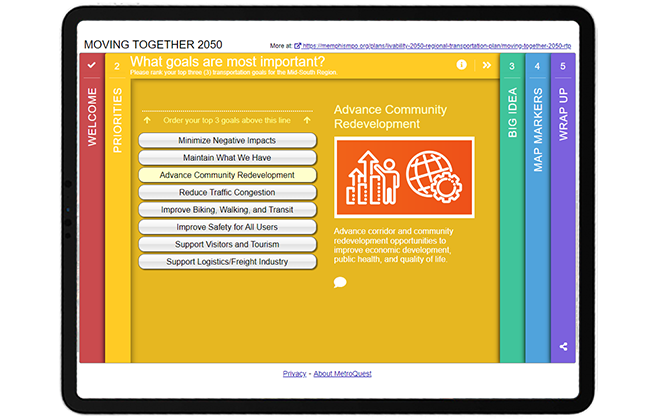
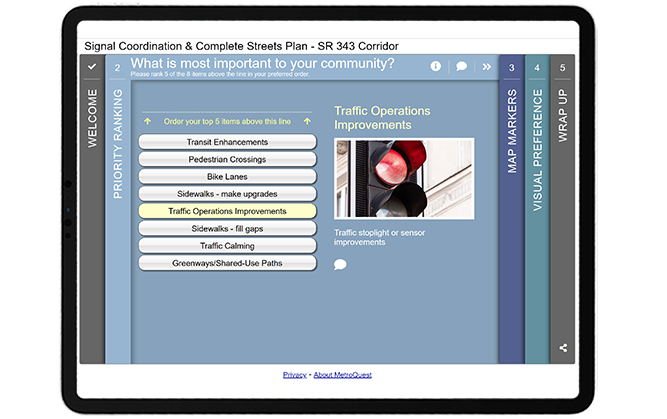
    As with many MetroQuest surveys, the first interactive Screen is a Priority Ranking exercise. The priorities are written in plain language and easy to understand. Each priority is matched with an icon graphic allowing participants to immediately identify the topic. By asking for three of the eight goals to be ranked, the exercise is simple and will elicit actionable data on what goals matter most to the region.


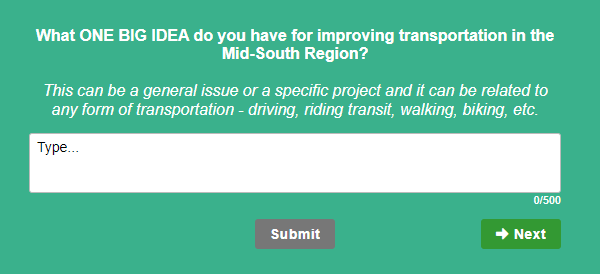
    The middle Screen presents a unique method for open-ended feedback, asking participants to indicate “ONE BIG IDEA” for improving transportation in the Mid-South Region. The Vision Statement Screen is an excellent tool to gather broad qualitative feedback and allow participants to vocalize their opinions entirely in their own words.

    We love how this survey took this Screen and, rather than asking for feedback on a pre-written statement, asked the community to come up with ideas. The question is specific and detailed enough to elicit quality responses.


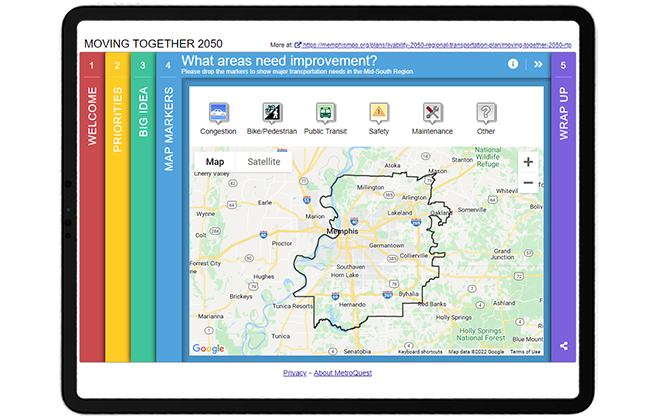
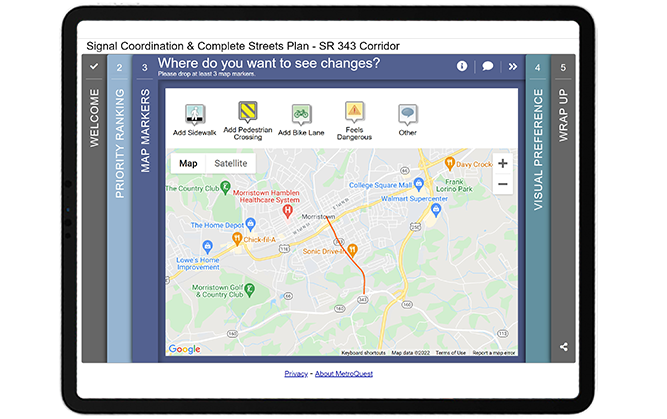
    If you are familiar with MetroQuest surveys, you will likely recognize this fourth Screen—the Map Marker Screen! By placing this Screen fourth, participants had a chance to warm up to the project and prepare their thoughts to provide specific location-based data about transportation improvements. Six different markers allow for a huge range of data on various improvements needed for: traffic congestion, bike/pedestrian transportation, public transit, safety and maintenance.


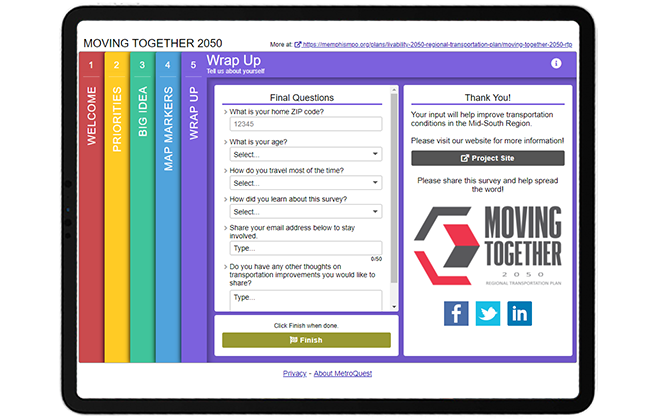
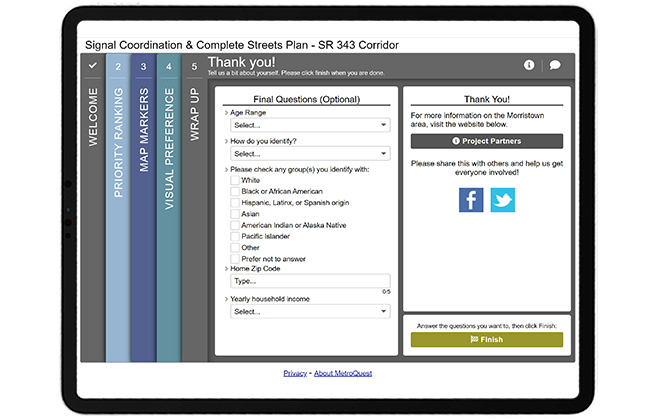
    As with all MetroQuest surveys, the final Wrap Up Screen provides a space for few quick final questions to gather demographic information, optional contact details and final thoughts.


    Try out the survey yourself through this demo version!


    5 Tips from the Moving Together 2050 Survey: Great Visuals and Quick Activities to Engage Hundreds

    We’ve highlighted many great features of this survey above. Here are five key tips to remember for your future surveys to turn visitors into participants!

    1. Make sure your Welcome Screen is inviting: By featuring eye-catching colors and a beautiful aerial image on the first Screen, participants instantly know this is not your standard survey and will be interested to continue. It is important to make sure your Welcome Screen highlights why you want feedback and that the survey will be quick to take, as this survey introduction indicates.
      2. Use consistent, clear graphics and visuals: The use of icon graphics on the Priority Ranking Screen is an excellent way to include visuals if you don’t have images that represent each topic. Graphics which are all designed in the same color and visual style can help prevent bias that comes from comparing images, as naturally we are always drawn to select the best-looking image.
      3. Write a well-defined question on the Vision Statement Screen: Rather than gathering feedback on a vision statement for the project, this survey took a unique approach with this Screen and asked residents to come up with one big idea. Since this question was written with a direct ask, participants are more likely to provide quality answers. Generally, the more specific you are with open-ended questions, the more precise the feedback will be.
      4. Make sure your Map Marker Screen map is properly centered: The KMZ/KML layer on the Map Marker Screen is automatically centered on the Screen so participants do not need to move or zoom-in/out to see the project area. The black border outline clearly defines the area for input.
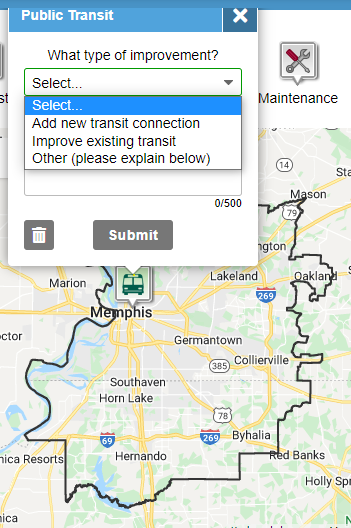
      5. Use dropdown questions on the Map Marker Screen: The Map Marker Screen is an excellent way to gather geospatial data but it’s important to consider what each Marker is asking. We recommend always including a dropdown question (example shown left) in addition to a comment box for each Marker so you can gather a mix of quantitative and qualitative data. Qualitative responses can be time-consuming to analyze so it can be very helpful to also gather data on consistent items to compare in aggregate.

     

    Kudos to the Memphis Urban Area MPO team on their excellent survey design! The Moving Together 2050 survey is a perfect example of how to effectively engage a region about their transportation future while keeping the survey simple and quick to complete.


    For more great tips on how to make the most out of MetroQuest, contact our Customer Experience team or reach out for more information!

    Want to learn more about how MetroQuest supports community outreach on your next transportation plan? Check out our recent webinar:


    Forum on Measuring Public Involvement Effectiveness for Transportation Agencies

    Forum on Measuring Public Involvement Effectiveness for Transportation Agencies

    In this interactive webinar forum, public involvement leaders from TxDOT, NCDOT and GDOT share how agencies can ensure that their public engagement programs are an effective and efficient use of public resources!


    WATCH WEBINAR


  • [SURVEY OF THE MONTH] Envisioning Sustainable Transportation for the San Joaquin Region

    [SURVEY OF THE MONTH] Envisioning Sustainable Transportation for the San Joaquin Region

    The Survey of the Month series is a monthly blog where we highlight the extraordinary work our customers are doing, along with some takeaways that are relevant for anyone interested in making the most out of online engagement using MetroQuest’s survey platform! To see more in the series, visit the blogs here.

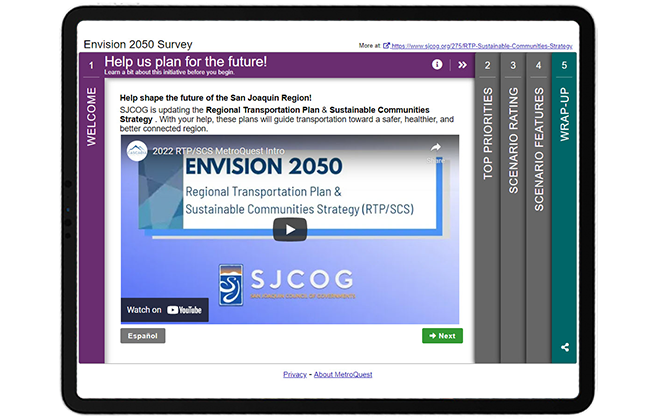
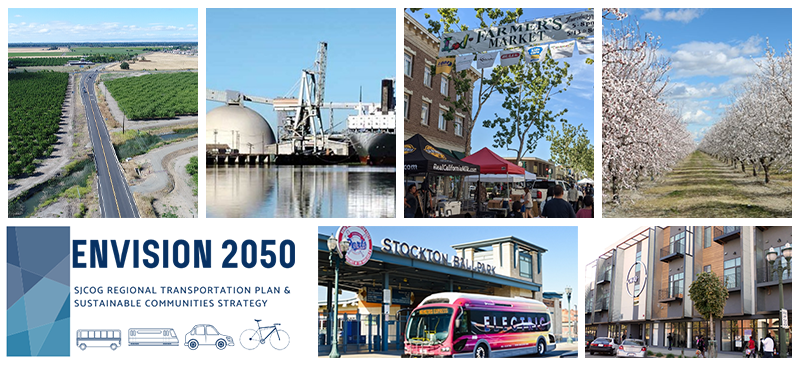
    This month, we are featuring a survey with a unique approach to informing its participants: through the use of videos! Follow along as we introduce you to a survey developed by the San Joaquin Council of Governments (SJCOG) and the consulting team at Cascadia Partners.

    The Envision 2050 survey was launched through MetroQuest during summer 2021 to gather feedback on the 2022 Regional Transportation Plan (RTP) and Sustainable Communities Strategy (SCS) for San Joaquin County, California. This long-range vision and investment plan focuses on the region’s future transportation needs and sustainability targets.


    What’s the story? Planning for a Sustainable Transportation Future

    SJCOG oversees transportation, housing and habitat conservation for the San Joaquin region, which comprises several cities in California east of San Francisco, namely Stockton, Lodi, Manteca, Tracy, Ripon, Escalon, and Lathrop.

    Under the project name Envision 2050, SJCOG is updating their 2022 RTP and SCS, a process undertaken every four years to inform a 30-year land use and transportation plan. In addition to identifying future infrastructure and housing investments, this process has a particular focus on sustainability. The plan must also outline how the region can meet federal and state air quality standards and reduce greenhouse gas emissions.

    The project team used MetroQuest as an essential component of their public participation plan for this comprehensive initiative.

    The Envision 2050 survey sought input from the community on priorities for the region’s future, focusing on four different scenarios for how the region could grow:

    1. Stay the Course
    2. Remake Centers & Corridors
    3. 20-minute Neighborhoods
    4. Commuter Villages

    The survey, offered in English and Spanish, shared information on the different scenarios through short videos and gathered feedback on residents’ level of agreement to each overall scenario and a series of features for each scenario.

    The survey successfully gathered input from over 400* participants and provided valuable data to inform which scenario(s) and strategies would be recommended to the SJCOG Board for the 2022 RTP/SCS.

    Learn more about Envision 2050 and view the survey results on SJCOG’s project website.


    Anatomy of a Comprehensive Land Use Survey: Gathering Feedback on Future Scenarios

    Upon opening the survey, visitors are greeted with a video, embedded front and center on the screen. The video explains how input will be considered and introduces the initiative. This unique approach allows the survey to remain light on text while still providing important background information.

    This approach of starting with a video is particularly advantageous if your project requires a bit more extensive background information up front, and is generally a good practice to include in the Welcome Screen which delivers the first impression of the survey to visitors. Most people are more likely to click on a video rather than read a wall of text, increasing the likelihood of visitors continuing to Screen 2 of the survey!


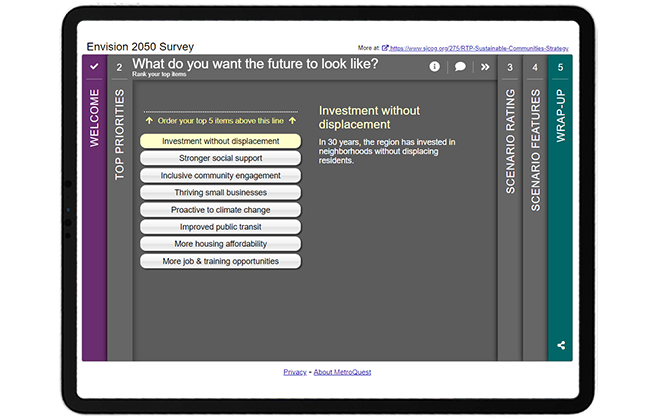
    Like many MetroQuest surveys, participants are introduced to the interactive part of the survey through a Priority Ranking Screen. This simple exercise asks participants to rank their top five of eight items. This activity is especially useful for long-range planning projects as it provides precise data on the priorities of the community. SJCOG’s survey asks for respondents to rank priorities such as improved public transit and more housing affordability among other topics. In many cases, it can be beneficial to include images next to each priority to make this Screen more welcoming and easier to navigate, as well as to appeal to visual learners.


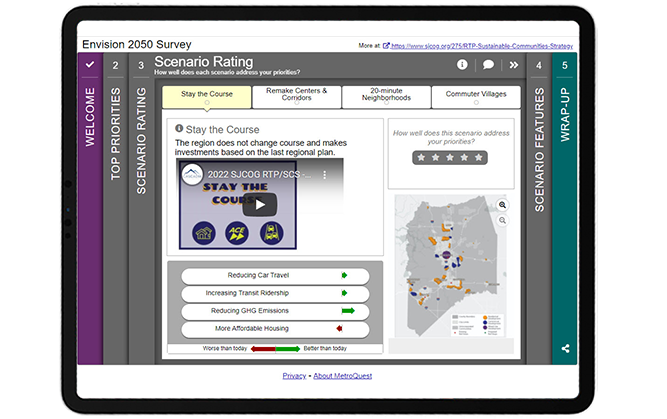
    Screen 3 utilizes MetroQuest’s unique Scenario Rating Screen format which provided a perfect platform for the project team to present all four possible future scenarios. Each of the four tabs on this Screen shares context and information through a brief video description of the scenario, arrow indicators showing how the scenario would impact the community, and a map presenting land-use changes. The most important piece on each tab is the five-star rating scale, where participants can rate whether the scenario addresses their priorities. The engagement team did several things very well on this Screen and on the Survey overall: we will discuss this in more detail later in this blog post.


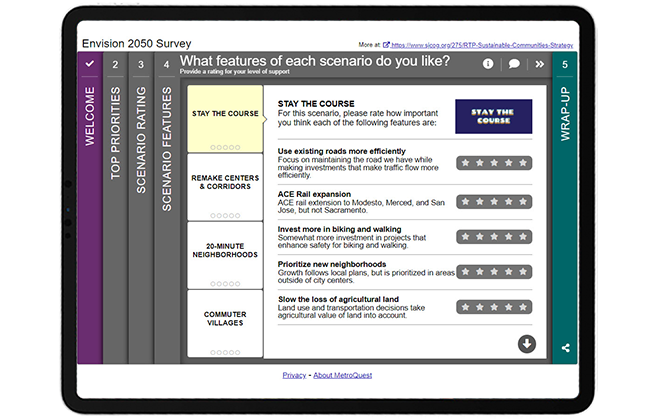
    Following the Scenario Rating Screen, participants are presented with the Strategy Rating Screen which in this case was used to rate various features of the four scenarios presented on the earlier Screen. By using the same consistent names for each scenario, this Screen transitions seamlessly from Screen 3, avoiding any confusion as can often be the case with surveys asking for feedback on various options. Each feature includes a sentence-long description to help explain the impact it would have on the community. You will notice that the images in the top right of this Screen retain the same branding from the videos on the previous Screen. The visual and language consistency throughout the survey is an excellent example of how well-executed, clear content can make a huge difference in helping participants understand a survey and provide valuable feedback.


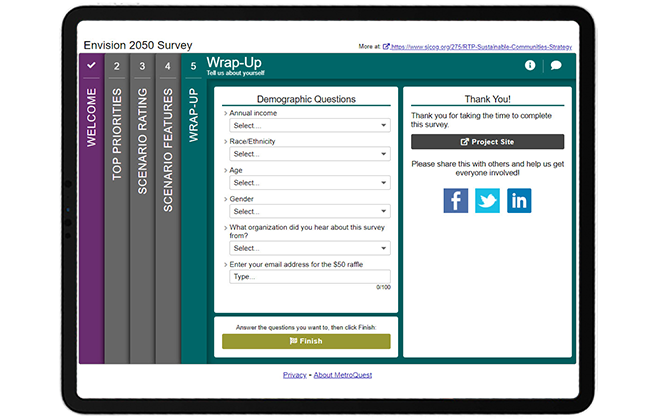
    The last Screen completes the survey with four simple dropdown questions asking for demographic information on income, race/ethnicity, age and gender. It also asks how participants heard about the survey, which can be valuable information to inform future engagement initiatives.


    Try the survey yourself! Complete this demo version of the Envision 2050 survey to try the survey live. Your responses will not impact the survey results. Don’t forget to come back to this tab to keep reading the next section below where we share some helpful takeaways!


    5 Tips from the Envision 2050 Survey: Engaging Videos and Consistent Content Makes all the Difference!

    The project team successfully used MetroQuest to design a long-range comprehensive survey that was engaging and informative yet quick to complete. Long-range planning is complex and its materials wordy but the use of videos throughout helped participants make an informed decision before providing feedback. Additionally, planning for the future can often feel abstract and far away. To allow participants to better imagine the reality of each scenario, the videos included on the Scenario Rating Screen were narrated in the voice of someone from the future. These types of features are just a few examples of what set this survey apart and contributed to an overall interactive participant experience.

    Here are 5 takeaways from this survey to keep in mind when you design your next survey:

    1. As mentioned above, this survey featured five embedded videos, all under one minute in length. The inclusion of videos eliminates the need for a significant amount of text, adding to the interactive and engaging tone of the survey. By keeping the videos short, the SJCOG team successfully ensured their survey remained quick to complete, increasing the likelihood of receiving high-quality feedback. Additionally, the inclusion of text in the videos allows the survey to remain accessible for the hearing impaired. Embedding videos is explained on our support website.
    2. Consistency was key with this survey! Since many participants learn about an initiative at the time of taking a survey, especially in this age of virtual engagement, it is crucial to keep terminology and naming consistent and simple to avoid any confusion. Consistent naming of the four scenarios throughout the survey and consistent branding with differentiated colors for each scenario helps tie everything together. These small design elements can be the difference between someone understanding the survey and providing accurate feedback or someone getting confused and giving up on the survey prematurely.
    3. One of the primary features of the Scenario Rating Screen (Screen 3 in this survey) and a unique feature of MetroQuest is the green and red arrow indicators that show how each scenario impacts the community differently. This survey makes great use of this feature by showing how every scenario would impact four important factors: reducing car travel, increasing transit ridership, reducing GHG emissions and more affordable housing. Participants could weigh their preference for each scenario by looking at whether the factors would be worse or better than today.
    4. Also on the Scenario Rating Screen, the project team included map images showing different zoning areas and boundaries for each future scenario. By utilizing a consistent map format that was sized and formatted the same way in each of the four tabs, participants can easily flip between scenarios to see how the map changes. This too helps participants identify which of the scenarios most aligns with the future they wish to see.
    5. The fourth survey Screen utilizes the Strategy Rating Screen, gathering ratings on several features for each of the four future scenarios. This Screen continued to use consistent naming and branding to ensure a smooth transition from the previous Screen and that respondents could differentiate between the options. Including concise, action-oriented descriptions for each feature allows for well-educated feedback and, subsequently, quality data!


    Congratulations to the project team at SJCOG and Cascadia Partners for creating a fun and interactive MetroQuest survey! Their use of videos brought the future of the San Joaquin region to life and most importantly helped their team collect important community input.

    For more great tips on how to make the most out of MetroQuest, contact our Customer Experience team or reach out for more information!


    * This survey was a target of what is known as ballot-box stuffing, an infrequent but persistent issue where duplicate or fraudulent responses are submitted to skew results or increase changes of winning a monetary incentive offered to survey takers. In this case, it was likely the latter, as a $50 raffle was offered to participants. In total, over 4,000 participants interacted with the survey but many had to be filtered from the final data set, resulting in approximately 400 valid participants. If your organization is considering offering an incentive for your survey respondents, we recommend using local prizes that only someone in your community could use. We have found that non-location-specific rewards such as cash or a gift card to a nation-wide or online retailer often encourage ballot-box stuffing. Rest assured, if ballot box stuffing should occur with your survey, MetroQuest has steps to address it to ensure data integrity.


    Want to learn more about how MetroQuest supports community outreach on your next transportation plan? Check out our recent webinar:

    The Key TO Great Public Engagement Results:
    How KYTC Engaged 8300+

    The Kentucky Statewide Transportation survey collected more than 140,457 public responses and comments in just over a month! In this webinar, the team shares the complete process that led to this public engagement success.


    WATCH WEBINAR


  • TRB 2022 Annual Meeting: Through the Lens of the AJE40 Committee

    TRB 2022 Annual Meeting: Through the Lens of the AJE40 Committee

    Jeff Moore, AICP, is the chair of the Committee on Public Engagement and Communications with the Transportation Research Board. He has been active with the TRB since 2004. Jeff has also served as a planner with the Division of Planning at the Kentucky Transportation Cabinet, District Three Office, Kentucky for over 31 years. He is currently employed as a transportation planner for Michael Baker International.


    As less than 9,000 attendees cautiously gathered into Washington this past week, we approached this year’s return to an actual in-person TRB Annual Meeting with an attitude of “Grace and Gratitude.”

    As many of the committees, sessions, and workshops struggled with missing presenters and key committee members, COVID19 safety protocols and attempts to virtually reach out to those not able to attend, we approached each of these challenges with a sense of grace that best efforts were made and at times worked well, and other instances were at least brave attempts. At the end of the experience, we all were filled with a sense of gratitude for the opportunity to reconnect with long-missed friends and colleagues, the ability to share our lessons learned, and the realization that many of us are making it to the other side of the past two years’ worth of difficulties.

    “Despite some sessions being canceled, it still turned out to be a great conference. It was great to see colleagues I haven’t seen in 2 years”

    — Jamille A. Robbins, Public Involvement, Community Studies & Visualization Group Leader, N.C. Department of Transportation


    Identifying the Goals of the 2022 TRB Executive Committee

    With an eye toward the beginning of the second century of TRB and in response to the massive societal and economic shifts resulting from the past two years of difficulties, the TRB Executive Committee is commencing early work on the identification of the Critical Issues in Transportation.

    This effort will focus on five broader societal goals:

    1. Safety and Security;
    2. Public Health;
    3. Economic and Societal Vitality;
    4. Climate Change; and,
    5. Equity.

    Additionally, TRB is embarking on a new Strategic Plan. Goals for the plan include:

    1. Preparing to address current and future issues;
    2. Expanding TRB’s impact; and
    3. Assuring continued creativity, resilience, and sustainability.

    Despite the lower attendance, the TRB 2022 Annual Meeting program contained 350 sessions and workshops and more than 300 committee meetings.


    Activities of the AJE40 Committee at the TRB 2022 Annual Meeting

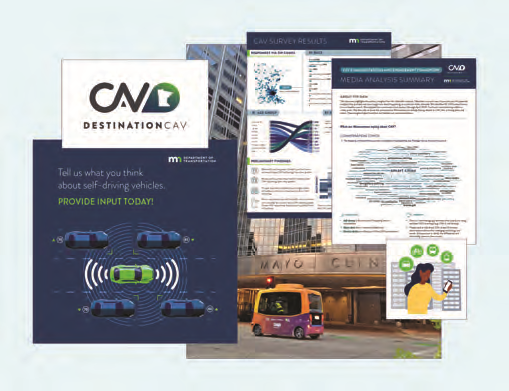
    The AJE40 Committee provided a session spotlighting the winning and runner-up entries to the 15th Annual Communicating Concepts to “Jane and John Q. Public Competition”. Presenters at this session shared communication efforts in support of connected and autonomous vehicles, a re-imagining of an urban interstate highway corridor, a series of on-line chats in support of a MPO long-range transportation plan, and the creative melding of a local poet’s work into a video designed to inspire participation in the planning for a bus rapid transit line. The winner of this year’s competition was “Let’s Talk About CAV: Understanding Minnesotans’ Perspectives of Connected and Automated Vehicle Technologies” presented by Katie Caskey of HDR and Tara Olds of Minnesota DOT.


    The AJE40 committee assembled a poster session that included several informative posters received during the call for posters and posters spotlighting the competition winner and the other five noteworthy projects featured in the “Jane and John Q. Public Competition” session.

    • Competition Winner: Let’s Talk About CAV: Understanding Minnesotans’ Perspectives of Connected and Automated Vehicle Technologies; Katie Caskey, HDR and Tara Olds, Minnesota DOT
    • Runner up: PAVE Virtual Panel Series; Tara Andringa, Partners for Automated Vehicle Education
    • Runner up: Tuesday Traffic Jam; Corinne Tucker, Sarasota/Manatee Metropolitan Planning Organization
    • Honorable Mention: Lowcountry Rapid Transit Video; Samantha Dubay, HDR and Sharon Hollis, Berkeley-Charleston-Dorchester Council of Governments
    • Honorable Mention: Interstate 680 – Effective Communications Backed by Behavioral Science; Linsey Willis, Contra Costa Transportation Authority and Rebecca Krawiec, Convey, Inc.

    To learn more about some of these projects, check out the Award Recipients highlights.

    The committee partnered for this year’s annual meeting with AME60 (the Committee on Historic and Archeological Preservation in Transportation), AME80 (the Committee on Community Resources and Impacts), and AME10 (the Committee on Equity in Transportation) to produce an interactive workshop in which participants worked collaboratively in small groups to develop public engagement plans for two project scenarios that involved possible impacts to historic or archeological resources such as Native American burial sites, an established artist collaborative, and historic neighborhoods. Much effort went into the planning and execution of the workshop under the collaborative leadership of Michael Garua (Kimley-Horn) and Rusty Ennemoser (Florida DOT) from the AJE40 Committee and Linda Henderson (Texas DOT) and Rebekah Dobrasko (Texas DOT) from the AME60 Committee.


    “The focus of the workshop was to learn from each other about the slice of public engagement each of us does in our daily work and create a roadmap for communicating with the public about our projects from planning through construction. The primary takeaway is that early outreach and communication is imperative to identify what’s important to the community so that solutions can be identified before the project schedule is impacted.”

    —Session Co-Presenter Michael Garau, P.E., Kimley-Horn

    In addition to the sessions and workshop, the committee was able to meet in-person with many of its members and friends.


    Upcoming Work on Equity, Online Public Engagement Tools, and more

    One of the major topics of discussion during the meeting of the AJE40 committee was the success of the Conference on Advancing Transportation Equity (CATE) which had been held in early September of 2021. The committee was one of the three key sponsoring committees for the conference and plans are underway to move toward on-going efforts to address the issue of equity and would include a regularly scheduled major conference event.

    The agenda of the committee included reports from the committee task forces on Research and on Education. The Research Task force included updates on Project 08-142 Best Practices for Using Online Tools in Public Involvement Processes, which is currently underway with Rutgers University as the principal investigator and a targeted completion in the spring of 2024; and on the implementation of NCHRP Report 905: Measuring the Effectiveness of Public Involvement in Transportation Planning & Development. The 905 Implementation project is in progress with the DOTs of North Carolina, Georgia, Utah, Texas, and Arizona participating. A report will be compiled with the findings from the implementation of the tools developed as part of the NCHRP 905 project.

    NCHRP 08-161: Identify Emerging Approaches for Public Engagement to Meaningfully Involve Minorities, Low-Income, and Other Vulnerable Populations is another committee-sponsored research project that is anticipated to be underway soon. Additionally, the AJE40 committee is currently collaborating with the Committee on Visualization in Transportation to propose a synthesis project to examine the current state of the practice of using visualization tools and techniques in public engagement and communications.

    The committee’s task force on Education shared their work on the development of a possible public engagement curriculum module for university-level engineering and planning students. A survey was conducted of engineering and planning faculty to understand the need for educational resources on public involvement. One insight learned from the survey is that college professors and educators understand the need for students to learn about public engagement, and that there is a desire to use educational resources developed by others.

    During the upcoming year, the task force will work to complete a Public Involvement 101 video presentation that could be used in engineering and planning courses. The video would focus on answering the following questions: What is public involvement; Why it is important; How it could affect your project; and What does public involvement look like. The task force also developed conceptual definitions of “engagement” and “communications” which have been incorporated into the forthcoming Triennial Strategic Plan for the Committee.

    Additional information on the activities of the TRB AJE40 Standing Committee on Public Engagement and Communications can be found through the committee website.

  • Gauging Community Interest in Active Transportation

    Gauging Community Interest in Active Transportation

    What is active transportation?  

    Active transportation (AT) can be described as any type of transportation where one’s own power is used to move from place to place. Most often, it is used to refer to walking or biking/cycling. Although there is a lot of research describing AT’s many benefits, transportation planning agencies still need a good understanding of community interest to support potential AT plans. Particularly in the post-pandemic era, patterns of transportation behavior have changed, and active transportation is expected to play a bigger role in coming years.

    Before we take a deeper look into how agencies can gauge community interest in active transportation, let’s review the many benefits of AT.

    Benefits of Active Transportation

    There are numerous benefits on many levels attributed to active transportation, including: individual health, social health and cohesion, and support for the transportation system, environment, and economy.  

    AT activities such as walking or biking contribute positively to individual human health; physical activity reduces the risk of obesity, diabetes, heart disease, and stroke, among other chronic health conditions. This not only benefits the health of the individual but the entire public health system at large.

    Further, it tends to increase social exchanges, helping to develop social cohesion, and is widely accessible as there are few costs associated with AT activities, and little or no equipment needed. It also reduces congestion, benefiting the transportation system as well as the environment due to lower greenhouse gas emissions; is emission-free itself, and helps individuals save money on insurance, gas and parking as well as other costs associated with driving single occupancy vehicles.

    Overall, the benefits of active transportation are far-ranging and go beyond the individuals engaging in walking, bike, and other activities, and has positive repercussions for infrastructure and overall social health.

    Gauging Community Interest in Active Transportation

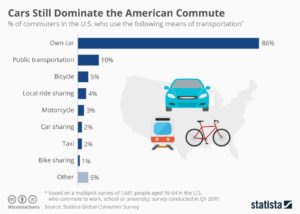
    As of 2019, 86% of commuters in the US used a car as their primary mode of transportation


    People’s interest in active transportation depends on a number of factors. Certainly, comfort levels, personal preference and existing infrastructure play a role. Over the course of the COVID-19 pandemic, many urban areas transformed roads into pedestrian friendly areas, and the trends of transportation preferences are shifting as a result of remote-working and stay-at-home orders. To understand motivations and limitations, many agencies use tools like MetroQuest to create engaging and educating surveys to collect public input.

    For example, Indianapolis MPO has created several surveys around active transportation. A notable example is the Regional Bikeways plan, which updated a plan from 2015 with a proposed additional 2000+ miles of bikeways. The plan is a resource for communities as well as a potential tool for federal funding. The survey was designed to understand preferences for bike infrastructure funding in Central Indiana by receiving data-driven project prioritizations based on public input and identify locations for improved connectivity. Ultimately, this survey received over 1500+ participants!

    The team behind the survey discusses some of their active transportation plans and studies at length in this webinar on Indianapolis MPO’s formula for actionable public input.

    Infrastructure and Active Transportation  

    There are correlations between the built environment and higher levels of active transportation. Mixed land-use leading to more accessible amenities and services, shorter distances between origin and destination, as well as the presence of infrastructure such as sidewalks, crosswalks, or bike lanes all correlate to higher active transportation levels in the community.

    The lack of the same infrastructure creates barriers. Particularly, the lack of sidewalks, crosswalks or dedicated bike lanes is a major deterrent as people fear for their safety. The role of active transportation infrastructure is well studied. Documents show that dedicated bike lanes or boulevards or other paths separate from roads are correlated with increased levels of biking. In addition, other factors include intersection density, traffic calming features, and population density. In another of Indianapolis MPO’s active transportation surveys, the team found that lack of amenities, unsafe intersections or crossings, traffic conditions, and perceived crash risk, along with poor health were also cited as barriers.

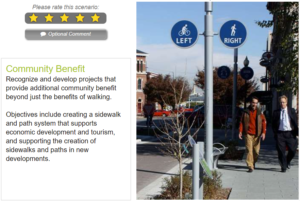
    Indianapolis MPO asked community members to rank pedestrian plan goals, such as community benefits, quality of life, and safety


    To try out the agency’s survey for yourself, take a look at this demo. This version does not collect data.


    Active transportation has benefits for individuals as well as communities, from personal health, to increased social exchanges, to benefits on a wider scale. As transportation patterns shift, methods and tools that support a better understanding of community interest in alternative transportation, transit, or pedestrian/biking infrastructure, will support agencies in building communities that meets the needs of their people.


    What do you think is the future of active transportation? Let us know in the comments!