As 2022 comes to an end, we here at MetroQuest wanted to reflect on the last year and give an inside scoop on what to expect from us in 2023!
It’s clear that equity in public engagement was a big priority this year for the planning industry, and your efforts certainly haven’t gone unnoticed. We’re always thinking of ways to better serve our customers throughout their engagement journey, and we hope to continue to do so in the new year.
Let’s get into our 2022 MQ Wrap-Up, along with some exciting details about our 22.5 Release that will include a fresh, new look coming to MetroQuest Studio at the beginning of 2023!
Inspiring Project Teams to Strive for Equitable Engagement
As online public engagement is always changing, we revised The Beginner’s Guide to Effective Online Engagement in order to paint a full picture of what to consider in your planning. This crash course is the perfect tool to use moving forward in virtual public engagement.
Want to take it a step further? We just recently releasedThe Planner’s Guide to Equity in Public Engagement. We collaborated with experts from over 1,400 agencies to address the barriers and limitations of engaging hard-to-reach audiences and curated a list of implementation methods for equity in public engagement!
Building Virtual Connections and Learning from Them
We couldn’t imagine two years ago how essential our devices would become. However, this shift to digital has made it easier than ever to connect with each other and share stories. When you start your journey with MetroQuest, we don’t underestimate the importance of feeling supported and connected! Our Customer Success Managers are here to guide you along the way. They create meaningful relationships with all our customers and are a valuable part of our identity.
Let’s not forget our webinars that are streamed live with an interactive Q&A session at the end. Take a look at the webinars we did this year, featuring lots of testimonies on engaging difficult-to-reach audiences, increasing inclusivity and accessibility and achieving equitable results.
What’s Coming to MetroQuest in 2023
What to expect from our 22.5 Release? We want MetroQuest to be synonymous with user-friendliness, accessibility and responsiveness. Here’s a sneak peek at what’s coming…
UI Refresh – MetroQuest Studio is getting a User Interface overhaul! Studio will have a new, cleaner look, along with a navigation tab and custom survey lists.
Review Survey – Review Survey is a new tool that will be available in MetroQuest’s Editor. It will alert survey editors of any missing or potentially overflowing content before the survey can be finalized. This tool will allow users to have a shorter Pre-Launch period.
Live Chat – We’re excited to share that soon MetroQuest users will soon get real-time support right in Studio or Editor. A live chat feature built into MetroQuest Studio will allow users to chat with a Support Team member at the click of a button!
Team MetroQuest’s Purpose Moving Forward
Earlier this year, MQ members got together for a team-building exercise. We spent the day having honest and open conversations about what it means to work at MetroQuest and what the company represents in order to define MetroQuest’s purpose and values. Moving forward, we hope 2023 is encompassed with what we stand for: quality, equality, and respect! Our mission will be to continue to support positive change through inclusive engagement in the new year.
The Survey of the Month series is a monthly blog where we highlight the extraordinary work our customers are doing! We feature well-designed surveys and share takeaways that are relevant for anyone interested in making the most out of online engagement using MetroQuest’s survey platform. To see more in the series, visit the blogs here.
What’s the story? Organizations Working Together to Engage Ashe County Residents and Road Users
Logos of all six organizations involved in the survey.
This month, we feature a survey developed jointly by the North Carolina Department of Transportation (NCDOT), one of our longest subscribers, along with Ashe County and High Country Council of Governments (HCCOG). This survey was truly a team effort and an excellent example of statewide and regional organizations working together to plan for future transportation needs.
Ashe County is a mountainous region in northwest North Carolina, along the border of Tennessee and Virginia. The centrally located town, West Jefferson, is located about 113 miles northwest of Charlotte, NC and the area is well-serviced by four major highways.
Comprehensive Transportation Plans, CTPs, are a form of long-range transportation plans. They seek to identify transportation needs and subsequent solutions to address those needs. Input may be gathered at a regional level but often informs statewide planning decisions.
Anatomy of a Comprehensive Transportation Plan Survey: Seeking Feedback on All Things Transportation
Like many CTPs, the Ashe County survey sought a wide range of feedback on everything from vehicle use and public transportation to bicycle and pedestrian movement. The project team successfully engaged over 570 people on the survey that remained open from May 11 to June 30, 2022.
The survey followed a straightforward and logical layout, starting with an inviting and informative Welcome Screen. You may notice a pattern here with surveys starting with a Priority Ranking Screen, and there is a good reason for that! It is a very effective exercise to gather clear and actionable data, which also acts as a simple introductory activity. Then, a Strategy Rating Screen was utilized to gather ratings on 16 statements, and finally, a Map Marker Screen allowed participants to provide location-specific data. As with all MetroQuest surveys, demographic questions are asked on the final Wrap Up Screen.
We’ll focus on each Screen and highlight some key takeaways for your next survey!
Screen 1: Welcome
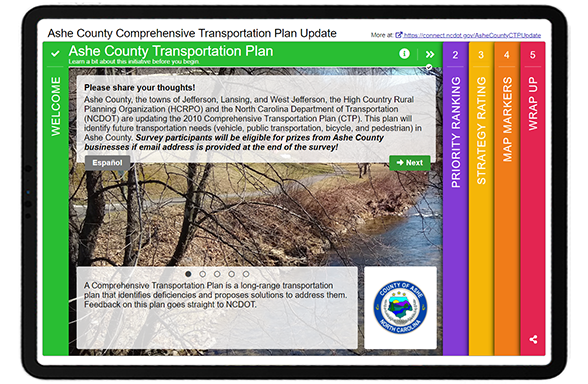
Similar to our example from last month, bright colors instantly draw you into the survey! They also subconsciously communicate to participants that this will not be another “boring” transportation survey. A wealth of information is shared on this upfront Screen, yet the format ensures it does not appear as a wall of text. The team relayed some key details here, including:
Who is conducting the plan/survey
What a CTP is
How input will be considered
The CTP vision statement
They also note that those who complete the survey will be eligible for prizes from businesses in Ashe County. When considering a contest for participants, we always recommend offering local prizes, as was done here. When you offer a prize that can be spent from anywhere, such as an Amazon gift card, you increase the risk of ballot box stuffing or bots taking your survey multiple times to win the prize. By keeping your prize as something that can only be useful to someone living in the project area, your risk of ballot box stuffing remains low.
Notice this Screen also offers a link to the Spanish version of the survey.
Screen 2: Priority Ranking
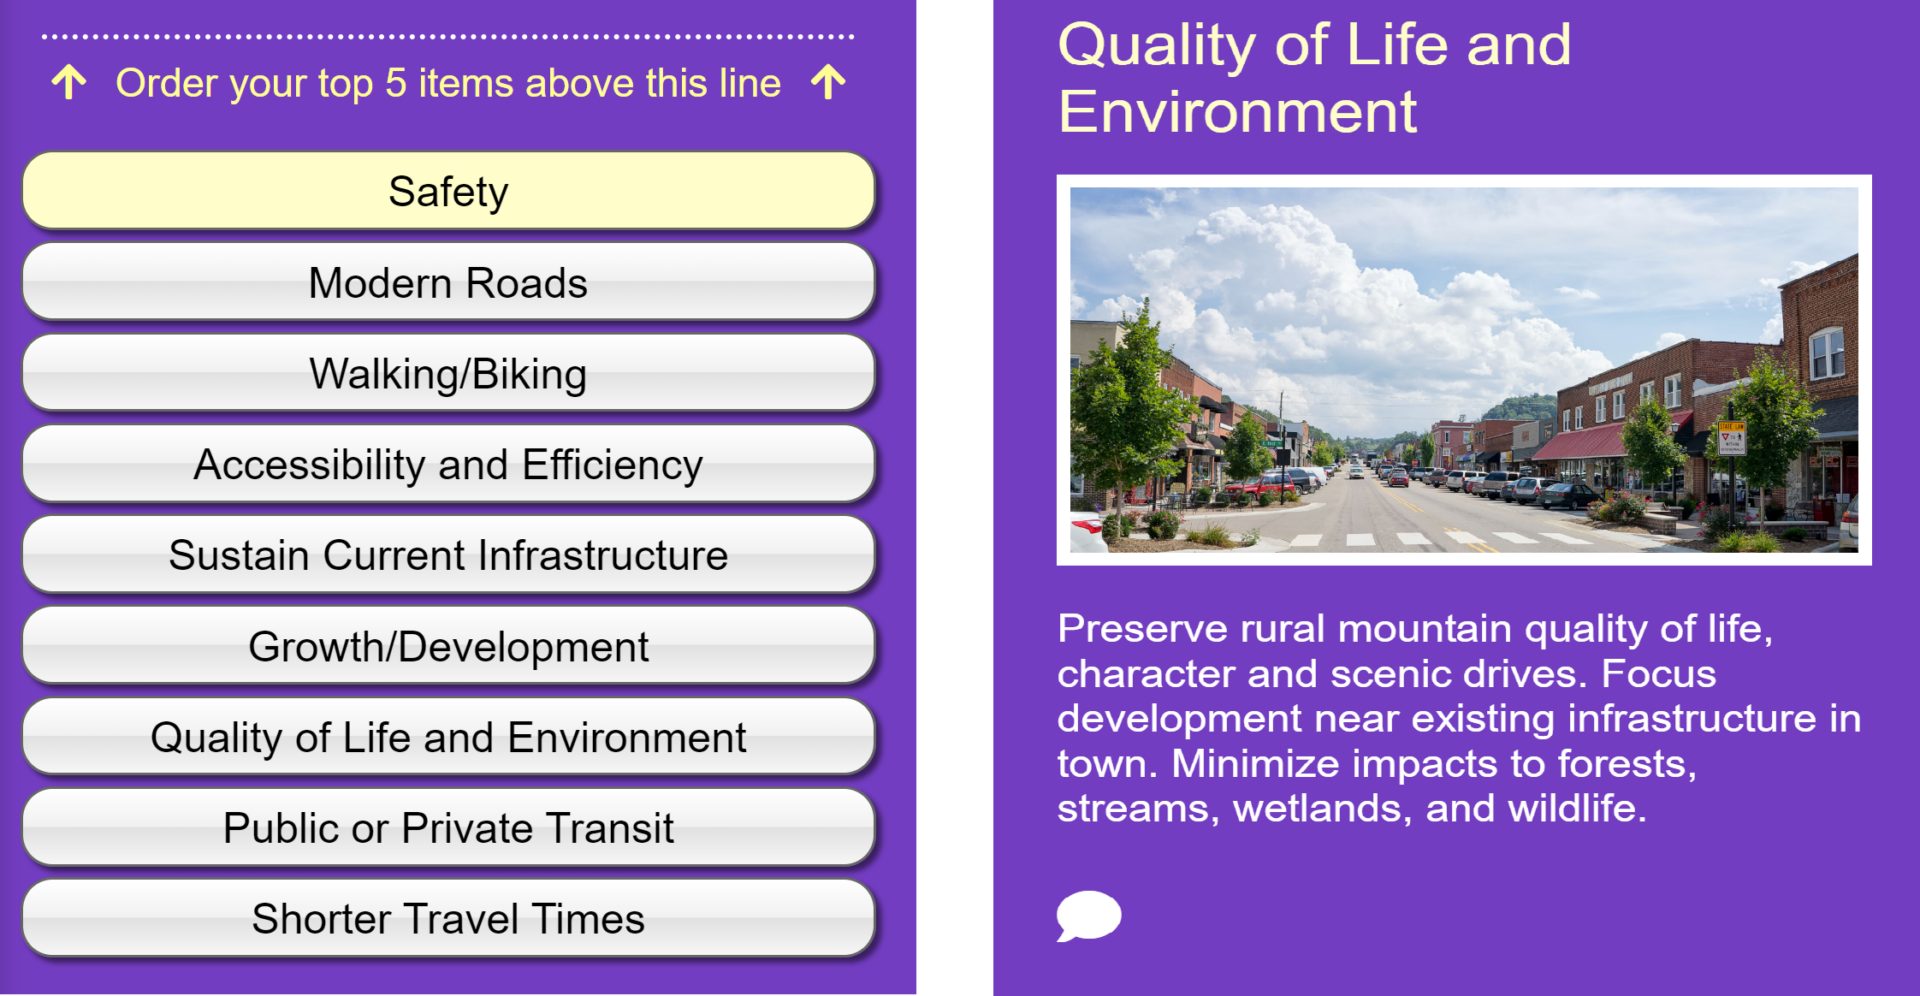
As noted above, the Priority Ranking Screen offers a great starting point for participants. In this case, they were asked to rank their top five of the following nine priorities as presented in the left image. Each priority is accompanied by an image and a concise yet informative statement, such as this one shown for the Quality of Life and Environment.
[LEFT] List of items to prioritize: safety, modern roads, walking/biking, accessibility and efficiency, sustain current infrastructure, growth/development, quality of live and environment, public or private transit, and shorter travel times. [RIGHT] Screenshot of the content and description for the “quality of life and environment” priority.
Screen 3: Strategy Rating
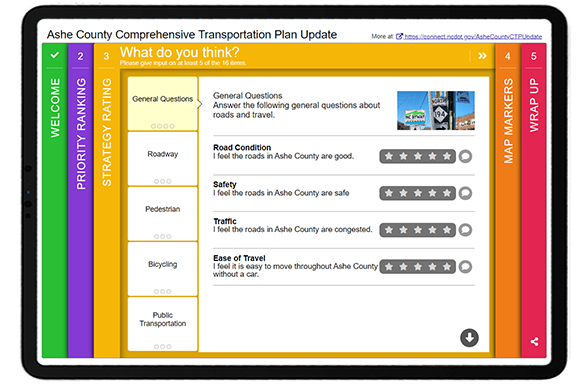
The Strategy Rating Screen is also one of our most popular activities! It allows you to gather a large volume of quantitative data efficiently. While it works well for strategies, it can also be used for general sentiment statements and gathering opinions on infrastructure options.
This survey gathered feedback on five main categories:
General questions (e.g. overall road condition and congestion)
Roadway (e.g. road improvements and widening)
Pedestrian (e.g. more sidewalks and improved pedestrian connections)
Bicycling (e.g. bike lanes and types of paths)
Public Transportation (e.g. expanded use and transit vs. vehicle space)
* Tip – if you are considering the Strategy Rating Screen but want more of a visual focus, try out our Image Rating Screen. It’s a similar question format that allows for larger images.
Screen 4: Map Marker
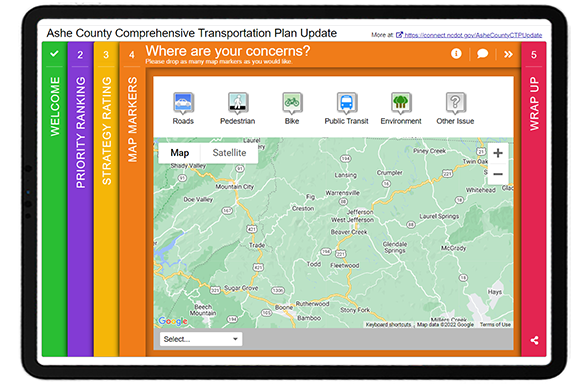
Continuing with the same topic areas, the Map Marker Screen allowed participants to visually drop markers where they had experienced issues and explain what they encountered in more detail.
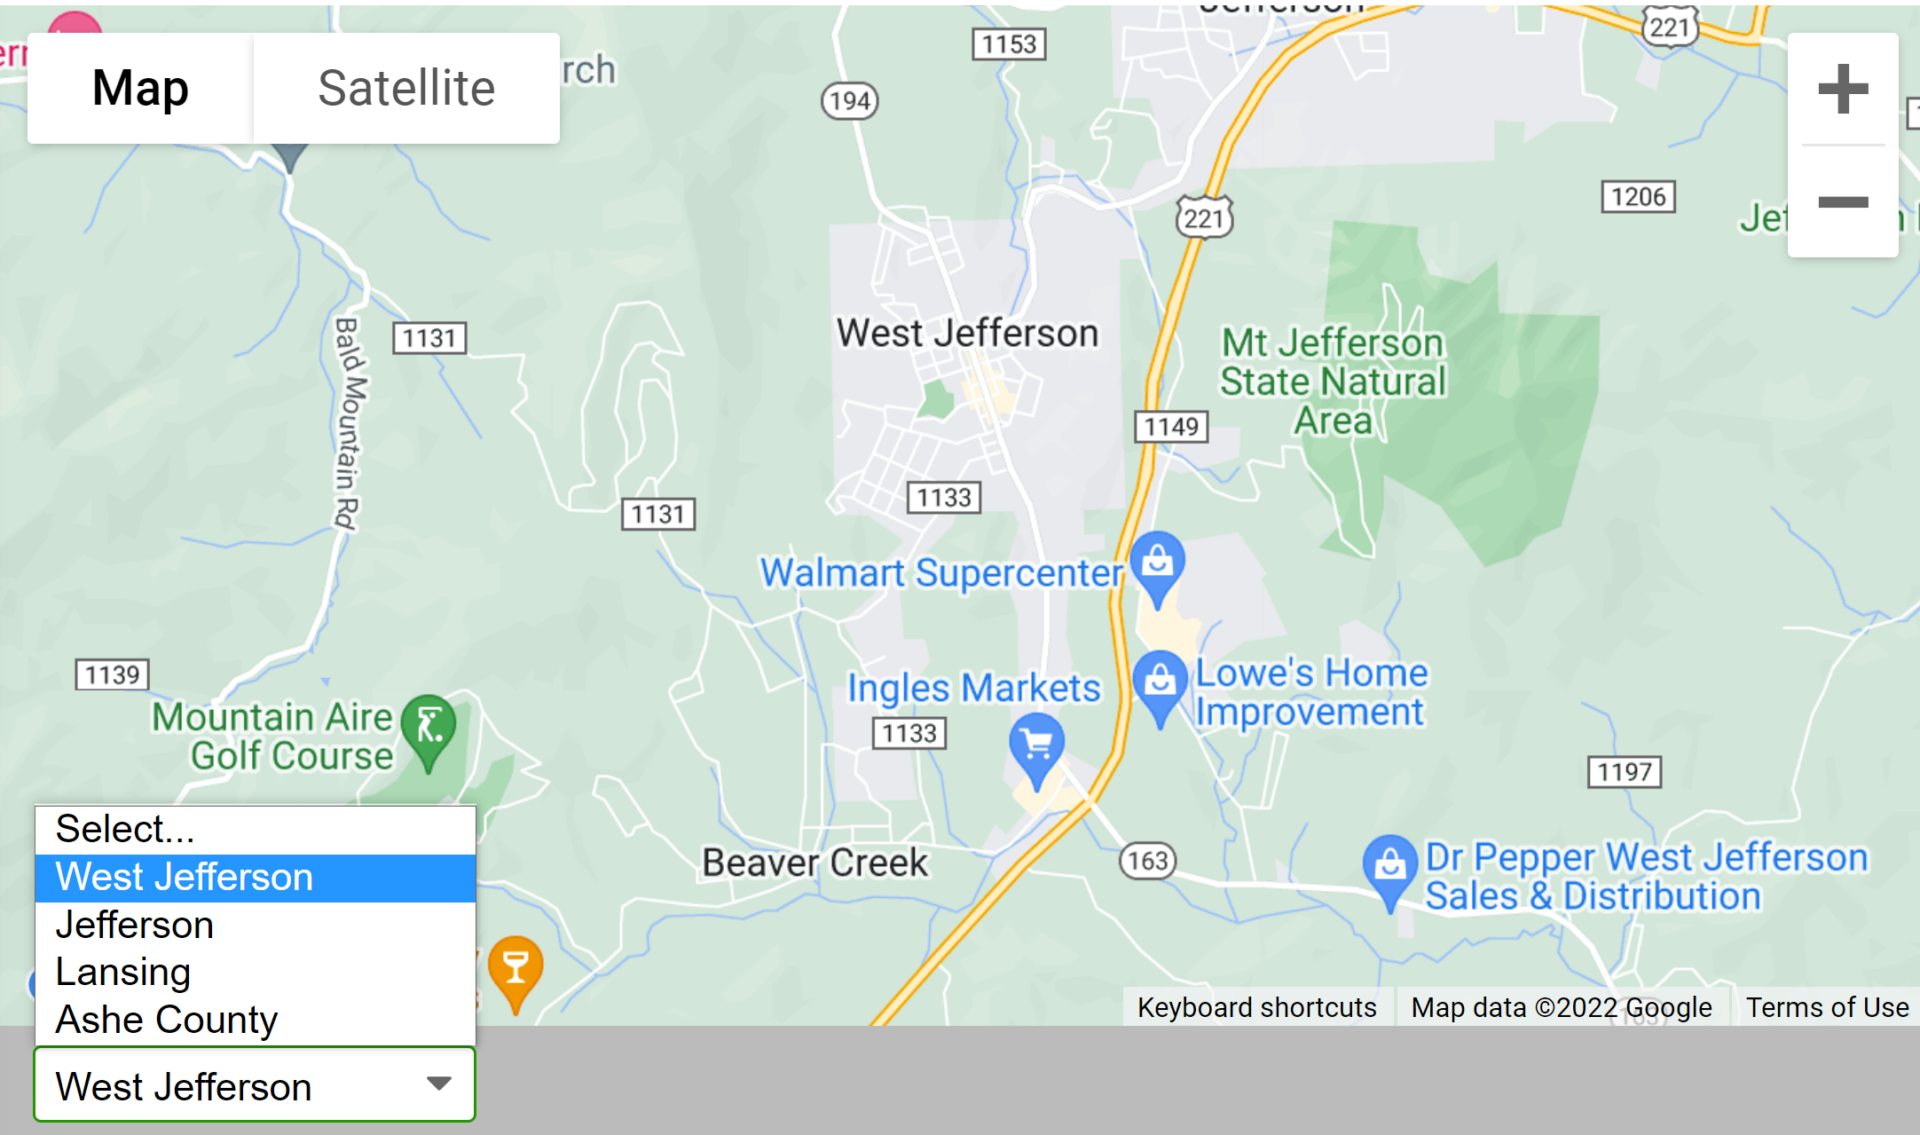
Additionally, since the project area encompassed several towns, they used the dropdown menu to allow participants to zoom into Ashe County, Jefferson, West Jefferson and Lansing. Anything you can do to make your survey faster to complete will pay off.
Screen 5: Wrap Up
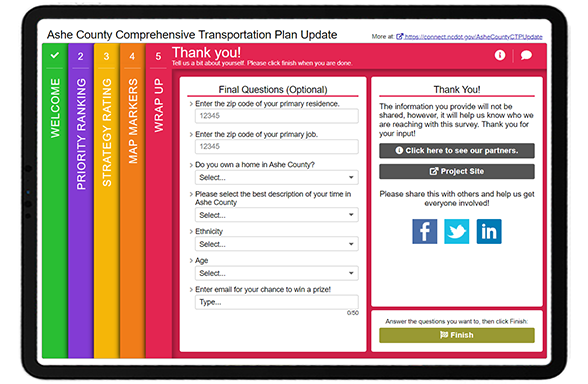
To wrap things up, the final Screen asked a series of demographic questions. The team followed a number of best practices here, such as:
Utilizing dropdown menus to gather quantifiable data and keep the format brief
Listing ethnicities in alphabetical order
Sticking to just six simple questions
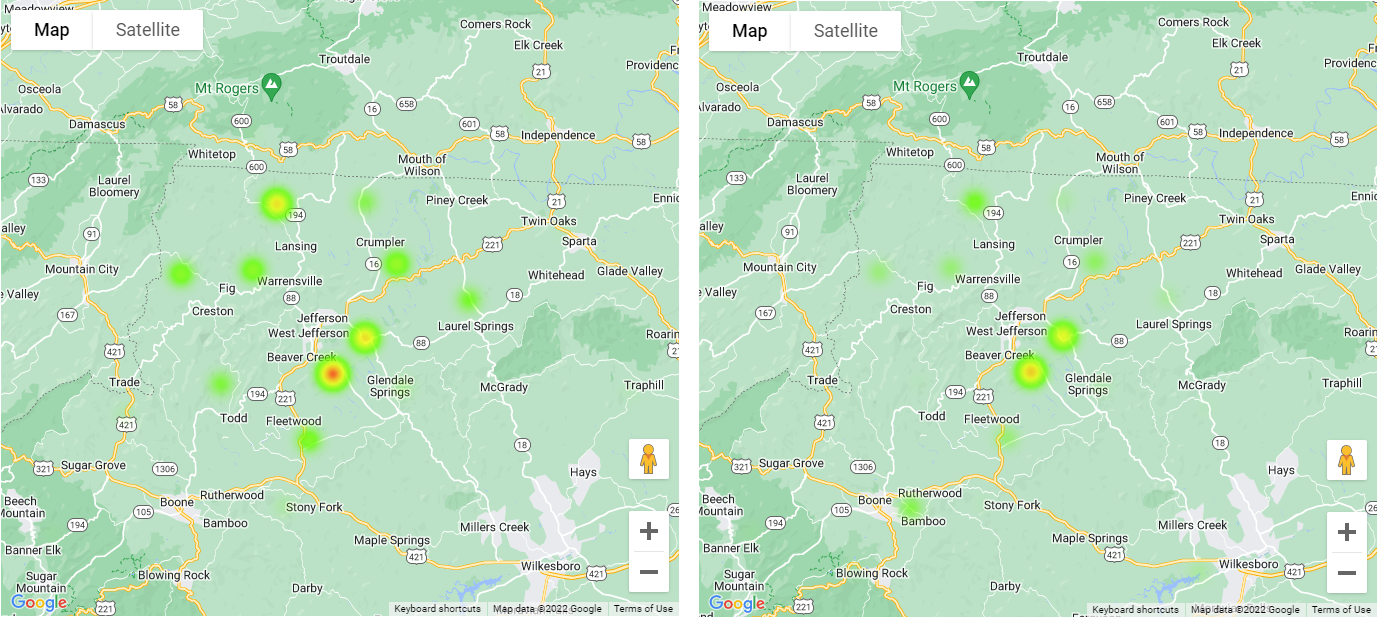
Additionally, during our latest optimizing webinar, we highlighted our relatively new ZIP/postal code heat map feature. By asking participants to provide ZIP codes for their residence and job, the team could see trends between common commuter routes. Notice the difference in the two heat maps below:
Residential ZIP codes are shown on the left and primary job ZIP codes on the right. Notice how they are similar, yet residents are more concentrated in Beaver Creek and more jobs appear near Boone.
5 Tips from the Ashe County CTP Update Survey:
If you are offering an incentive, keep it local: As mentioned earlier, this survey included an option for participants to provide their email to be entered into a prize draw. The survey indicates that the prizes are local, reducing the likelihood of non-community members or bots completing the survey just for the prize.
Consider bright and inviting colors: Whether you match your color palette to your branding or choose something bright and cheerful, consider that your survey colors often are the first thing that participants notice. The more they stand out, the more likely your survey will be taken. Keep in mind that surveys are often shared via a thumbnail image on social media, so the colors and Welcome Screen image have a big impact.
Flow through content in a consistent sequence: You will notice when going through this survey that the topics remain the same throughout each Screen, but different activities and questions gather a variety of input. Surveys that are consistent and build on the same topic areas are often more successful. Consider that a survey may be your community’s first time learning about a particular topic, so you want to keep the content focused to avoid information overload.
Ask for home and work ZIP codes: As shown above, the Wrap Up Screen included a place for respondents to provide both their primary home and work location ZIP codes. Coupled with our recent heat map feature for ZIP codes, you can easily see who you hear from and identify whether you need to target your promotion in certain underrepresented areas. Asking for both a home and work location also gives you a sense of common commuter activity.
Order demographic options in alphabetical order: To ensure you are engaging equitably and fairly, always list race or ethnicity options in alphabetical order.
The NCDOT team and the various regional sub-organizations throughout the state create some excellent MetroQuest surveys. We thank them for the opportunity to highlight this excellent CTP update survey! Make sure to check it out yourself here.
For more great tips on how to make the most out of MetroQuest reach out for more information or, if you are an existing subscriber, contact our Vice President, Norma Hogan.
Check out our latest webinar where we discussed the most effective strategies for promoting and designing surveys that support diverse and equitable participation.
The Survey of the Month series is a monthly blog where we highlight the extraordinary work our customers are doing! We feature well-designed surveys and share takeaways that are relevant for anyone interested in making the most out of online engagement using MetroQuest’s survey platform. To see more in the series, visit the blogs here.
Road safety and the goal of Vision Zero have come to the forefront of transportation planning in recent years. The idea of Vision Zero—a strategy to eliminate all road fatalities and severe injuries—started in Sweden in the 1990s and has gained traction in North America. We can all agree that safer roads, sidewalks, and bike lanes benefit everyone!
Continue reading to learn how the City of Phoenix, Arizona, engaged over 2,500 community members and gathered precise data to inform their Road Safety Action Plan. Following this engagement process and the plan submission, Phoenix City Council unanimously approved a comprehensive Vision Zero Road Safety Action Plan on September 7, 2022, and the allocation of $10 million annually for its implementation.
What’s the story? Thorough and Thoughtful Engagement
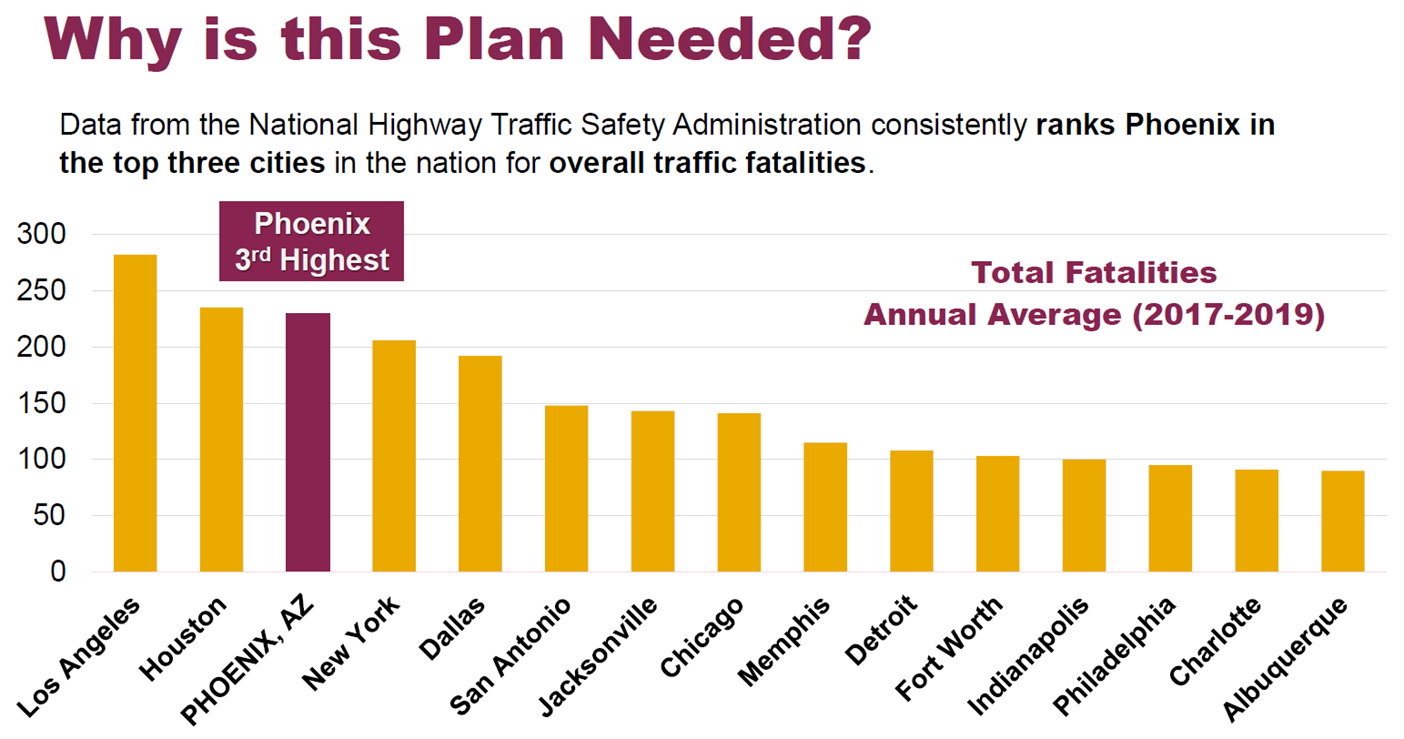
The WSP team regularly develops outstanding MetroQuest surveys, such as the one we featured about a year ago for Illinois DOT. This time, they worked with the City of Phoenix to engage community members on their roadway experiences. Phoenix consistently ranks among the worst three cities in the US for traffic fatalities. As demonstrated in the bar graph below, an improvement in road safety and a reduction in collisions is urgently needed.
Bar graph showing Phoenix with the 3rd most traffic fatalities, with Los Angeles and Houston 1st and 2nd .
We often concentrate on the survey itself, but this time, we also want to emphasize the importance of transparent public consultation processes. It is one thing to survey a community, but closing the loop and showing consideration of input is what will build long-term civic involvement and trust.
We’ll highlight several key components and results from the Public Involvement Summary Report, but we recommend checking it out yourself!
Before we get into the survey content, we want to point out a few key factors that contributed to the success of this initiative.
Achieving a Cohesive and Identifiable Project Brand
At the outset of the planning process, the project team developed a brand package to create a cohesive visual look for the project. Since cities must communicate about a wide array of topics, it is particularly helpful to create strong project identities.
The brand package included: a logo, colors, fonts, letterhead, and templates for a memo, meeting agenda, fact sheet and PowerPoint presentation.
Creating a brand package makes a lot of sense for longer-term projects and saves time in the long run, ensuring consistency across materials when a larger project team is conducting outreach. Additionally, you can leverage community group involvement by creating an outreach package for them to distribute.
Example logos as part of the Road Safety Action Plan branding package. The Vision Zero line was added in February 2022 following Council approval to adopt Vision Zero.
Creating a One-Stop Project Webpage
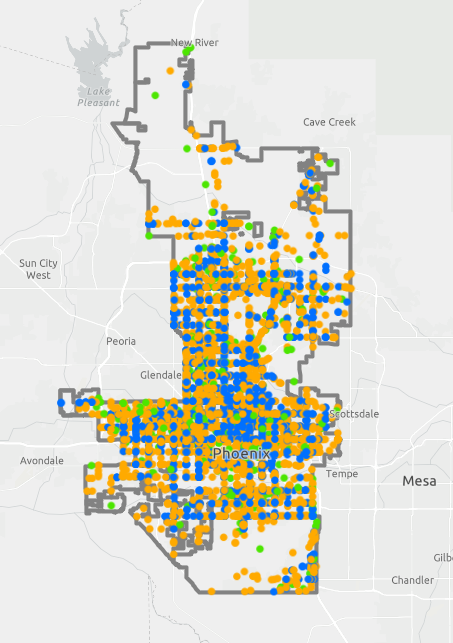
ArcGIS map identifying areas with frequent road injuries or fatalities.
We always recommend having a project website to host your survey information. The City of Phoenix created phoenix.gov/roadsafety as a hub for project information.
The City of Phoenix ensured the community was informed leading up to, during, and following the engagement process. The webpage offers a feed with project updates, links to project materials and even an ArcGIS map.
The High Injury Network (HIN) interactive map demonstrates the full scale of transportation incidents and deaths, displaying data from five years of motor vehicle crashes. Using interactive visuals to tell these devastating but true stories helps the public better understand the need for the plan.
Additionally, the team even embedded a video to update on the plan!
During the public involvement period, over 1,500 unique visitors viewed the project webpage.
Leveraging Social Media and Tracking Impressions
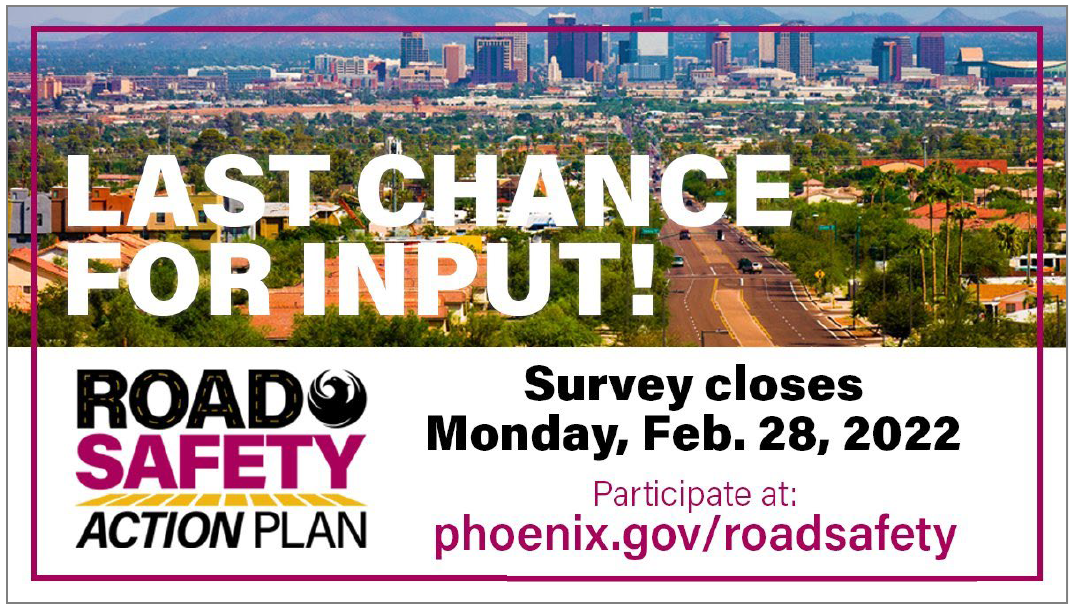
To ensure the community was well aware of the MetroQuest survey, they notified everyone through City newsletters and posts on the @StreetsPHX Twitter page. The project team tweeted 35 times during the engagement period, which resulted in 14,727 impressions! Social media posts were quick, visual and direct about when input needed to be submitted by:
City of Phoenix Street Transportation Department Twitter Post
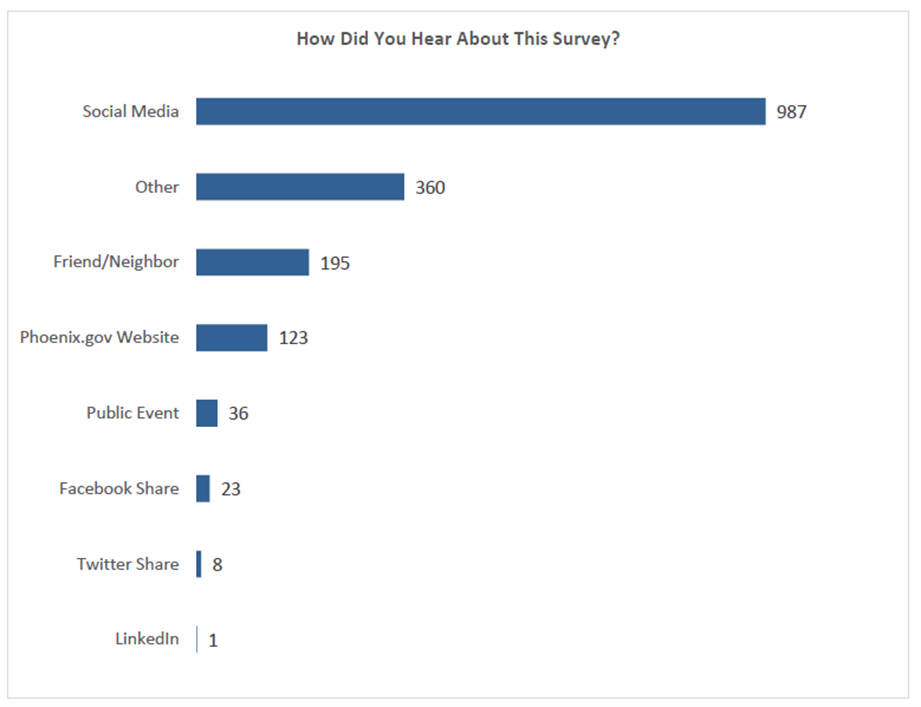
As evident in the below bar graph, the majority of respondents heard about the survey through social media:
57 percent of respondents heard about the survey on social media. *Based on 1,733 total responses.
Informing the Community at Virtual Meetings
Following the COVID-19 pandemic, MetroQuest was the primary public involvement activity during the planning process. The project team also held a virtual public meeting and community touchpoint events in six community districts.
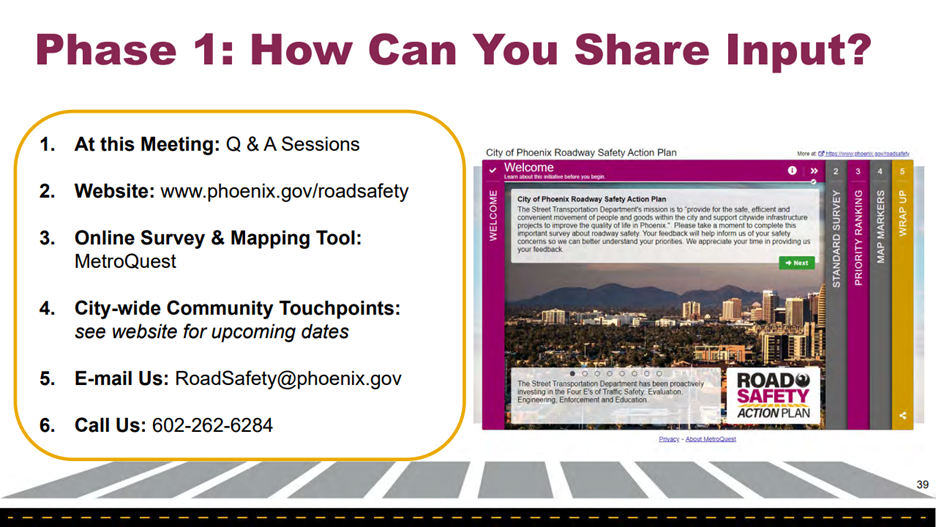
At the live virtual public meeting in November 2021, they shared an informative, graphics-focused presentation that highlighted the need for the plan. They made it extremely easy for participants to know how to provide input by outlining the options in the presentation:
Presentation slide showing the six ways to provide input.
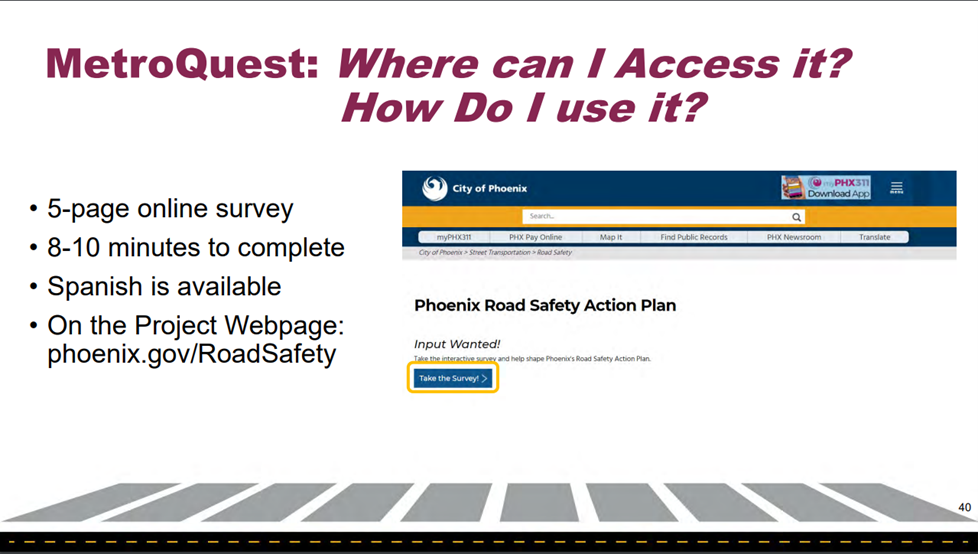
They also highlighted where to find the online survey and noted it only takes 8-10 minutes to complete (something we love to see).
Presentation slide showing where to launch the survey.
Anatomy of a Road Safety Survey: Informing and Collecting Input to Make Roads Safer
The Phoenix Roadway Safety Action Plan Survey was live from November 16, 2021, to February 28, 2022, allowing 15 weeks for input. When surveys are live during a holiday period, it can make sense to leave them open for longer, especially if you are supplementing with events and continuously reaching out via social media.
In total, there were over 4,000 visitors to the survey and more than 2,500 people provided input for a conversion rate of over 60%.
Screen 1: Welcome
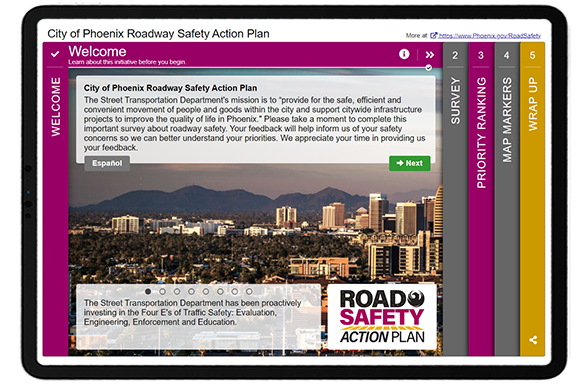
As demonstrated above, the Welcome Screen was particularly eye-catching. In speaking with the project team, the survey was not only important for collecting input but was also used as a method for educating the community about road safety issues.
“One of our key reasons for using MetroQuest is that it helps us educate the community as much as it helps us gather key input.”
– Alexandra Albert, Southwest Mountain District Lead, Communication and Public Involvement at WSP
In particular, they wanted the community to be aware of the four (now five) “E’s” of Traffic Safety: evaluation, engineering, enforcement, education and equity.
Following the informative and inviting Welcome Screen, the survey included three main activities:
Standard Survey Screen: questions about safety concerns
Priority Ranking Screen: prioritize the focus of safety work
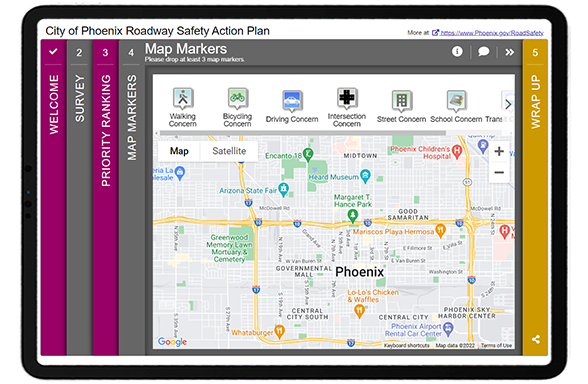
Map Marker Screen: mark locations and comment on safety concerns
As usual, we’ll go through screen-by-screen and share some of the data the project team gathered from this initiative.
Screen 2: Standard Survey
We typically do not recommend starting with a Standard Survey Screen, as it is not our most exciting or engaging Screen, but it can be the best option in some instances. Here, the project team needed to gain specific details on how participants move throughout the city, their greatest safety concerns, factors for crashes and how they would most like to learn about safety issues. This information made sense to start with upfront in the survey.
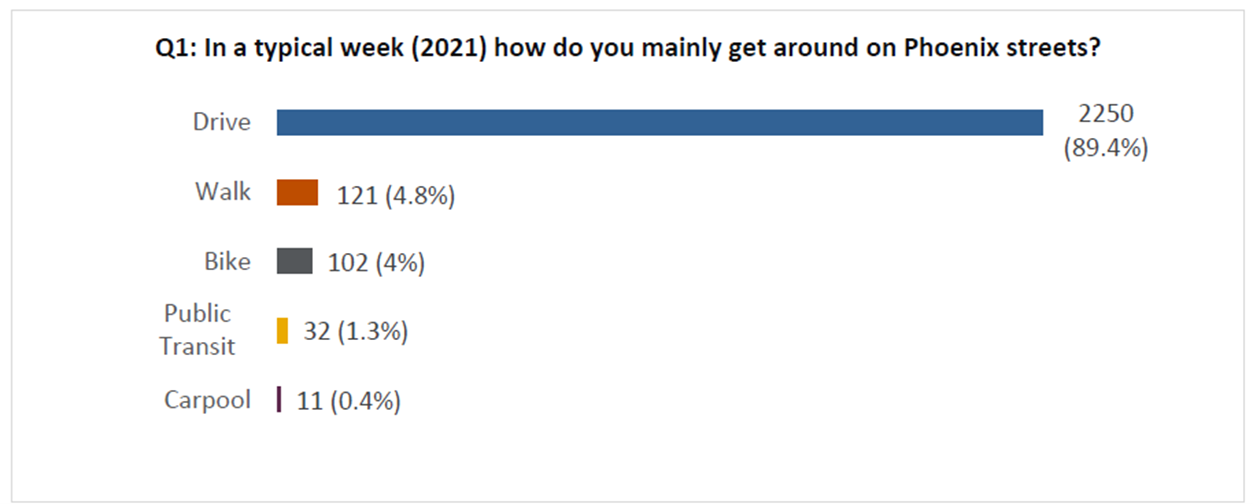
By asking a few simple quantitative questions, they were able to quickly understand the participants’ preferences, including that the majority of them drive:
Bar graph showing that 89 percent of survey respondents typically drive to get around Phoenix.
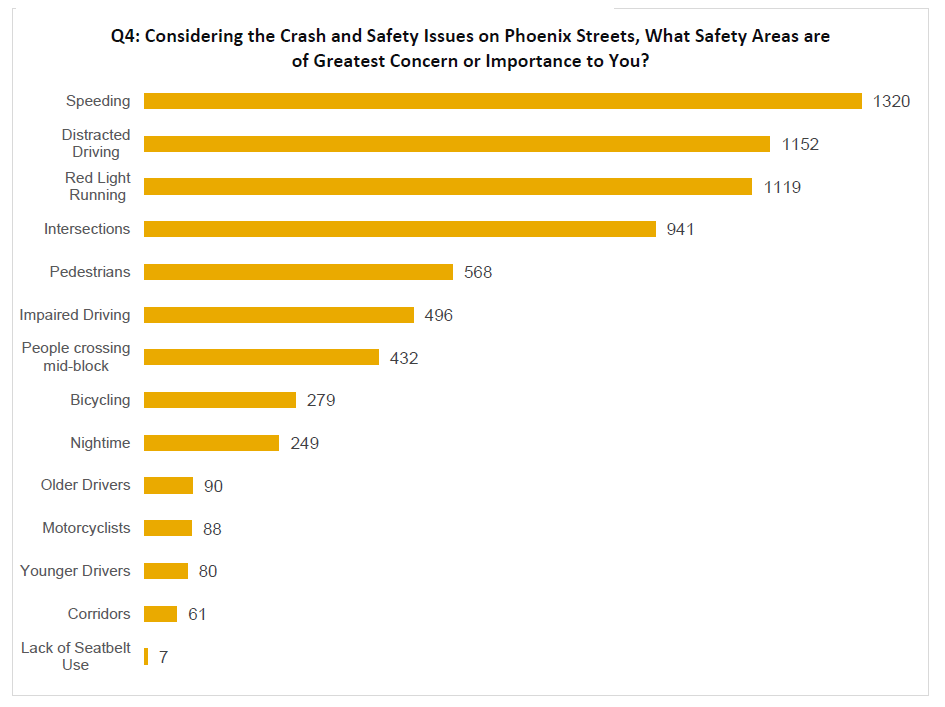
They also learned that speeding, distracted driving and red light running were the top three safety concerns of residents:
Bar Graph showing the greatest safety concerns.
Screen 3: Priority Ranking
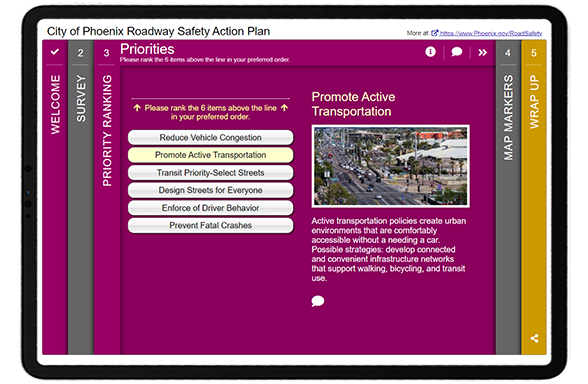
The survey remained straightforward on the third Screen. Participants were asked to rank all six priorities:
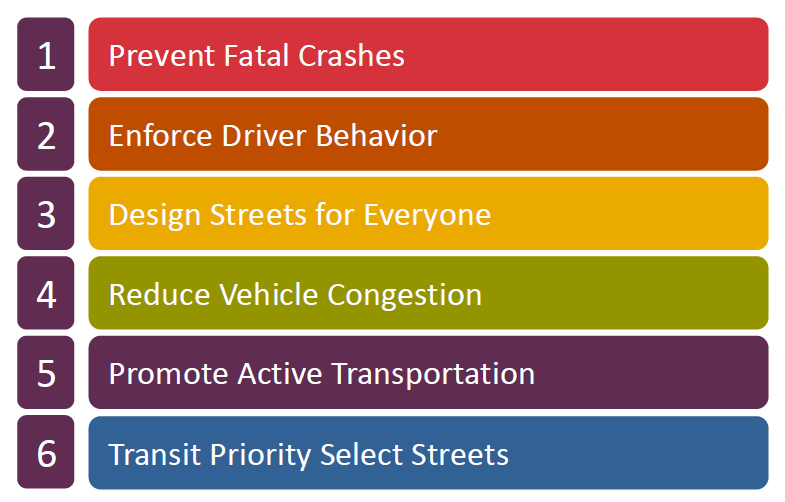
Following with the quantitative question format, they could quickly glean which safety actions were highest priority:
Image showing that the top priority is to prevent fatal crashes.
Did you know? The Priority Ranking Screen randomizes the order of the priorities every time a participant visits it, eliminating potential bias from the item sequence.
Screen 4: Map Marker
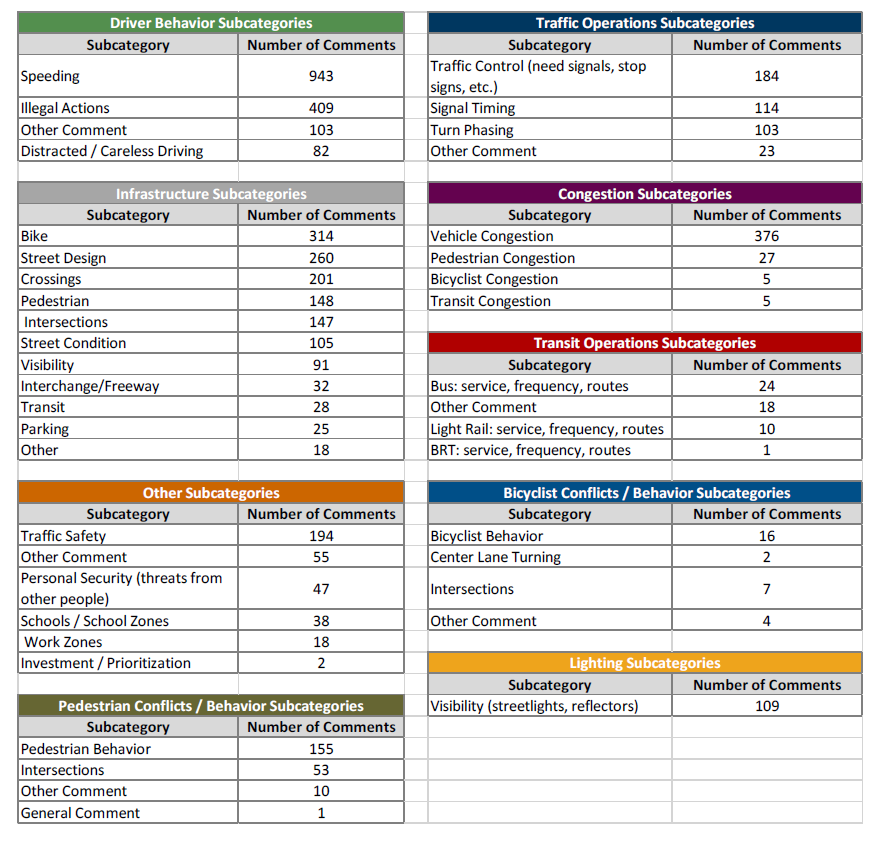
List of categories and sub-categories based on open-ended Map Marker Screen data. The number of comments per category help quantify qualitative data.
The Map Marker Screen was very well utilized to gather a wide variety of input on everything from walking/biking/driving concerns to transit, school and lighting concerns. They ended up receiving over 4,500 individual comments from the dropped markers.
Qualitative data analysis can be time-consuming but often worthwhile to gather nuanced data. Following a category-based approach, the project team analyzed the data by categories and grouped them into sub-categories. As shown in the image to the right, they pulled out key themes and organized them by comment—quantifying the qualitative data as much as possible.
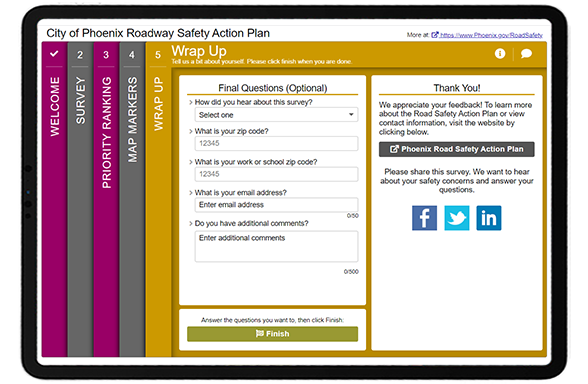
Last but not least, the final Wrap Up Screen remained simple and quick with five key questions:
As indicated earlier, the project team learned that most participants heard about the survey through social media. They also made sure to ask for ZIP code details to get a sense of which areas were represented through survey respondents.
We can only highlight so much in this blog post; we recommend reviewing the project website and engagement summary report to learn more about the project. Then check out the demo link of the survey!
To close, here are our five key takeaways you should consider for your next project!
5 Tips from the City of Phoenix Roadway Safety Survey:
Create an eye-catching branding package and stay consistent: The project team took the time to develop fun and striking project graphics. This makes such a difference, especially when tied in with the colors in the survey! People are visual, and you need something that stands out when someone scrolls through their feed. With longer-term projects and initiatives, having an instantly recognizable look adds a level of professionalism and ensures those you engage initially will be on the lookout for future materials and surveys.
Consider your survey as an educational tool: Surveys are more than just a way to gather input; in many cases, they are the first time someone learns about an initiative. Consider your Welcome Screen content carefully and keep it light, fun and engaging. The better your community understands a project, the more impactful input will be.
Track your social media and website impressions: Launching Facebook, Instagram or Twitter ads goes past the initial setup process. Ensure you check back regularly and assess campaigns after they close to determine their effectiveness. Use this data to inform future engagement endeavors and outreach.
Use your project webpage to update the community continuously: We ALWAYS recommend developing a project webpage to house your project information, survey link, and any documents once your survey closes. MetroQuest survey links are not searchable online, so you need to create a webpage or site for the project. Consider updating your project website regularly as the project progresses. Showing a timeline can help participants gauge the scale of the project. We also recommend using maps, visuals and video to keep things interesting!
Quantify your qualitative responses: Qualitative data is inherently more time-consuming to analyze but can elicit thoughtful, nuanced information. After reading several open-ended comments, you can learn a ton about overall community sentiment and opinions. When analyzing thousands of responses, tally comments by key themes and subthemes; this will help you quantify the responses, report on them fairly and get a sense of what matters most to the community.
We are honored to feature this survey! As noted earlier, the transparency of sharing survey results and comprehensive amount of information on the project website truly sets this project apart.
Congratulations to the City of Phoenix and WSP team for the excellent response, and kudos to Council for adopting a Vision Zero Strategy. Motor vehicle accidents sadly affect many, and we are always glad to see MetroQuest utilized for initiatives that will make roads safer.
For more great tips on how to make the most out of MetroQuest reach out for more information or, if you are an existing subscriber, contact our Vice President, Norma Hogan.
Check out our latest webinar where we discussed the most effective strategies for promoting and designing surveys that support diverse and equitable participation.
The Survey of the Month series is a monthly blog where we highlight the extraordinary work our customers are doing! We feature well-designed surveys and share takeaways that are relevant for anyone interested in making the most out of online engagement using MetroQuest’s survey platform. To see more in the series, visit the blogs here.
Join us as we learn how MDOT and MEA gathered strategic input from key stakeholders and the public to inform their State Plan for National Electrical Vehicle Infrastructure (NEVI).
What’s the story? Applying for EV Infrastructure Funding
The NEVI Formula Program was established in 2021 as part of the Infrastructure Investment and Jobs Act (IIJA) and provides funding dedicated to implementing electric vehicle (EV) charging infrastructure. This major US-wide program comprises up to $7.5 billion total funding allocated between states.
Every state is required to submit a deployment plan before using any of its allocated federal funding to develop EV infrastructure. Maryland, in particular, has been consistently listed as a leader in transportation electrification. As is evident with this survey and the plan, they put a significant amount of time and resources into collaborating and coordinating efforts for improved EV infrastructure.
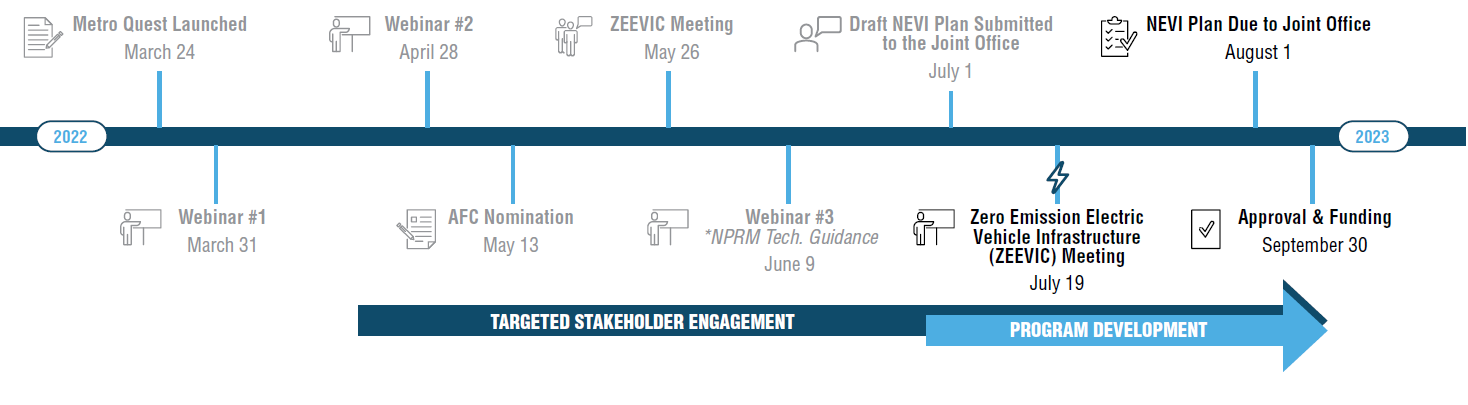
To directly inform the plan, MDOT and MEA sought input from stakeholders and the public through a MetroQuest survey launched in March 2022 that remained open for just over four months. The project team received input from 293 participants at the time of submitting the NEVI plan and ended up hearing from an additional 500 people before the survey closed. The survey results will continue to inform the development of the NEVI program.
The MetroQuest survey helped us better understand where communities and stakeholders would like to see publicly available EV charging stations. This will help Maryland prioritize installations along corridors and will be useful in the future as we move from corridor-based charging installations and into communities. This information will help us communicate priorities with site hosts and other partners interested in installing infrastructure
– MDOT Project Team
NEVI Planning Timeline
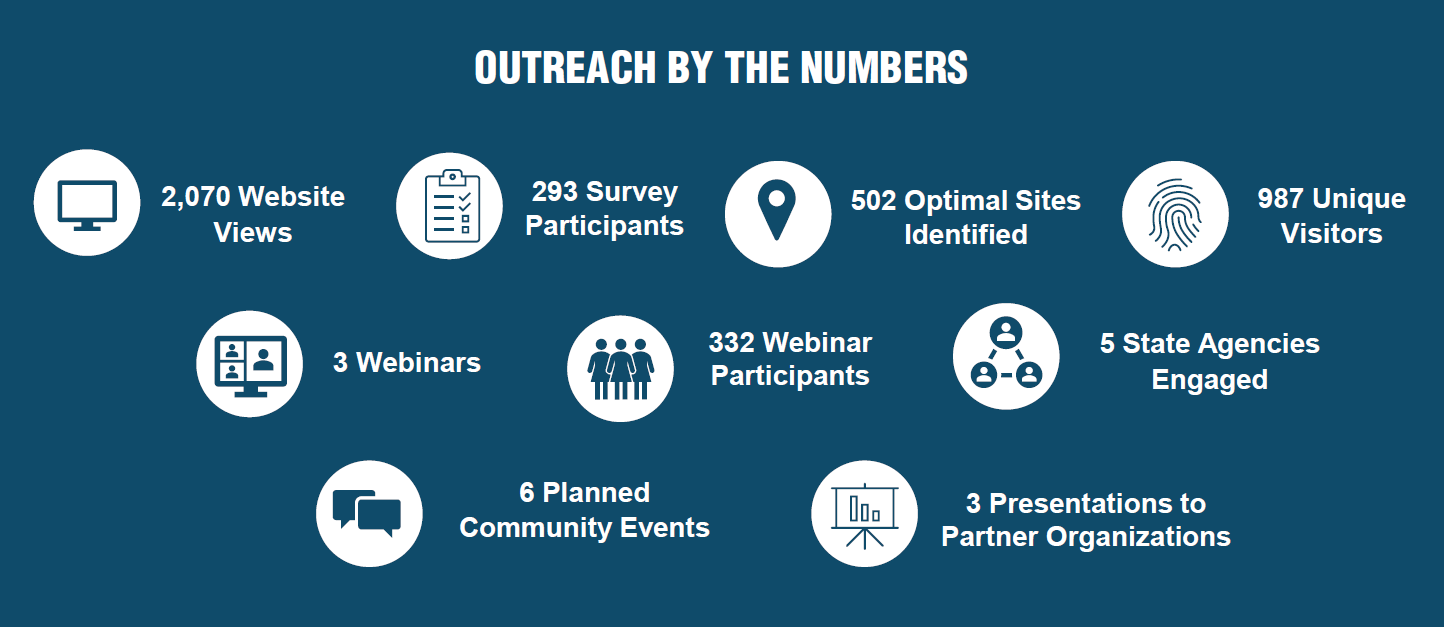
MDOT and MEA were able to reach a broad audience through advertising on their existing websites and social media channels. Additionally, interagency consultation and coordination were instrumental in expanding the survey’s reach and contributed greatly to a boost in responses in July. As with many projects, the survey was just one aspect of a comprehensive outreach program:
Community and stakeholder outreach key numbers.
The ZEVIP survey was not MDOT’s first EV-related MetroQuest survey. In 2019 they engaged local governments1 about EV infrastructure and gathered input from over 1,500 participants on their EV Workplace Charging survey in March 2020. These previous surveys identified EV-related challenges encountered by local governments and optimal charging locations—input that helped inform the ZEVIP survey and plan.
Follow along as we share key aspects of MDOT’s ZEVIP survey below. We also encourage you to check out their fantastic project website and NEVI plan for more details.
Anatomy of an Electric Vehicle Plan Survey: Gathering Key Criteria and Location-Based Data
Given the need to directly inform a plan to access state funding, the MetroQuest survey contained very specific questions and asks. The combination of a Strategy Rating, Standard Survey and Map Marker Screen resulted in specific quantitative input and geographic data on preferred EV charging locations.
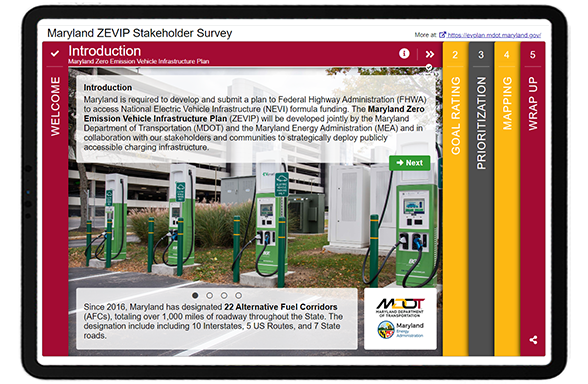
The survey is identifiable from the start as it welcomes you with a photo showing electric vehicle charging stations. The color scheme matches the branding, and the concise but explanative introduction shares the purpose behind the survey and key facts such as, “as of February 28, 2022, there are over 43,700 EVs registered in Maryland. Over the last 12 months, Maryland has been averaging over 1,100 new EVs registered per month.”.
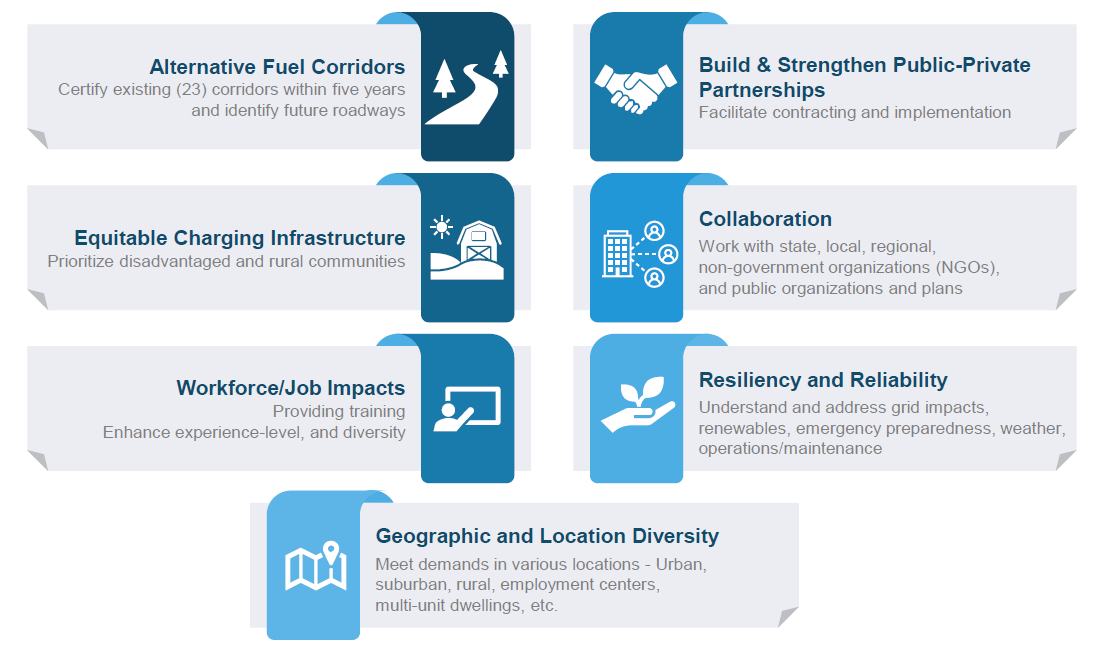
Following the initial Welcome Screen, a Strategy Rating Screen was used to gather input on seven key goals, as displayed below. The Strategy Rating Screen is one of our most popular Screen options as it allows project teams to gather quantitative input on a series of statements such as goals or project priorities. It is an excellent choice for projects in the initial planning phase when you are determining priorities and overall sentiment.
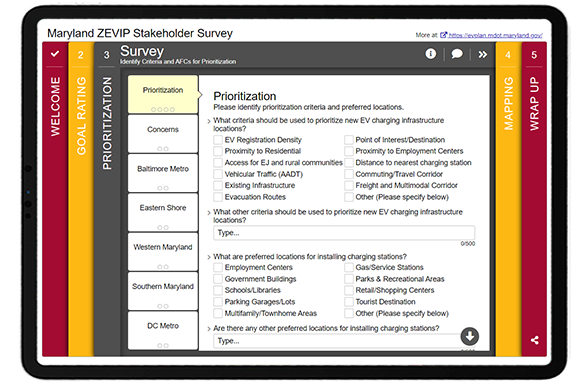
For the middle Screen, they utilized the adaptable Standard Survey format. While Standard Survey Screens don’t offer the same interactivity and gamification as some of the other MetroQuest Screen options, in some cases they offer the flexibility needed to ask a series of varied multiple choice, checkbox and textbox questions.
As evidenced here, MDOT and MEA were able to gather a wide variety of input on prioritization criteria, preferred locations for charging stations, concerns, as well as preferred Alternative Fuel Corridors 2 (AFC).
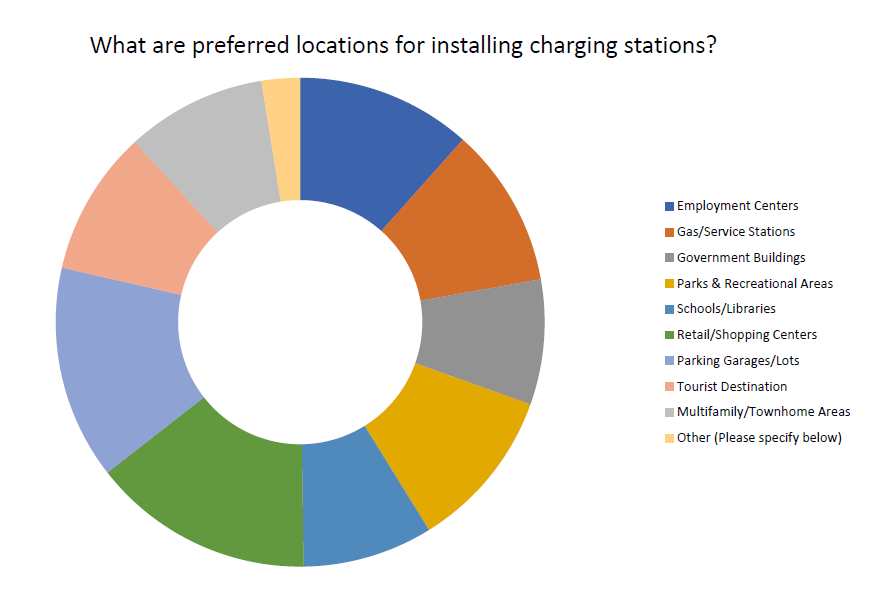
MetroQuest survey results for preferred charging station locations, identifying parking garages/lots and retail/shopping centers as top locations.
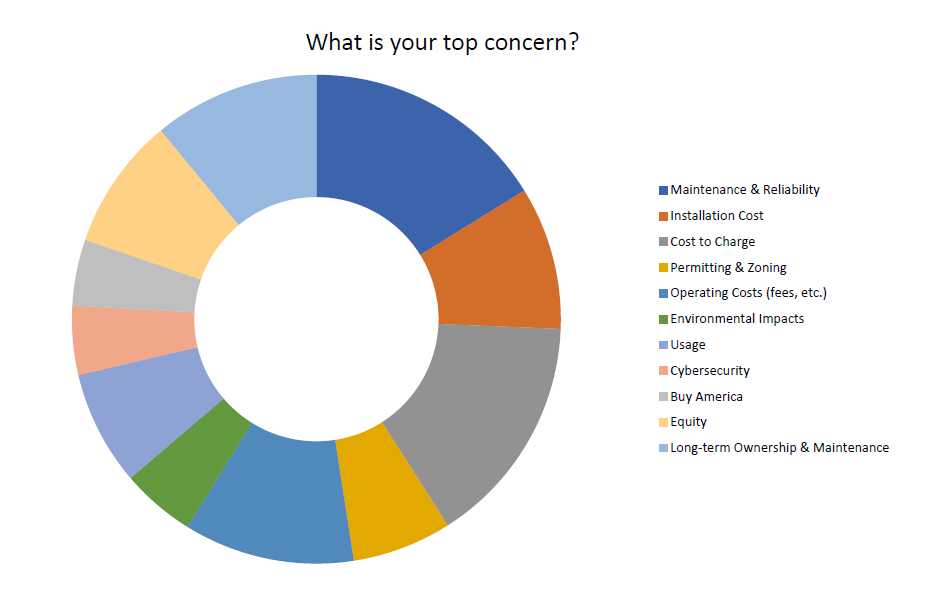
Participants were asked to identify any concerns that they thought could prevent Maryland from achieving the vision and goals of the ZEVIP. Buy America and maintenance/reliability came out on top.
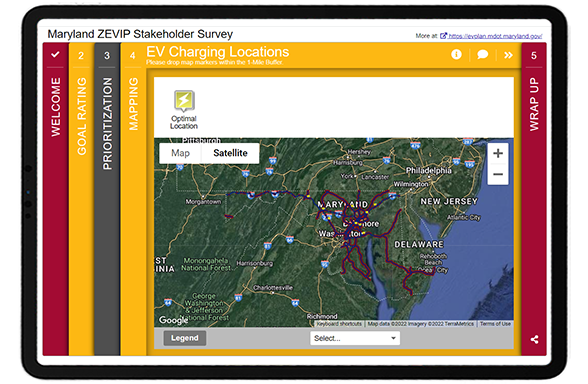
Like many successful MetroQuest surveys, they used a Map Marker Screen where participants could drop pins at optimal locations for EV charging on a Google map. Participants were asked to indicate the type of site and provide additional details.
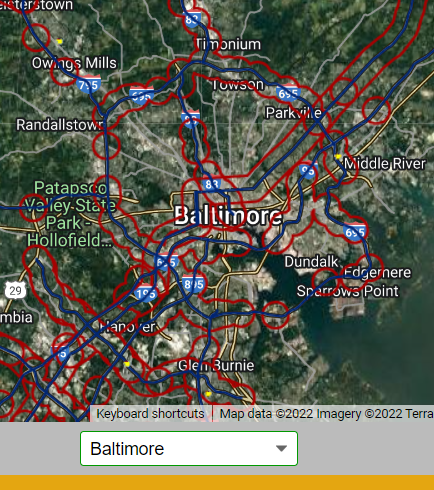
Location zoom feature
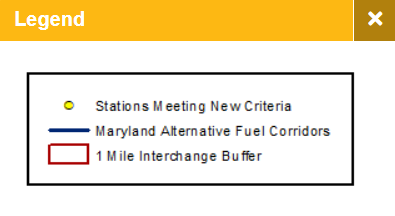
Note the use of a legend to explain the KMZ layer markings and the pre-set location options allowing participants to quickly zoom into popular areas like Baltimore. These features make this exercise easier for participants, especially those taking the survey on their phone and ensures that participants are providing input in the appropriate map areas.
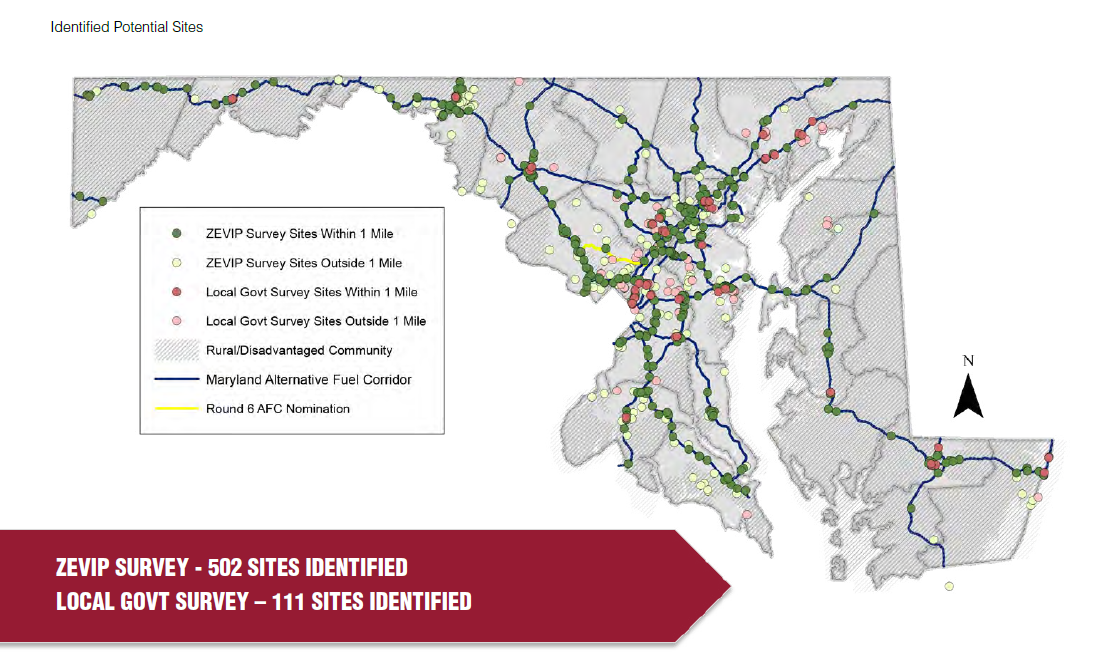
EV sites identified through Map Marker Screen input.
As demonstrated in the above map, the Map Marker Screen provided valuable location-specific data for the team to understand exactly where EV infrastructure is needed. Since the survey remained open after the plan submission, they ended up with over 1,200 dropped pins!
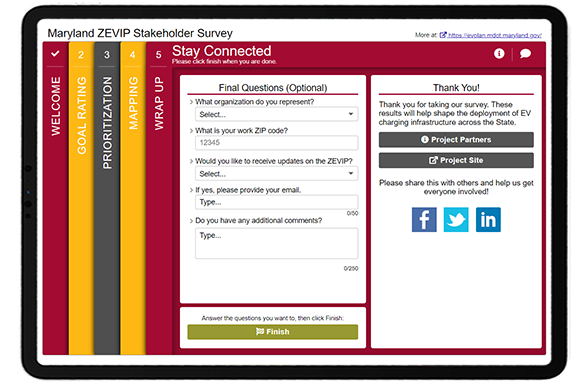
To close, the team kept things relatively simple on the Wrap Up Screen with a question about their affiliation or organization, ZIP code, a place to sign up for email updates and a box for additional comments.
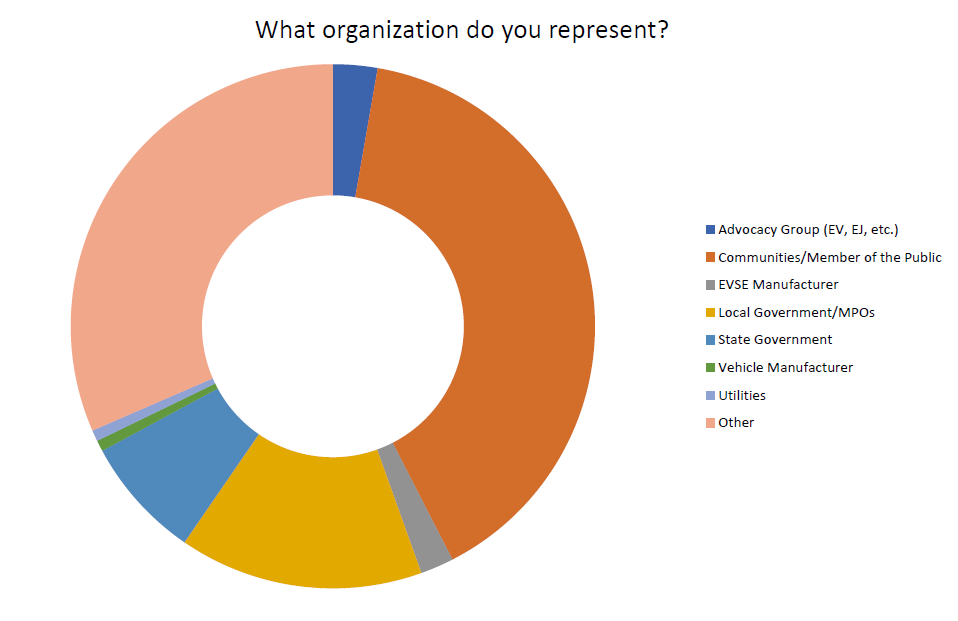
Through questions such as, “what organization do you represent”, the project team had a good sense of who they heard from:
Data showing the variety of stakeholders engaged.
Click through this demo version of the survey to see exactly how MDOT and MEA sought EV input!
5 Tips from the Maryland ZEVIP Survey: A perfect fit for
a Map Marker Screen
Work with partner agencies to broaden your survey’s reach: We’ve consistently seen surveys garner great response rates thanks to cross-agency coordination. Rather than relying on your organization’s networks alone, contact related agencies across your area and stakeholder organizations. It can help to provide pre-developed messaging and graphics, so they don’t need to put in any effort to spread the word about your survey.
Make the most of your Welcome Screen: The Welcome Screen sets the tone for your survey. This survey is an excellent example of well-crafted background information that is informative yet concise. The background image is relevant, recognizable and the overall color scheme meshes well with the organization’s logo.
Consider the Standard Survey Screen when you need to gather varied data: We generally recommend customers try to avoid the Standard Survey Screen due to its lack of context and interactivity, but occasionally, it can be a very helpful addition. This Screen allows you to ask a mix of checkbox, multiple choice and comment questions on a series of tabs. We recommend using a Standard Survey Screen near the end of your survey to keep the initial Screens as engaging as possible.
Tip: boost the appearance by embedding an image in one of the text fields!
Spend time developing a very clear KMZ/KML layer for the Map Marker Screen: This is one of the most intricate and well-implemented KMZ layers we have seen. It clearly shows the routes for alternative fuel corridors and ensures participants know to drop markers within the burgundy-colored one-mile buffer zone. Having a GIS expert at your organization create a quality KML/KMZ layer defining the project or area for input is worthwhile. No fret, it is easy to create this file even if you aren’t an expert with GIS files—our support site has a step-by-step guide (search “KMZ”).
Make use of the additional features to increase the ease of the mapping exercise: If you are using a KMZ/KML layer in your map, it’s integral to include a clearly labeled legend to guide participants. Additionally, for statewide projects or initiatives covering a large geographic area, adding location dropdowns to zoom into sub-locations speeds up the exercise so participants can navigate to certain cities or sites quickly.
Thank you to the MDOT and MEA team for the opportunity to highlight this unique and well-designed survey!
We are delighted that we could feature another excellent EV survey! If you are a MetroQuest customer, keep an eye out for our EV survey template launching in October – you can use it as a base for your next EV survey.
In this webinar, we highlighted how local and state agencies are working together to engage the broader Tennessee community with a deep dive into the Memphis MPO’s Regional Transportation Plan, Moving Together 2050!
2019 and 2020 surveys were developed and launched with our previous software version, MetroQuest Classic. The design and some features will vary.
AFC’s are national corridors designated for alternative fueling and charging infrastructure such as EV charging, compressed natural gas, liquid natural gas and hydrogen.
The planning industry always needs to consider evolving modes of travel, and electric vehicles are climbing up the list. I recently had the opportunity to connect virtually with Andrea Noel, the Planning Supervisor for theTennessee Department of Transportation (TDOT). The agency most recently developed a plan as part of their commitment to support electric vehicle technologies. Andreagave us a complete breakdown of theElectric Vehicle Infrastructure Deployment Plan, which will support Tennessee’s mission to create a network of electric vehicle charging stations along key routes in the state.
Here at MetroQuest, we were intrigued to learn how the team at TDOT utilized our software for understanding the future of electric vehicles in transportation planning, and excited by the successful engagement efforts made by Tennessee DOT to gather public input on the plan! In our conversation, Andrea shared why MetroQuest was so useful for this project and discussed the strategies they implemented for their public outreach, how the results affected the plan, and what, in her opinion, the future holds for electric vehicles in transportation planning.
Continue reading to get all the details…
Why did you choose MetroQuest for your Tennessee Electric Vehicle Infrastructure survey?
Well, that was easy. We want to use MetroQuest for all our planning surveys because it provides such a good visual for people.With other software, sometimes people can’t answer the question exactly how you had it, or sometimes they don’t even understand the content.
“It’s kind of like when you go to the voting station, right? And you’re like, oh, I didn’t read up on that guy. I don’t even know if I should vote for him or not. When you’re taking a survey, it’s similar. MetroQuest really gives you the ability to see it on a map and see where it is.”
I love that section where you can put a list of things and add a description and picture. I think that helps people answer questions with knowledge.I think that it is important to be able to give participants the information within the survey. That’s the part I love about it the most. I feel like it’s more than just a survey. It’s a way for us to give them information and educate them.
What strategies did you use to gatherpublic participation?
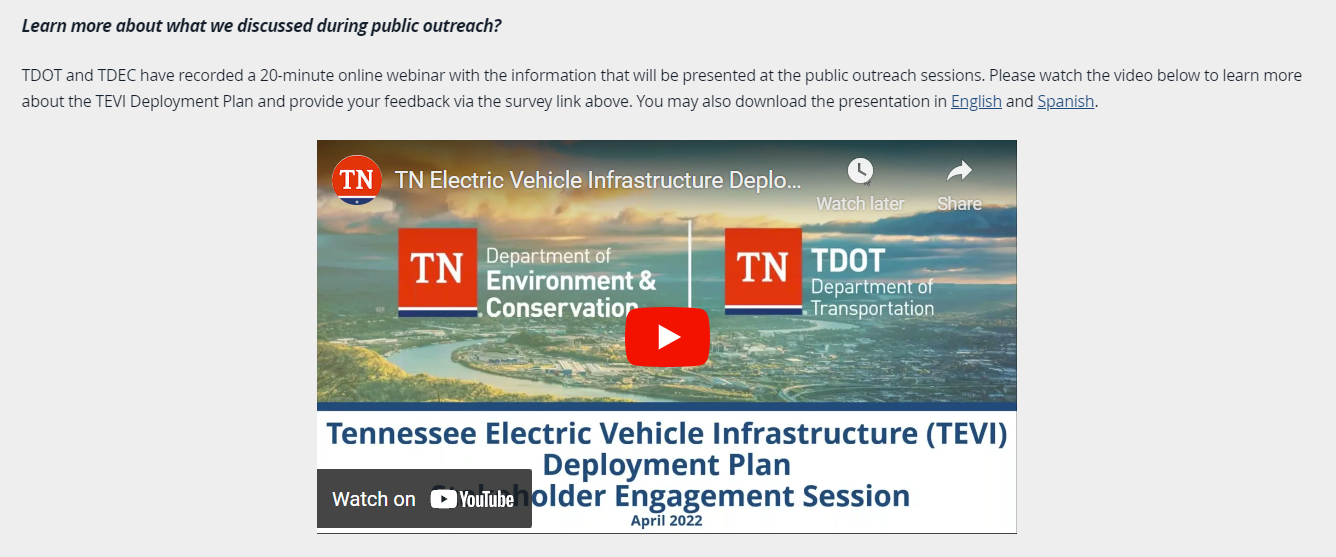
Our whole public engagement plan was to use several methodsfor participation. We wanted to be able to go to peoplein person and alsohave a survey for those that didn’t show up. We traveled around the state, and we did nine locations in person. Our first step was doing a webinar and putting it on the website. And then we did the survey, which was open and collecting public inputfrom May 1stuntil May 30th.
“We just wanted to have a lot of different things so that everybody that wanted to participate could. We got 1,014 responses in that 30-day period.”
We did have a social media campaign. We used Facebook, Twitter, and sent out reminders. We also had an email blast. We sent out over 7,000 emails to our stakeholder group. We sent the link to the survey and the dates and locations of where we were going to be.
During the in-person session, we had little cards printed with a QR code so they could click on them and be taken to the survey directly. At in-person events, they wanted to ask questions, but we didn’t feel like we were getting the answers we needed. The survey is what really gave us their prioritized choices.
What were you hoping to achieve by using MetroQuest?
We had two goals. Our first goal was to find out what people wanted when they drove up to a charging station. We gave them a list of ten thingsand said, “which four things are the most important for you when you go to a charging station?” The top concern turned out to be safety. But then we even broke safety down into,what do you want out of safety? People wanted to know that there would be lights 24 hours a day and cameras in case something happened.
“When we start writing the guidance this week, safety is our number one priority. That’s going to be a requirement now because that’s what we got out of the survey. We’ll be putting their prioritiesinto action.”
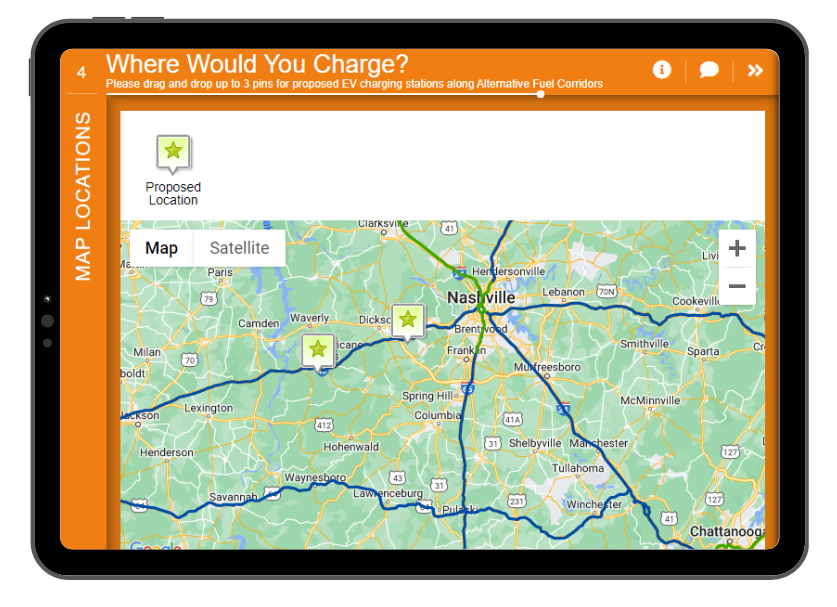
The second goal was to identify specific locations stakeholdersthought would be good for charging stations. On our last screen of the Survey, we had an interactivemap activity.We built-in a location buffer because the charging stations must be within a mile ofthe exit. We buffered the map so that they could only click in a within a mile of that buffer. We wanted to know, where do you want to see the stop? Where would you stop if you were driving from one side of the state to the other?
How did the public participation results impact your plan priorities?
We didn’t even think about the plan. We didn’t think about the guidance. All we did was think about how to engage the public first. As the month went along, we looked at in-person and online comments and saw a lot of safety concerns. At the next meetings, we would say if safety were your first priority, what exactly does that mean to you? We were able to delve deeper into it. No one had any preconceived decisions or notions; we let the public decide for us what those priorities would be.
What results did you achieve on launching the survey, and what were the outcomes that came from the data?
The survey closed on May 30th, and during the first two weeks of June, we analyzed the data, which was easy because MetroQuest had already given us the map showing where people took the survey to see if it was relevant to where we had our in-person meetings.
We did find that the highest participation levels were also where we had our in-person meetings. We think going in person and promoting the survey helped boost those numbers.
Looking at the data, we discovered only 2% of participants identified themselves as being from the freight industry. I’m attending a statewide freight advisory group meeting to present again about the plan. We will meet them in person and ask for their opinions to put into the guiding document.
Having the Survey data helped us focus on who we think we missed.
What do you think the future holds for Electric Vehicles in transportation planning?
I don’t think it’s going away. We have to think about how it’s going to change how we plan because people can move differently now. We’re going to have to start thinking about where people are going to charge their electric vehicles. What are they going to be near when they charge? Are they going to stop and have dinner?
In five years, things are going to look so much different. As planners, we have to keep our minds open to the next thing because in likelihood, these chargers are not going to be here in 20 years. They’re going to be outdated in five, and then we’re going to have to be thinking about the next thing. We need to really start looking at our plans as being like five-year increments, more so than we used to do.
Congratulations to Andrea and the entire team at TNDOT! We’re so inspired by your public engagement efforts and looking forward to seeing how your impressive survey results shape Tennessee’s electric vehicle infrastructure planning!
The last two years have sparked important conversations regarding equity and equality in the planning industry. As the world increasingly leans more into virtual experiences, community engagement strategies should naturally become more creative, diverse and inclusive.
At MetroQuest, we are interested in having critical and educational discussions surrounding the future of public engagement. We are living in a pivotal moment when conversations surrounding equity are being pushed to the forefront of community engagement projects. The use of in-person and online engagement strategies is more essential than ever.
To support that ongoing conversation, we’re excited to host our second Conference on Virtual Public Engagement Planning for Transportation Planning (#VPET22), kicking off this month! We’ll have speakers from NCDOT, TxDOT, WSP, HDR, Broward Metropolitan Planning Organization and more share their case studies, challenges, and lessons learned around public engagement. As we look forward to the discussions and best practices for implementing ways to reach underserved and marginalized communities, I want to share 5 tactics that will help you better engage your community and achieve equitable results. Let’s get started…
Valuable equitable community engagement tactics:
Get To Know the People You Serve
The key to equitable decision-making relies on knowing the priorities of the people in your community. Pay attention to all demographics in your community regardless of race, age, or gender identity, and create avenues to include their input meaningfully. Look into their preferred communication methods, whether it be online through social media or if they value face-to-face interactions through community meetings. Do they have their own meeting areas and networks in place? Going out of your way to engage with your audience is a great first step to establishing trust and transparency between both parties and leads well into other equitable community engagement tactics.
Increase Accessibility
Lack of inclusion leads to inequitable results. Consider the different types of people in your community and how to give everyone an equal opportunity to participate. Increasing accessibility means more than offering in-person and online surveys. Barriers such as language, disabilities, transportation, socioeconomic status, access to technology and time often prevent people from engaging. Look at your initial survey results, for example, and analyze the data to understand which parts of the community are underrepresented in your public engagement so far. Brainstorm alternative methods that allow more people to participate in ways that are best suited for them. As a result, your engagement will be more inclusive, and you’ll end up with more robust data from more of the community.
Hold Yourself Accountable
Reflect on past community engagement projects and review the responses. Do these results reflect all the demographics in your community? Were there unconscious barriers that prevented participation? The journey to inclusive outreach and equitable engagement means reflecting on missteps in the past to inform future strategies. Crafting a survey that is equally effective and comprehensible is important, but maybe the language was still too opaque for the audience you wanted to reach. Developing a culture of engagement in communities, such as diversified meetings, events and promotional campaigns, is another important tactic for equitable community engagement, but maybe the choices offered weren’t right for your area. Confronting flaws in past engagement projects and bettering them will lead to better outreach, input that’s more representative of your community, and ultimately more thoughtful planning and sustainable decision-making.
Build Community Trust
Building trust in a community that has been historically underserved or disadvantaged takes time. But, as always, actions speak louder than words. If underserved or marginalized populations in your community feel mistreated or neglected, prove to them that you are listening. Showcase your results so members can see firsthand how their input is implemented into transportation plans. Become a trustworthy presence in your community by showing their needs are being prioritized in official planning.
Create New Traditions
Planners can no longer rely solely on traditional public engagement methods and instead must be as adaptable as possible. Remember, community engagement tactics are never one-size-fits-all. Get creative and embrace the inevitable changes as we shift to more hybrid engagement planning, particularly as we strive for equitable community engagement. Equitable results are a sign of strong community engagement efforts. They are increasingly achievable as the planning industry develops more robust tactics and shares best practices during this crucial development period in virtual engagement.
We’ll have case studies, best practices, and more tips for equitable community engagement, tools and techniques for success, and more at VPET22! For more information on the Conference on Virtual Public Engagement for Transportation Planning, check out our conference website.
If you haven’t already, click here to register to attend! If you have any specific questions, please don’t hesitate to reach out directly to us at events@metroquest.com.