Tag: MetroQuest Survey Demo

  • [SURVEY OF THE MONTH] Shaping the Transportation Future of the Memphis Area

    [SURVEY OF THE MONTH] Shaping the Transportation Future of the Memphis Area

    The Survey of the Month series is a monthly blog where we highlight the extraordinary work our customers are doing! We feature well-designed surveys and share takeaways that are relevant for anyone interested in making the most out of online engagement using MetroQuest’s survey platform. To see more in the series, visit the blogs here.

    This month, we are sharing a long-range transportation plan initiative led by the Memphis Urban Area Metropolitan Planning Organization (MPO) for the Mid-South Region, an area spanning southwestern Tennessee and northwestern Mississippi.


    The Moving Together: 2050 Regional Transportation Plan (RTP) sought feedback on future transportation priorities, broad ideas and potential enhancements with the goal of improving overall transportation conditions in the Mid-South Region.

    The team launched a MetroQuest survey at the start of 2022, and it demonstrated clearly that a survey can be quick to complete yet still collect thousands of data points to inform future planning. Every day we are bombarded with constant notifications and information from social media, traditional media, family, friends, and work. Today, surveys must compete with a ton of other priorities. That’s why MetroQuest’s fun, interactive surveys are so effective at turning initial visitors into actual survey participants.

    Below, we will showcase why the Moving Together 2050 RTP Survey was such a great example of an easy-to-digest format that still collected key feedback by engaging over 500 people!

    The secret? A fun, engaging survey and a well-thought-out outreach strategy.

    What’s the story? Engaging the Region about Transportation Goals, Objectives and Priorities

    The Moving Together: 2050 RTP is the Mid-South Region’s plan for defining the vision of future transportation in the region. To ensure that recent trends and priorities are reflected in the plan, the RTP is updated every four years.

    The MetroQuest survey was launched on January 6, 2022 and remained open for input until February 11. It gathered a mix of qualitative and quantitative feedback from over 500 participants!

    Before the release of the survey, the MPO had developed an extensive outreach campaign that was aimed towards getting higher engagement and participation levels, as compared to their past outreach efforts. Due to the online nature of the survey, special attention was given to the development of social media and other online content for sharing, with the primary focus to make the information catchy and interesting. Beyond sharing the survey through daily posts on the MPO’s social media accounts, the MPO also:

    • Partnered with its member agencies, which in turn shared the MPO’s postings on their social media accounts;
    • Featured the survey in local agency newsletters;
    • Distributed posters with a QR code to the survey to the major libraries and community centers;
    • Added a website pop-up notification with a survey link;
    • Promoted the survey on the Nextdoor App, a new tool that had not been used in past efforts.


    See below for some examples of the social media posts shared by Memphis MPO and partner organizations during the engagement process.
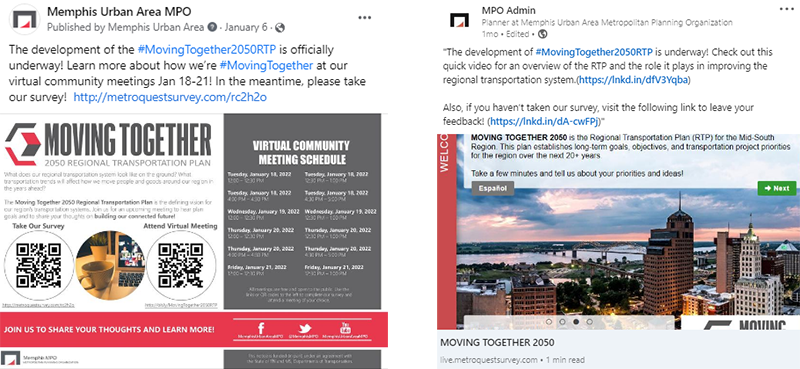
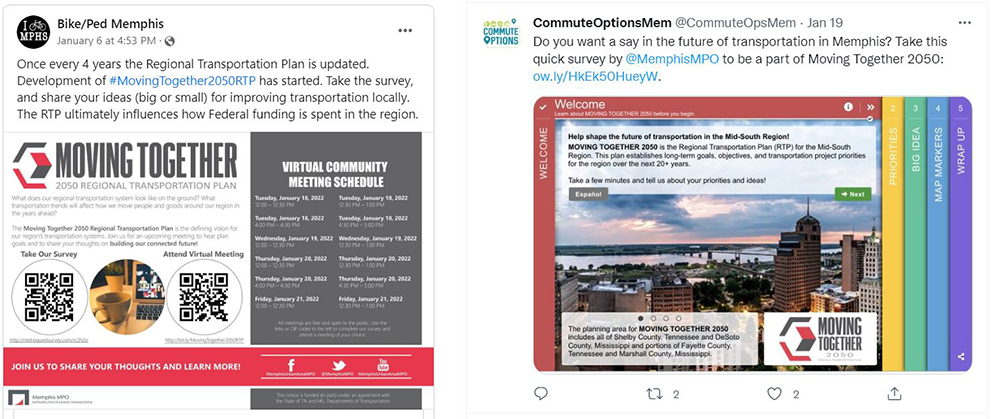


    Example social media posts on Twitter, Facebook and LinkedIn
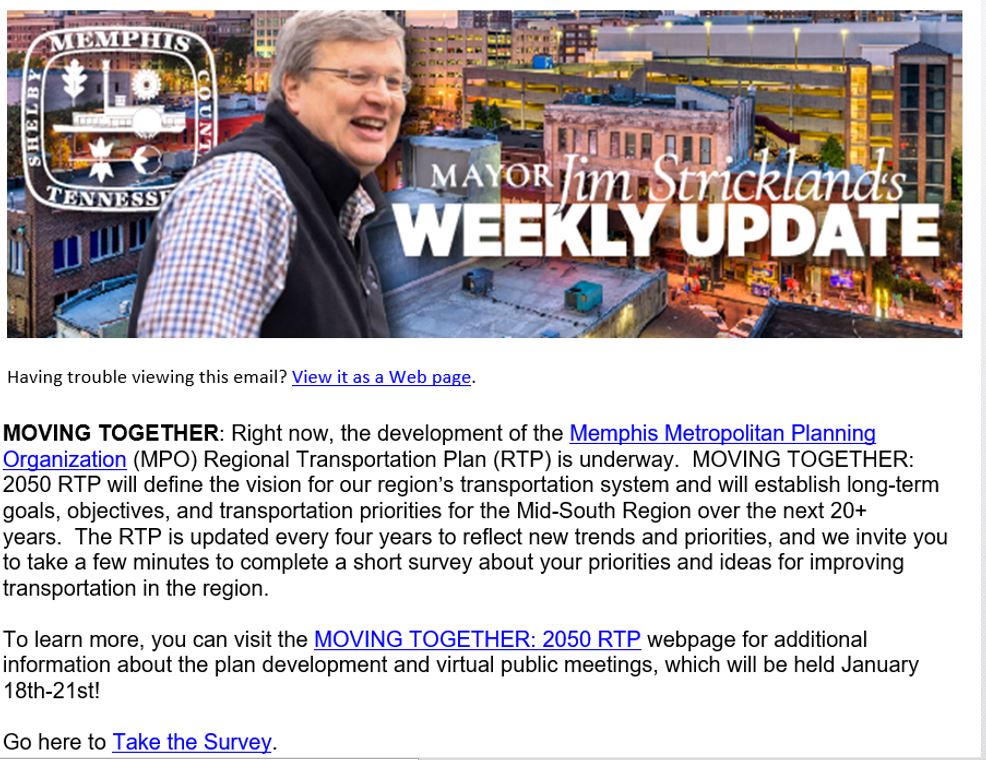
     

    Inclusion in the Memphis Mayor’s Newsletter
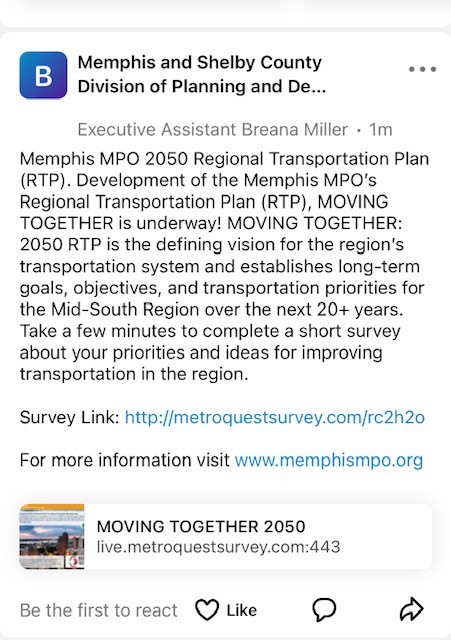
     

    Post on Nextdoor App


    This campaign strategy exemplifies how a well-planned, comprehensive outreach campaign is key to ensuring your survey reaches your audience and engages hundreds, if not thousands, of participants and gathers the input you need to move your project along.

    To learn more about this initiative, visit the Moving Together: 2050 Regional Transportation Plan webpage.

    Anatomy of a Regional Transportation Plan Survey: Gathering key input to help the region continue moving together!

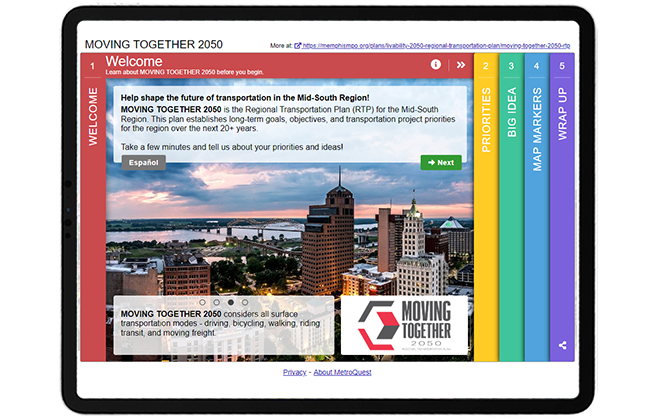
    Right away, the survey draws visitors in with a colorful scheme and captivating Welcome Screen image. This first Screen also features many other key items we recommend: a brief project description, a well-designed project logo and a link to the alternate language version of the survey. You’ll notice that the Screen quotes “a few minutes” for the length of the survey, indicating right at the start that this survey won’t take too long. For the best participant experience, we recommend aiming to create surveys that take approximately 5-minutes to complete.


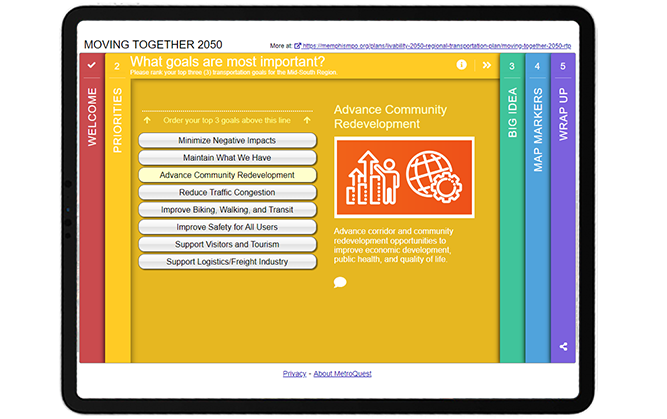
    As with many MetroQuest surveys, the first interactive Screen is a Priority Ranking exercise. The priorities are written in plain language and easy to understand. Each priority is matched with an icon graphic allowing participants to immediately identify the topic. By asking for three of the eight goals to be ranked, the exercise is simple and will elicit actionable data on what goals matter most to the region.


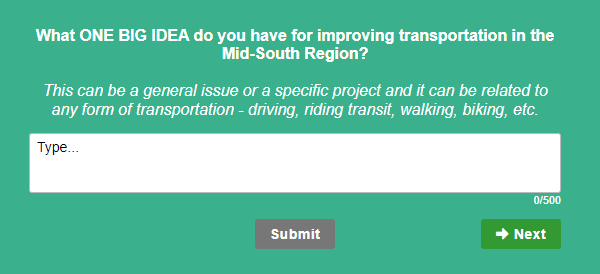
    The middle Screen presents a unique method for open-ended feedback, asking participants to indicate “ONE BIG IDEA” for improving transportation in the Mid-South Region. The Vision Statement Screen is an excellent tool to gather broad qualitative feedback and allow participants to vocalize their opinions entirely in their own words.

    We love how this survey took this Screen and, rather than asking for feedback on a pre-written statement, asked the community to come up with ideas. The question is specific and detailed enough to elicit quality responses.


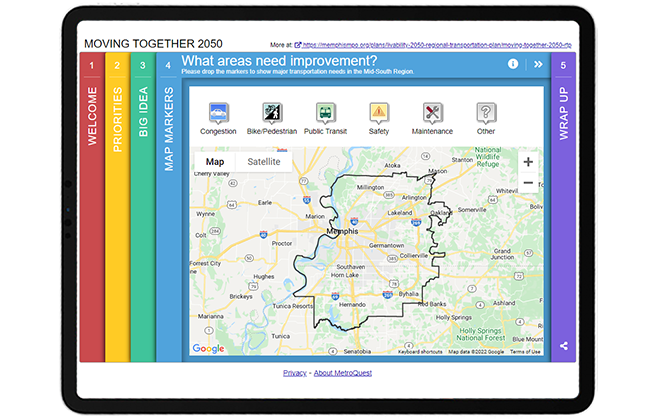
    If you are familiar with MetroQuest surveys, you will likely recognize this fourth Screen—the Map Marker Screen! By placing this Screen fourth, participants had a chance to warm up to the project and prepare their thoughts to provide specific location-based data about transportation improvements. Six different markers allow for a huge range of data on various improvements needed for: traffic congestion, bike/pedestrian transportation, public transit, safety and maintenance.


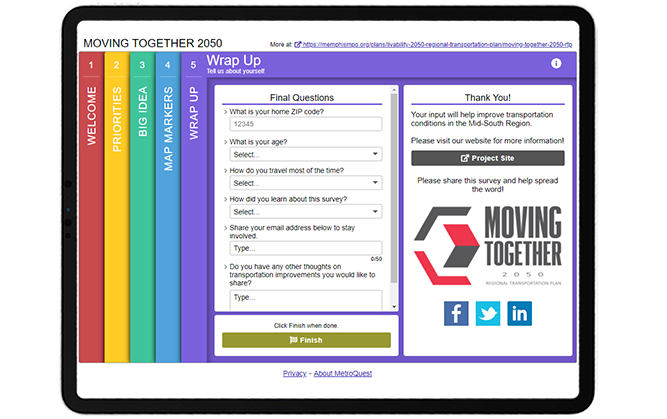
    As with all MetroQuest surveys, the final Wrap Up Screen provides a space for few quick final questions to gather demographic information, optional contact details and final thoughts.


    Try out the survey yourself through this demo version!


    5 Tips from the Moving Together 2050 Survey: Great Visuals and Quick Activities to Engage Hundreds

    We’ve highlighted many great features of this survey above. Here are five key tips to remember for your future surveys to turn visitors into participants!

    1. Make sure your Welcome Screen is inviting: By featuring eye-catching colors and a beautiful aerial image on the first Screen, participants instantly know this is not your standard survey and will be interested to continue. It is important to make sure your Welcome Screen highlights why you want feedback and that the survey will be quick to take, as this survey introduction indicates.
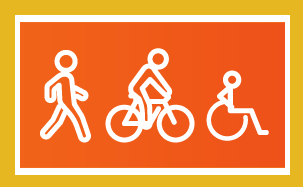
      2. Use consistent, clear graphics and visuals: The use of icon graphics on the Priority Ranking Screen is an excellent way to include visuals if you don’t have images that represent each topic. Graphics which are all designed in the same color and visual style can help prevent bias that comes from comparing images, as naturally we are always drawn to select the best-looking image.
      3. Write a well-defined question on the Vision Statement Screen: Rather than gathering feedback on a vision statement for the project, this survey took a unique approach with this Screen and asked residents to come up with one big idea. Since this question was written with a direct ask, participants are more likely to provide quality answers. Generally, the more specific you are with open-ended questions, the more precise the feedback will be.
      4. Make sure your Map Marker Screen map is properly centered: The KMZ/KML layer on the Map Marker Screen is automatically centered on the Screen so participants do not need to move or zoom-in/out to see the project area. The black border outline clearly defines the area for input.
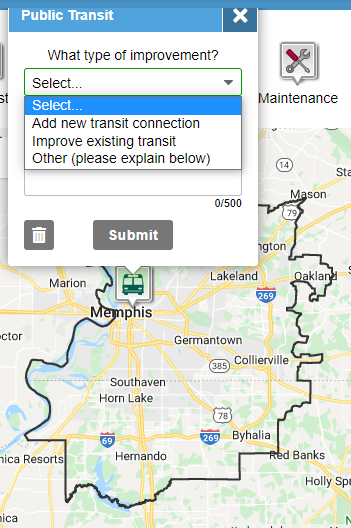
      5. Use dropdown questions on the Map Marker Screen: The Map Marker Screen is an excellent way to gather geospatial data but it’s important to consider what each Marker is asking. We recommend always including a dropdown question (example shown left) in addition to a comment box for each Marker so you can gather a mix of quantitative and qualitative data. Qualitative responses can be time-consuming to analyze so it can be very helpful to also gather data on consistent items to compare in aggregate.
     

    Kudos to the Memphis Urban Area MPO team on their excellent survey design! The Moving Together 2050 survey is a perfect example of how to effectively engage a region about their transportation future while keeping the survey simple and quick to complete.


    For more great tips on how to make the most out of MetroQuest, contact our Customer Experience team or reach out for more information!

    Want to learn more about how MetroQuest supports community outreach on your next transportation plan? Check out our recent webinar:

     

    Forum on Measuring Public Involvement Effectiveness for Transportation Agencies

    Forum on Measuring Public Involvement Effectiveness for Transportation Agencies

    In this interactive webinar forum, public involvement leaders from TxDOT, NCDOT and GDOT share how agencies can ensure that their public engagement programs are an effective and efficient use of public resources!


    WATCH WEBINAR


  • [SURVEY OF THE MONTH] Envisioning Sustainable Transportation for the San Joaquin Region

    [SURVEY OF THE MONTH] Envisioning Sustainable Transportation for the San Joaquin Region

    The Survey of the Month series is a monthly blog where we highlight the extraordinary work our customers are doing, along with some takeaways that are relevant for anyone interested in making the most out of online engagement using MetroQuest’s survey platform! To see more in the series, visit the blogs here.

    This month, we are featuring a survey with a unique approach to informing its participants: through the use of videos! Follow along as we introduce you to a survey developed by the San Joaquin Council of Governments (SJCOG) and the consulting team at Cascadia Partners.

    The Envision 2050 survey was launched through MetroQuest during summer 2021 to gather feedback on the 2022 Regional Transportation Plan (RTP) and Sustainable Communities Strategy (SCS) for San Joaquin County, California. This long-range vision and investment plan focuses on the region’s future transportation needs and sustainability targets.


    What’s the story? Planning for a Sustainable Transportation Future

    SJCOG oversees transportation, housing and habitat conservation for the San Joaquin region, which comprises several cities in California east of San Francisco, namely Stockton, Lodi, Manteca, Tracy, Ripon, Escalon, and Lathrop.

    Under the project name Envision 2050, SJCOG is updating their 2022 RTP and SCS, a process undertaken every four years to inform a 30-year land use and transportation plan. In addition to identifying future infrastructure and housing investments, this process has a particular focus on sustainability. The plan must also outline how the region can meet federal and state air quality standards and reduce greenhouse gas emissions.

    The project team used MetroQuest as an essential component of their public participation plan for this comprehensive initiative.

    The Envision 2050 survey sought input from the community on priorities for the region’s future, focusing on four different scenarios for how the region could grow:

    1. Stay the Course
    2. Remake Centers & Corridors
    3. 20-minute Neighborhoods
    4. Commuter Villages

    The survey, offered in English and Spanish, shared information on the different scenarios through short videos and gathered feedback on residents’ level of agreement to each overall scenario and a series of features for each scenario.

    The survey successfully gathered input from over 400* participants and provided valuable data to inform which scenario(s) and strategies would be recommended to the SJCOG Board for the 2022 RTP/SCS.

    Learn more about Envision 2050 and view the survey results on SJCOG’s project website.


    Anatomy of a Comprehensive Land Use Survey: Gathering Feedback on Future Scenarios

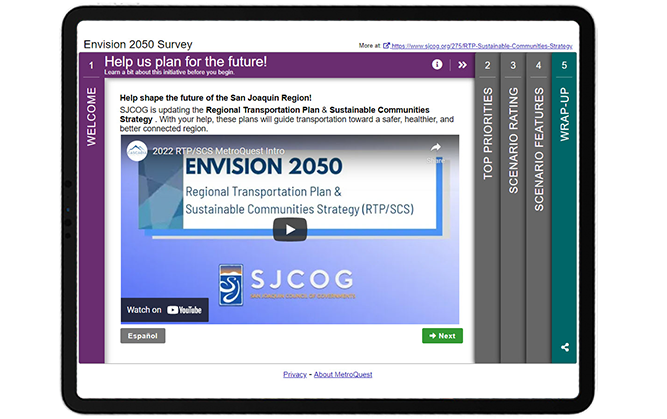
    Upon opening the survey, visitors are greeted with a video, embedded front and center on the screen. The video explains how input will be considered and introduces the initiative. This unique approach allows the survey to remain light on text while still providing important background information.

    This approach of starting with a video is particularly advantageous if your project requires a bit more extensive background information up front, and is generally a good practice to include in the Welcome Screen which delivers the first impression of the survey to visitors. Most people are more likely to click on a video rather than read a wall of text, increasing the likelihood of visitors continuing to Screen 2 of the survey!


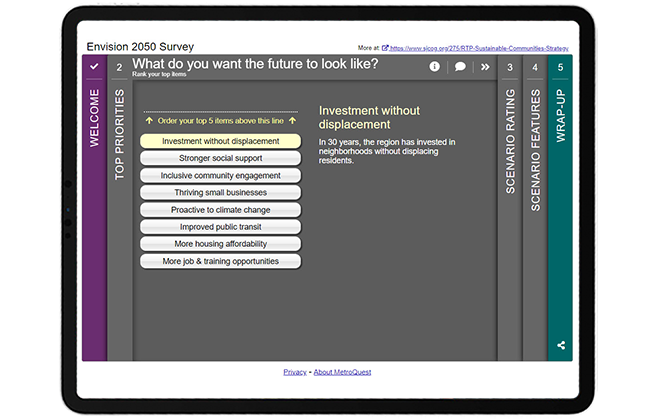
    Like many MetroQuest surveys, participants are introduced to the interactive part of the survey through a Priority Ranking Screen. This simple exercise asks participants to rank their top five of eight items. This activity is especially useful for long-range planning projects as it provides precise data on the priorities of the community. SJCOG’s survey asks for respondents to rank priorities such as improved public transit and more housing affordability among other topics. In many cases, it can be beneficial to include images next to each priority to make this Screen more welcoming and easier to navigate, as well as to appeal to visual learners.


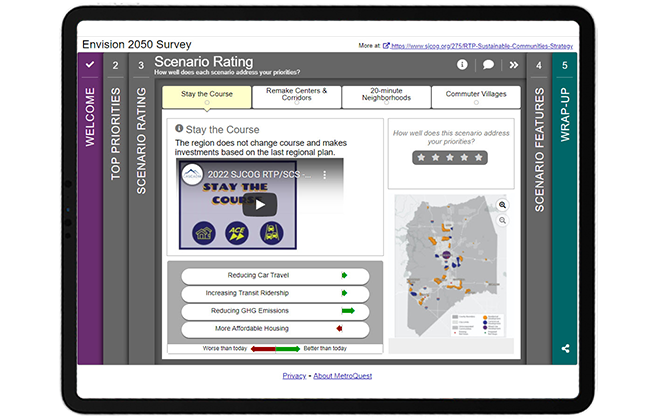
    Screen 3 utilizes MetroQuest’s unique Scenario Rating Screen format which provided a perfect platform for the project team to present all four possible future scenarios. Each of the four tabs on this Screen shares context and information through a brief video description of the scenario, arrow indicators showing how the scenario would impact the community, and a map presenting land-use changes. The most important piece on each tab is the five-star rating scale, where participants can rate whether the scenario addresses their priorities. The engagement team did several things very well on this Screen and on the Survey overall: we will discuss this in more detail later in this blog post.


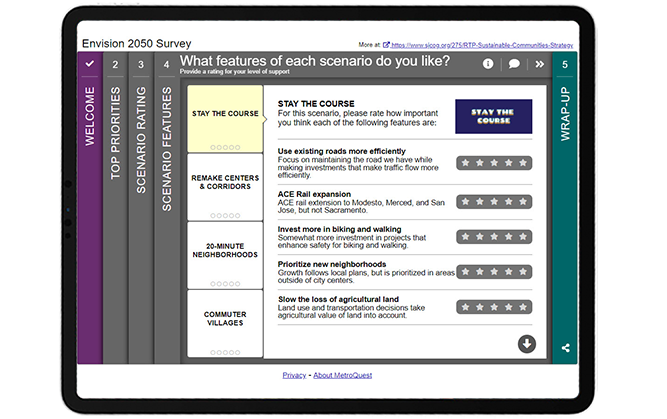
    Following the Scenario Rating Screen, participants are presented with the Strategy Rating Screen which in this case was used to rate various features of the four scenarios presented on the earlier Screen. By using the same consistent names for each scenario, this Screen transitions seamlessly from Screen 3, avoiding any confusion as can often be the case with surveys asking for feedback on various options. Each feature includes a sentence-long description to help explain the impact it would have on the community. You will notice that the images in the top right of this Screen retain the same branding from the videos on the previous Screen. The visual and language consistency throughout the survey is an excellent example of how well-executed, clear content can make a huge difference in helping participants understand a survey and provide valuable feedback.


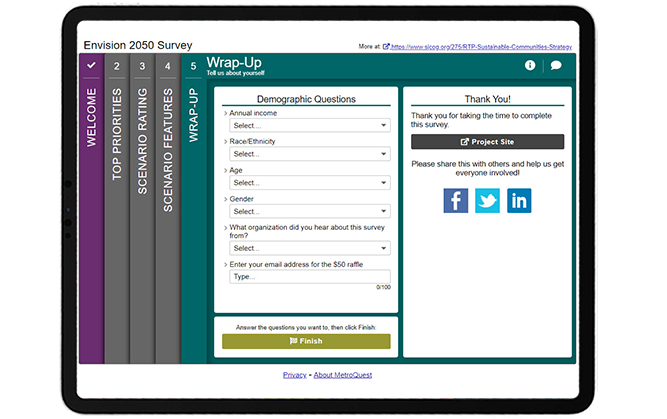
    The last Screen completes the survey with four simple dropdown questions asking for demographic information on income, race/ethnicity, age and gender. It also asks how participants heard about the survey, which can be valuable information to inform future engagement initiatives.


    Try the survey yourself! Complete this demo version of the Envision 2050 survey to try the survey live. Your responses will not impact the survey results. Don’t forget to come back to this tab to keep reading the next section below where we share some helpful takeaways!


    5 Tips from the Envision 2050 Survey: Engaging Videos and Consistent Content Makes all the Difference!

    The project team successfully used MetroQuest to design a long-range comprehensive survey that was engaging and informative yet quick to complete. Long-range planning is complex and its materials wordy but the use of videos throughout helped participants make an informed decision before providing feedback. Additionally, planning for the future can often feel abstract and far away. To allow participants to better imagine the reality of each scenario, the videos included on the Scenario Rating Screen were narrated in the voice of someone from the future. These types of features are just a few examples of what set this survey apart and contributed to an overall interactive participant experience.

    Here are 5 takeaways from this survey to keep in mind when you design your next survey:

    1. As mentioned above, this survey featured five embedded videos, all under one minute in length. The inclusion of videos eliminates the need for a significant amount of text, adding to the interactive and engaging tone of the survey. By keeping the videos short, the SJCOG team successfully ensured their survey remained quick to complete, increasing the likelihood of receiving high-quality feedback. Additionally, the inclusion of text in the videos allows the survey to remain accessible for the hearing impaired. Embedding videos is explained on our support website.
    2. Consistency was key with this survey! Since many participants learn about an initiative at the time of taking a survey, especially in this age of virtual engagement, it is crucial to keep terminology and naming consistent and simple to avoid any confusion. Consistent naming of the four scenarios throughout the survey and consistent branding with differentiated colors for each scenario helps tie everything together. These small design elements can be the difference between someone understanding the survey and providing accurate feedback or someone getting confused and giving up on the survey prematurely.
    3. One of the primary features of the Scenario Rating Screen (Screen 3 in this survey) and a unique feature of MetroQuest is the green and red arrow indicators that show how each scenario impacts the community differently. This survey makes great use of this feature by showing how every scenario would impact four important factors: reducing car travel, increasing transit ridership, reducing GHG emissions and more affordable housing. Participants could weigh their preference for each scenario by looking at whether the factors would be worse or better than today.
    4. Also on the Scenario Rating Screen, the project team included map images showing different zoning areas and boundaries for each future scenario. By utilizing a consistent map format that was sized and formatted the same way in each of the four tabs, participants can easily flip between scenarios to see how the map changes. This too helps participants identify which of the scenarios most aligns with the future they wish to see.
    5. The fourth survey Screen utilizes the Strategy Rating Screen, gathering ratings on several features for each of the four future scenarios. This Screen continued to use consistent naming and branding to ensure a smooth transition from the previous Screen and that respondents could differentiate between the options. Including concise, action-oriented descriptions for each feature allows for well-educated feedback and, subsequently, quality data!


    Congratulations to the project team at SJCOG and Cascadia Partners for creating a fun and interactive MetroQuest survey! Their use of videos brought the future of the San Joaquin region to life and most importantly helped their team collect important community input.

    For more great tips on how to make the most out of MetroQuest, contact our Customer Experience team or reach out for more information!


    * This survey was a target of what is known as ballot-box stuffing, an infrequent but persistent issue where duplicate or fraudulent responses are submitted to skew results or increase changes of winning a monetary incentive offered to survey takers. In this case, it was likely the latter, as a $50 raffle was offered to participants. In total, over 4,000 participants interacted with the survey but many had to be filtered from the final data set, resulting in approximately 400 valid participants. If your organization is considering offering an incentive for your survey respondents, we recommend using local prizes that only someone in your community could use. We have found that non-location-specific rewards such as cash or a gift card to a nation-wide or online retailer often encourage ballot-box stuffing. Rest assured, if ballot box stuffing should occur with your survey, MetroQuest has steps to address it to ensure data integrity.


    Want to learn more about how MetroQuest supports community outreach on your next transportation plan? Check out our recent webinar:

    The Key TO Great Public Engagement Results:
    How KYTC Engaged 8300+

    The Kentucky Statewide Transportation survey collected more than 140,457 public responses and comments in just over a month! In this webinar, the team shares the complete process that led to this public engagement success.


    WATCH WEBINAR