[SURVEY OF THE MONTH] SCDOT Engages Thousands for Isle of Palms Bridge Survey

The Survey of the Month series is a monthly blog where we highlight the extraordinary work our customers are doing! We feature well-designed surveys and share relevant takeaways for anyone interested in making the most out of online engagement using MetroQuest’s survey platform. To see more in the series, visit the blogs here.
Head down south with us to Charleston as we showcase a survey from the South Carolina Department of Transportation (SCDOT)! SCDOT has been a long-time MetroQuest customer, and we were thrilled when their Isle of Palms Connector Bridge survey amassed nearly 4,000 responses in just a few days.
Keep reading to learn what led to this immediate community response, highlights of the survey design, and key takeaways.
What’s the story? Grassroots Engagement Reaches Commuters
In January 2023, SCDOT, in collaboration with civil engineering team, RK&K, efficiently designed a MetroQuest survey to gather feedback on how the Isle of Palms Connector Bridge could be improved.
The Isle of Palms Connector Bridge spans nearly four miles, linking the town of Mount Pleasant (a suburb in Charleston County) to the long narrow strip of an island known as the Isle of Palms. Boasting large sand beaches, vacation homes, resorts, and plenty of recreational opportunities, it is not hard to imagine that many venture out to the shore via this bridge.
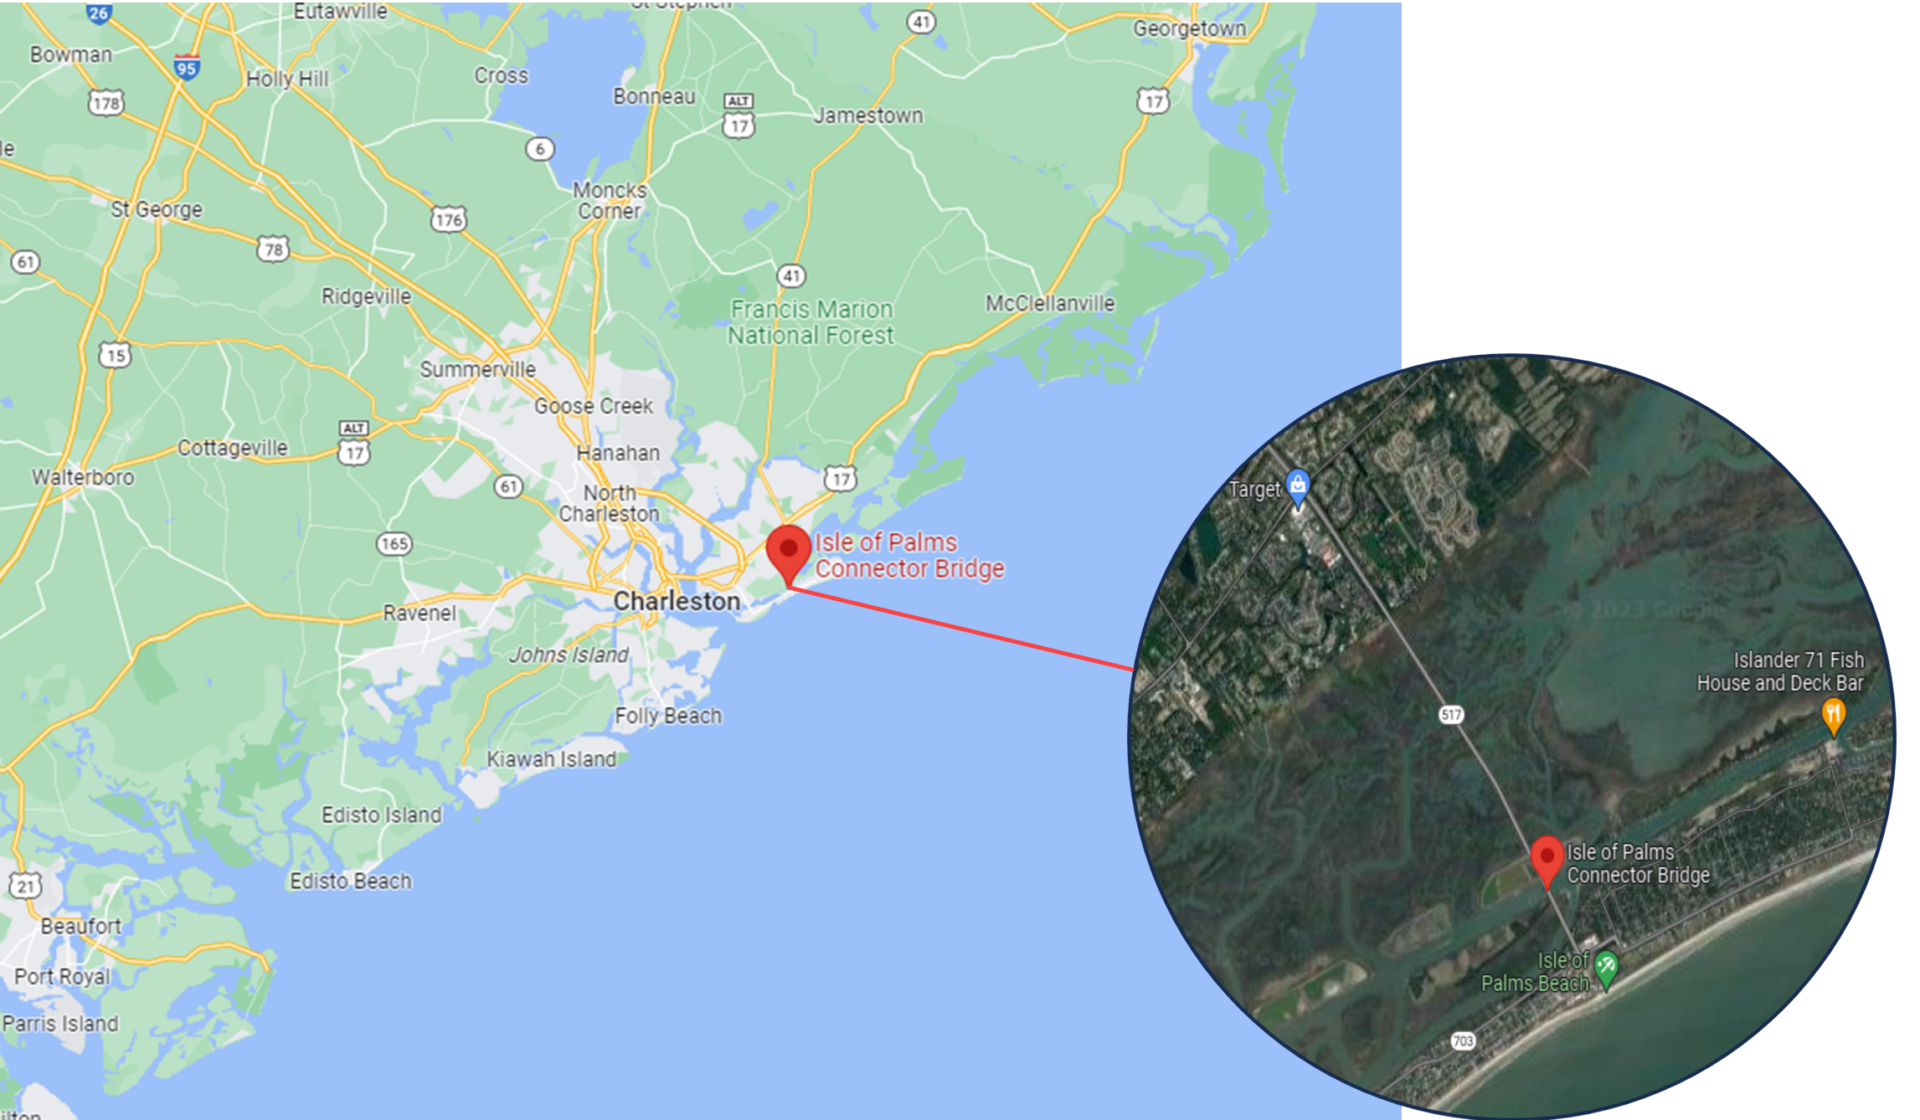
Google Maps view of the Isle of Palms Connector Bridge.
The project team designed a MetroQuest survey that presented five bridge layout concepts, including the current design. With it being important to maintain access for all modes of travel, the concepts included various ways to accommodate cyclists and pedestrians.
Knowing what design factors mattered most to the community and stakeholders, the team took a very focused approach to the survey design. They asked questions they knew would be important to the community and those who frequent this bridge. This method resulted in receiving high-quality feedback from thousands and is precisely the survey approach we like to see!
You will rarely receive quality feedback if you ask everything imaginable. If your survey is infrastructure-related like this one, don’t ask about every single design detail; instead gather feedback on the aspects you know will be most relevant and of interest to your audience.
Engaging Over 1k in One Day
What set this survey apart was the immediate response it received upon launch. Following the initial promotion, the survey collected feedback from nearly 2,000 individuals in just two days. As shown in the graphic below, over 1,000 people took the survey on Wednesday, January 18. This is particularly impressive given that this occurred right after the busy holiday season. Steady engagement continued until the survey closed in mid-February 2023.
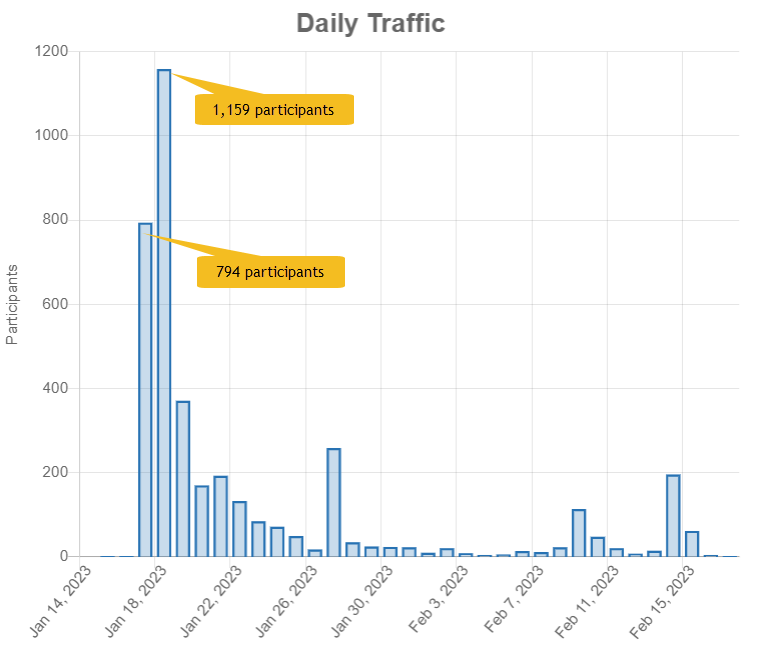
Graph showing the immediate spike in participants during the start of the survey.
The project team shared the news about the survey via social media as well as through connections with local organizations. This grassroots effort helped spread the word rapidly throughout the area, mostly through digital channels. Additionally, SCDOT staff notified stakeholders about the survey before the launch, building awareness ahead of the engagement period. Clearly, this approach resulted in a very immediate response.
When surveying thousands of participants, it is critical to ensure that the concepts and questions are easily comprehensible. The over 61,000 data points collected for this survey demonstrates why it is essential to design a survey that gathers the input needed for your project. You don’t want to spend time filtering through irrelevant data.
Anatomy of a Bridge Survey: Cross-sections Illustrate Concepts
The Isle of Palms Connector survey followed a methodical approach to gathering feedback. Initially, participants were asked to rank four overarching goals of the project. Then, they were asked to indicate the condition of the current bridge, how they envision the future of the bridge and finally, rate five alternative concepts.
To view each Screen in detail, open this demo link in a separate tab.
As we move through the survey, notice how simple and concise Screens 2 to 5 are. Some participants may initially skim the survey to see what they are getting into. Keeping it quick helps retain those who may otherwise exit the survey if they see an extensive list of questions.
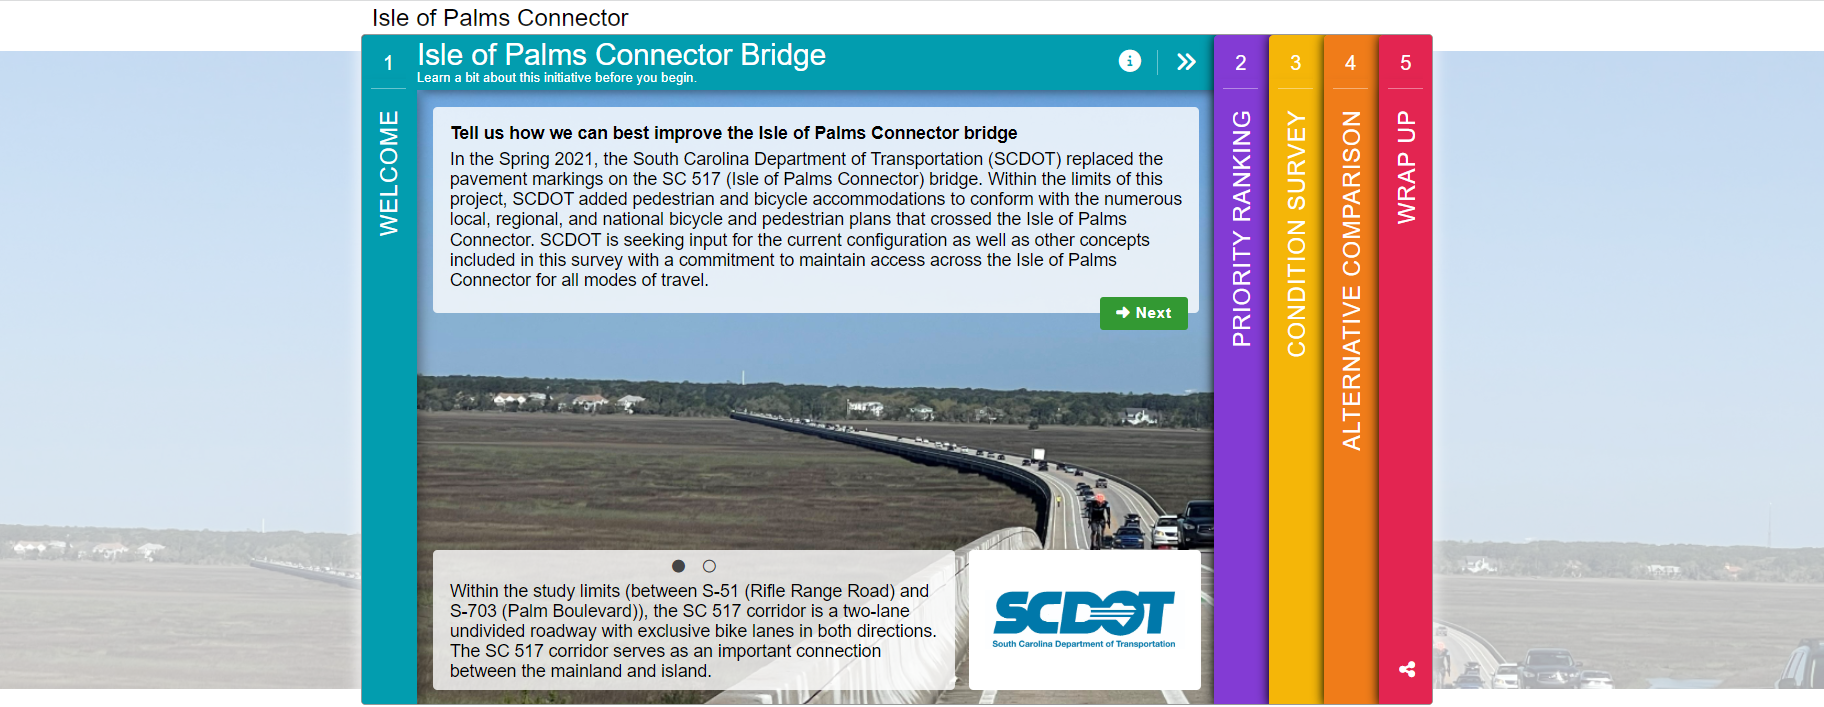
Screen 1: Welcome
The Welcome Screen provided background context on the project. In this case, the project team did not use a project website so having a bit more detail on the Welcome Screen was necessary. With that, the ask was still clear, simply: “Tell us how we can best improve the Isle of Palms Connector bridge”.
Screen 2: Priority Ranking
Almost every Survey of the Month we feature includes a Priority Ranking Screen, usually on Screen 2. What is unique here is that they minimized it to ranking four options. In general, the fewer options provided, the more accurate ranking values will be. Additionally, seeing where participants rank vehicle access compared to pedestrian and bicyclist access shows how they plan to use the bridge.
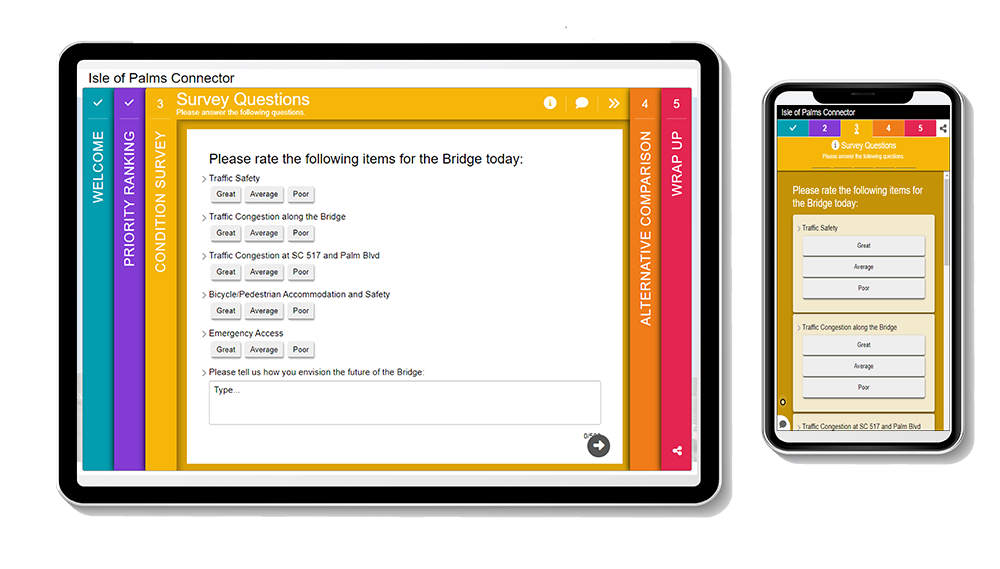
Screen 3: Standard Survey
Next, the project team made use of the Standard Survey Screen to run through a series of quick rating questions that would only take a matter of seconds to complete. At the end, they left room for an open-ended comment about “how you envision the future of the bridge”. Additionally, using three simple response options (great, average, poor) for the rating questions left less room for misinterpretation.
These quick quantitative questions elicited precise, informative data for the project team, supplemented by more context in the open-ended responses.
Screen 4: Image Rating
Screen 4 is the core of the survey, where participants are presented with five bridge concepts. By now, those taking the survey have had a chance to warm up and get into the headspace for providing key input. Yet at the same time, the briefness of the earlier Screens means they can dedicate more time to reviewing and contemplating the proposed concepts.
When showcasing design concepts, always use a visual that someone non-technical can understand. We particularly like the realistic cross-sections on this Screen. The consistency between images facilitates effortless comparison between tabs and highlights the critical differences between these key concepts.
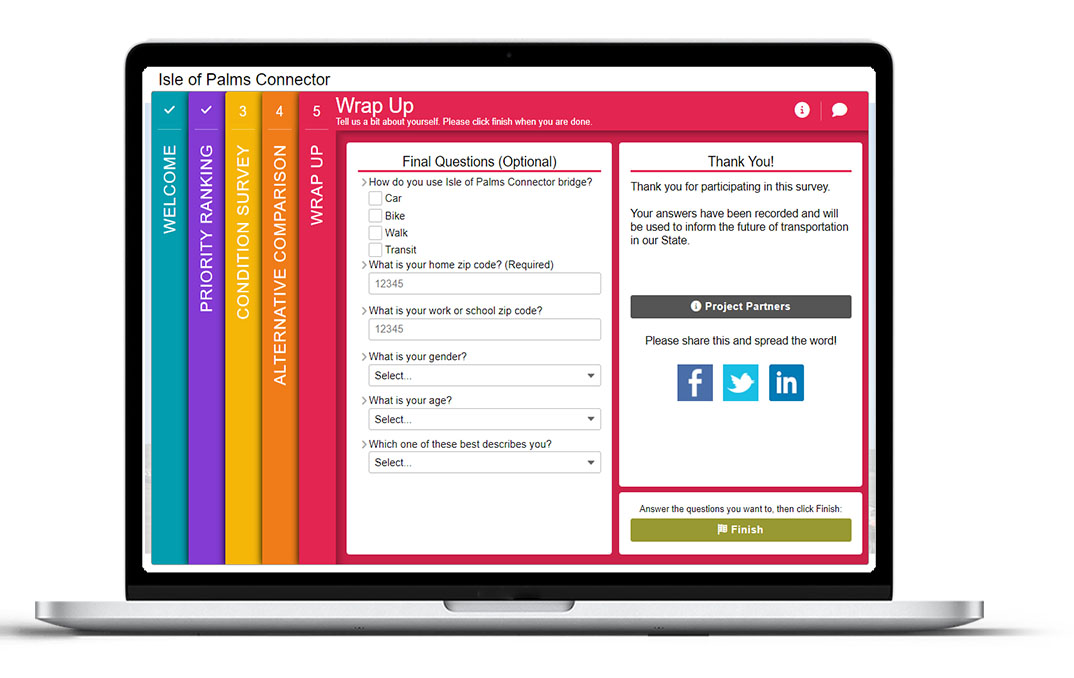
Screen 5: Wrap Up
As usual, the final Screen concludes the survey with a few quick questions. By asking participants to select how they currently use the Isle of Palms Connector bridge, the project team could easily see which concepts were preferred by certain user groups. Gathering demographic information around location, gender and age also helped frame the data that came in and ensured the project team was engaging a relevant yet diverse group of people.
5 Tips from the Isle of Palms Connector Bridge Survey:
There are many best practices to remember from this survey. To wrap up, these are our five primary takeaways:
- Utilize community networks to spread the word: As detailed earlier, the project team took a grassroots approach to notify community stakeholders and organizations. Informing a range of local organizations and encouraging them to share the survey ensured a wide array of individuals were aware. Outreach even before the survey launched also helped build awareness and anticipation for the survey once it was live.
- Ease into things: If there is a particular portion of your survey that is most crucial, instead of jumping immediately into it, provide a few initial questions or exercises that help educate yet also warm up your participants to the subject matter before you present them with the portion of the survey that may require the most thought or time. It is vital to start simple and build on the content.
- Prepare but preserve attention for the key ask: Similar to the last point, consider which parts of your survey you want participants to spend the most time on, and design other complementary portions to take minimal time. Screens 2 and 3 of this survey are a great example of this as they allowed participants to skim through the survey quickly until they hit the key exercise on Screen 4.
- Spend time on your visuals: Make sure the visuals in your survey are not an afterthought, especially if they are being used to inform feedback. Keep all visuals simple and realistic, supplementing with text captions and labels.
- Consider the data output: With quantitative questions, providing many different response options can be tempting. There is a balance between offering enough choices and gathering succinct data. This survey’s use of four priority ranking options and simple three-choice questions on the Standard Survey Screen ensured data in the back end would be straightforward to analyze.
Don’t forget to go through the demo survey and try out the questions to experience the simple, effortless design of this survey.
We were thrilled to finally showcase a survey from SCDOT. Their team has been using MetroQuest for a number of years with much success! With the recent addition of a regional agency license, we are looking forward to seeing more and more surveys out of South Carolina.
For more great tips on how to make the most out of MetroQuest, reach out for more information, or, if you are an existing subscriber, contact our Manager of Client Services Team, Woo-Ree Cho.
Check out our latest webinar recording!

Phase-by-Phase: Unbundling MnDOT’s Winning Virtual Public Engagement Strategy