[SURVEY OF THE MONTH] How Virginia DOT is Solving Traffic and Safety Challenges with MetroQuest
![SOTM-2021-12_VDOT-Route123_805x366 (2) [SURVEY OF THE MONTH] How Virginia DOT is Solving Traffic and Safety Challenges with MetroQuest](https://metroquest.com/wp-content/uploads/SOTM-2021-12_VDOT-Route123_805x366-2.png)
The Survey of the Month series is a monthly blog where we highlight the extraordinary work our customers are doing, along with some takeaways that are relevant for anyone interested in making the most out of online engagement using MetroQuest’s survey platform! To see more in the series, visit the blogs here.
This month, we are highlighting a Virginia Department of Transportation (VDOT) survey that is part of the Woodbridge Area STARS Studies. VDOT identified significant traffic backups and road congestion in the Woodbridge Area during the morning and evening peak times. To identify solutions for alleviating the problems, the study assesses potential safety and operational improvements for the interchange of I-95 and Route 123.
What’s the story? Comprehensive Transportation Solutions to Relieve Congestion in Woodbridge
According to the project website, data from a 2019 study showed that over 300,000 vehicles a day use the I-95 and Route 123 interchange. VDOT identified the need for improvement and launched a study to assess reconfiguring ramps, extending lanes, modifying and relocating traffic signals, access management, as well as transit enhancements to improve traffic flow on the interchange. This study is part of a larger initiative called STARS; Strategically Targeted Affordable Roadway Solutions. The objective of the STARS program is to develop comprehensive and cost-effective transportation solutions to relieve congestion bottlenecks and solve critical traffic and safety challenges throughout the state of Virginia.
They created MetroQuest Surveys in English and Spanish to gauge community priorities and collect opinions around the suggested solutions.
To learn more about the project, please visit the Woodbridge Area STARS Studies website.
Anatomy of a Corridor Survey: Using MetroQuest to Understand Community’s Preferences
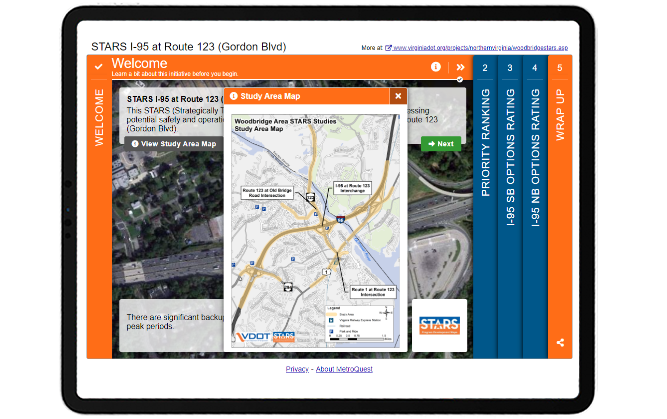
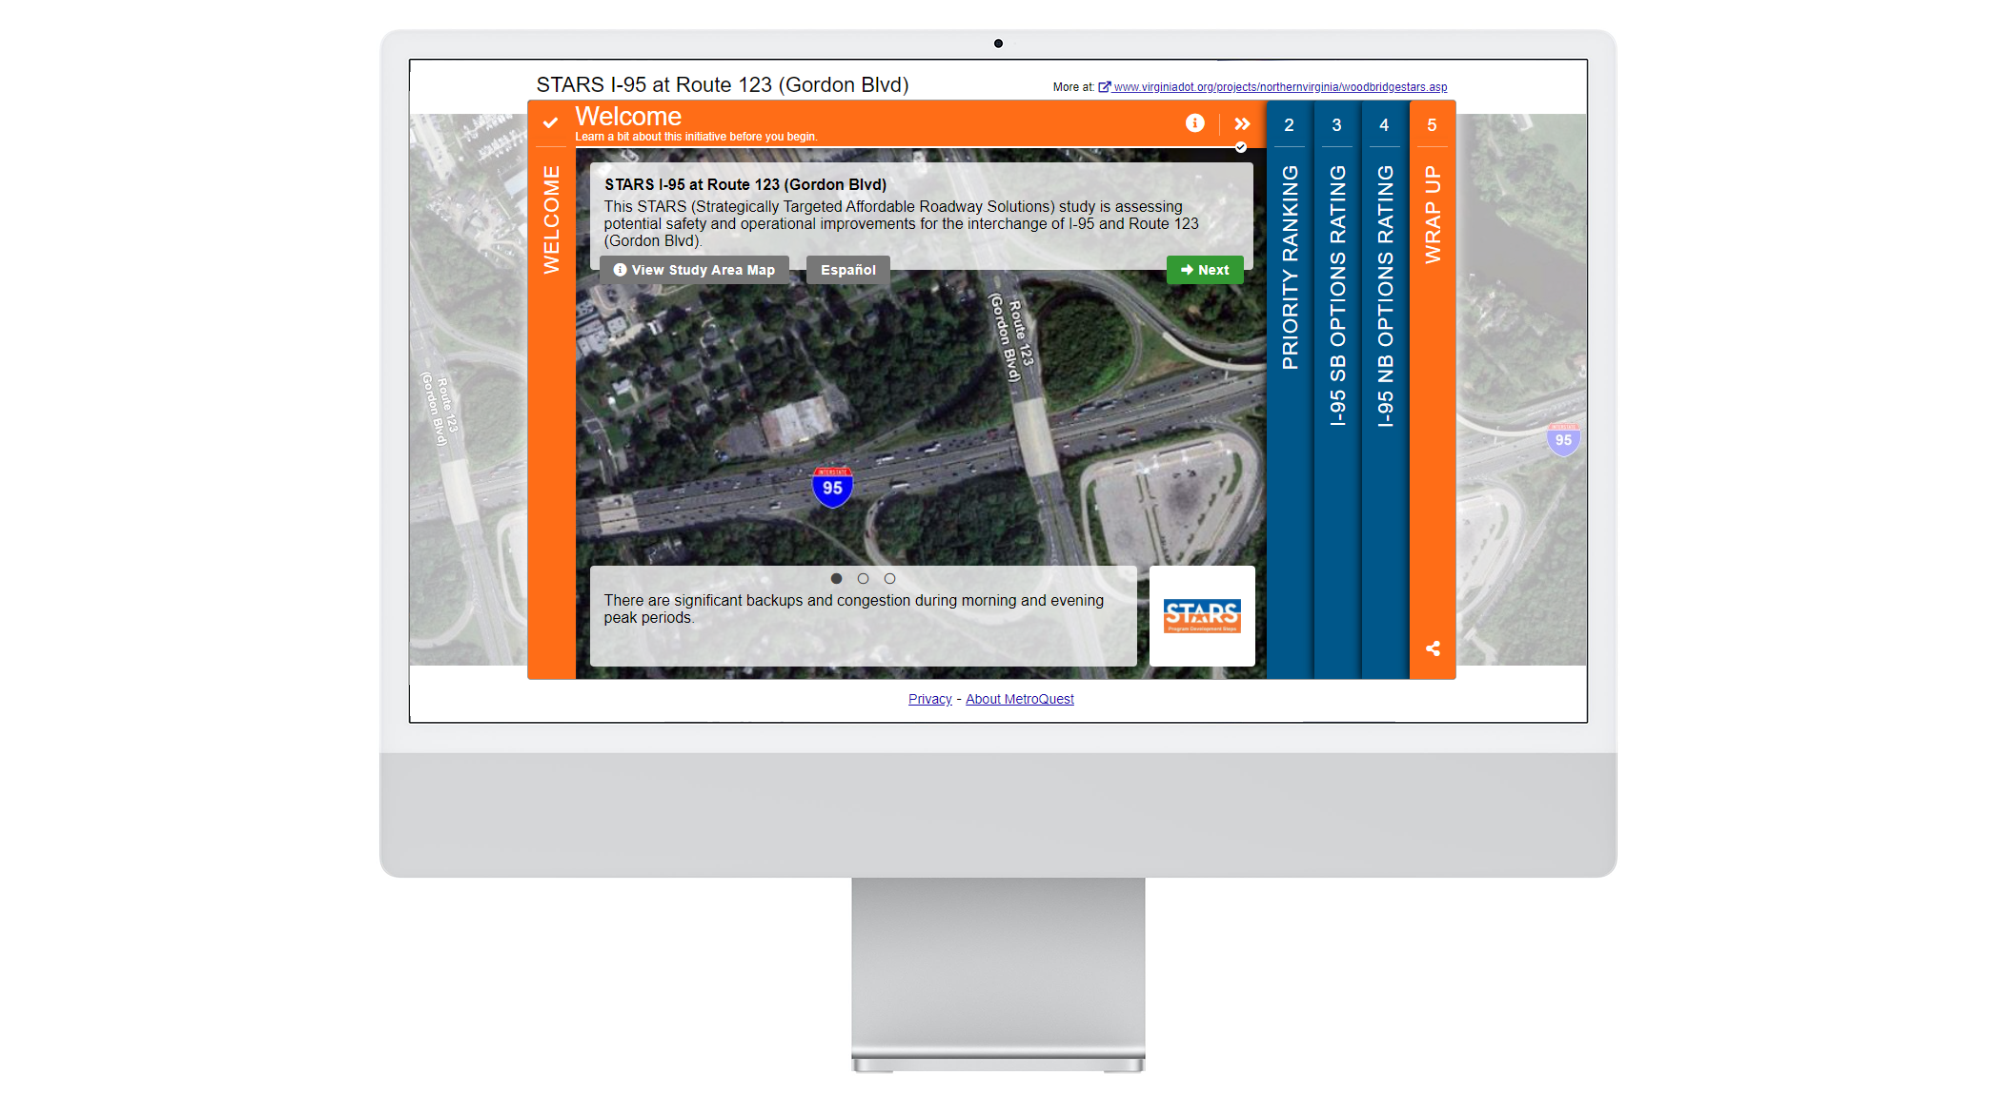
The I-95 and Route 123 Survey starts with the Welcome Screen, containing an aerial photograph of the interchange. This is a fantastic way to captivate the visitors as they can concisely read the study’s background information to quickly grasp its intention and its relevance to their lives.
Like many other successful MetroQuest Surveys, the Priority Ranking Screen follows next and is used to identify the visitor’s priorities within the study area. Visitors are asked to rank their top 5 out of 9 possible items. The priorities include significant factors such as congestion, safety, active transportation accessibility, travel time reliability and express lane improvement. Each priority includes a brief and practical explanation.
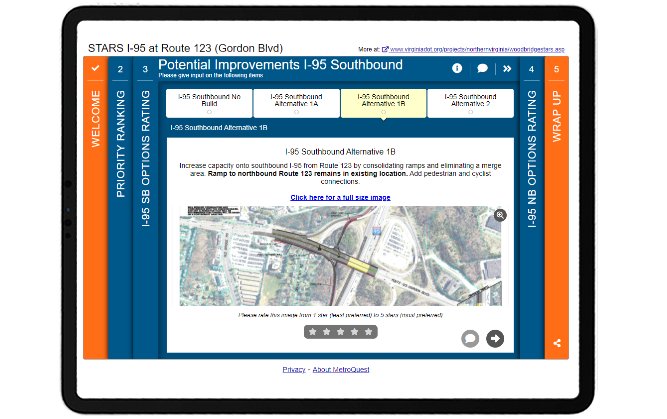
Two subsequent Image Rating Screens are utilized to present potential improvements for I-95 southbound and northbound. Each option has an image, a description of the improvement required and the predicted outcome. Participants are asked to rank each potential improvement on a 5-point scales and provide input as possible solutions with various outcomes.
MetroQuest Survey is designed to be non-linear, meaning that visitors can jump around, move backward to re-read and change their answers. The combination of the non-linear design and the Image Rating Screen plays a significant role in VDOT’s Survey, allowing the visitor to inspect and compare various suggested options in any order they prefer and make an informed decision before providing input.
Please feel free to try the MetroQuest Survey. This is a demo version that will not affect the survey results.
5 Tips from VDOT’s STARS I-95 and Route 123 Survey: Simple Yet Effective Ways to Collect Valuable Input
The STARS I-95 and Route 123 Survey breaks down complex material into comprehensible material by educating visitors, asking them to first rank their priorities before going into more detail into the priorities with possible solutions and various outcomes. VDOT engaged over 1200 participants by using multiple channels of outreach, with campaigns such as news releases to the media, targeted paid Facebook advertisements, organic Twitter posts, and email blasts.
Below are 5 key takeaways from their survey:
- The Welcome Screen draws visitors into the survey with an appealing aerial photograph of the study area and contextual information. The aerial image and the extended background features catch the visitor’s attention without being overly distracting. The rotating sliders at the bottom of the screen are used to convey essential project information.
- On the Welcome Screen, the extra popup is adequately utilized to include the study area map to inform visitors visually where the study area is. Using image maps are effective when the information you need to convey is better presented visually than in text. Image maps deliver a large amount of information in a small space and serve to make them more interactive.

- As mentioned earlier, the I-95 and Route 123 study is part of a larger program called STARS, which involves planners, traffic engineers, safety engineers and roadway engineers to jointly implement innovative and practical solutions. The STARS branding logo and the branding colors and the branding colors, orange and blue, are used to elicit a sense of pride in the region and are used throughout the Survey for brand recognition.
- The Image Rating Screens include an image, text-based description of required work and the outcomes. This is an excellent use of the Screen features to allow participants to view the differences between the alternatives so that they can provide informed input. The visitors have two options to zoom into the images to view more details:
a) When the magnifying glass icon on the top right corner of the image is clicked, visitors can view a larger image without leaving the Survey. Keeping the participants in the Survey until the end will help you achieve a higher completion rate. b) The hyperlink text “Click here for a full-size image” opens a new tab in the browser to open a much larger image that fills up the screen. In this case, it is essential to include the hyperlink as the participants are presented with complicated map images with legends to digest.
 - We do not typically highlight the Wrap Up Screen, but in VDOT’s Survey, the simplicity of their team’s demographic questions, used to collect necessary information for their study, is one of the key takeaways! They ask simple yes/no questions about whether they live or work near the study area and the home and work zip codes. To ensure your Survey reaches a diverse population, it is recommended to include demographic questions such as gender, age, race, and income. We often notice that most surveys ask for personal information such as email addresses and home addresses, but you should try as much as possible to avoid collecting personal data. Asking for the participant’s email address as a demographic question is a turn-off for the participants who believe they are doing you a favor by answering your Survey. This practice also assures the anonymity of survey responders.
Congratulations to the team at VDOT for another successful MetroQuest Survey with an outstanding turnout for their corridor study!
For more great tips on how to make the most out of MetroQuest, contact your Customer Experience manager or reach out for more information!
Want to learn more about how MetroQuest supports community outreach on your next transportation plan? Check out our recent webinar:
The Art and Science of Virtual Public Engagement for Transportation Planning
The road to success with online surveys is part art and part science. This webinar explores both by unbundling the most successful case studies and what made them so effective. Learn how to create delightful surveys that engage 1000s and deliver the results you need to support a wide range of transportation plans!


