[SURVEY OF THE MONTH] How Texas DOT Engaged Nearly 8,000 Participants in their I-20 Corridor Study
The Survey of the Month series is a monthly blog where we highlight the extraordinary work our customers are doing! We feature well-designed surveys and share takeaways that are relevant for anyone interested in making the most out of online engagement using MetroQuest’s survey platform. To see more in the series, visit the blogs here.
In this month’s blog, we are featuring a survey by the Texas Department of Transportation (TxDOT) that exemplifies how a well-designed survey is key to gathering feedback from thousands of participants! TxDOT’s I-20 Corridor Study Survey shows precisely why keeping things simple and asking only what you need to know will result in more people taking the time to complete your survey in its entirety.
Continue reading to learn how an effective communications strategy and straightforward survey design resulted in thousands of data points and quantifiable feedback for the corridor.
What’s the story? Engaging thousands through a short yet effective survey
In fall 2021, TxDOT engaged more than 7,900 participants through their most successful MetroQuest survey to date, the I-20 Texas Corridor Study. TxDOT and their consultant partners conducted this study to identify multimodal needs and prioritize improvements for the I-20 Texas corridor, one of the primary travel routes between east and west Texas.
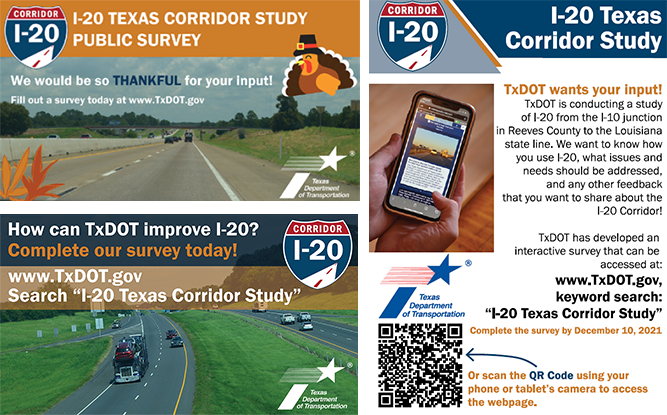
The project team developed a comprehensive communications plan along with engaging messaging and graphics to promote the survey and reach a broad audience of residents, corridor users, local businesses, advocacy groups and other stakeholders. The survey was advertised in English and Spanish through various digital and print channels, such as social media, email, newsletters, organization websites and posters.
Example promotional materials
Instead of only using TxDOT’s social media channels to share the survey, the project team expanded the promotion of the survey throughout the corridor by distributing templated materials to regional agencies, local organizations, the project steering committee, working groups and other key contacts. The team:
- Developed fliers with unique trackable QR codes and distributed them to TxDOT’s local Travel Information Centers (TICs).
- Sent requests to Public Information Officers (PIOs) along the I-20 corridor to post to their social media channels and send out press releases.
- Provided project steering committee and working group members with pre-prepared, easy to share content and images for social media, as well as advertisements for sharing the survey in print materials.
In the end, 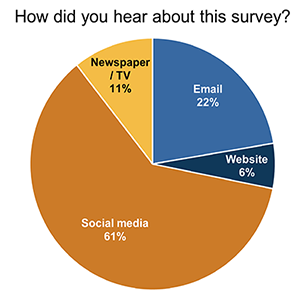 61 percent of respondents to the question “How did you Hear about this Survey?” indicated they accessed the survey through social media, demonstrating how effective their social media campaign was in driving traffic to the survey.
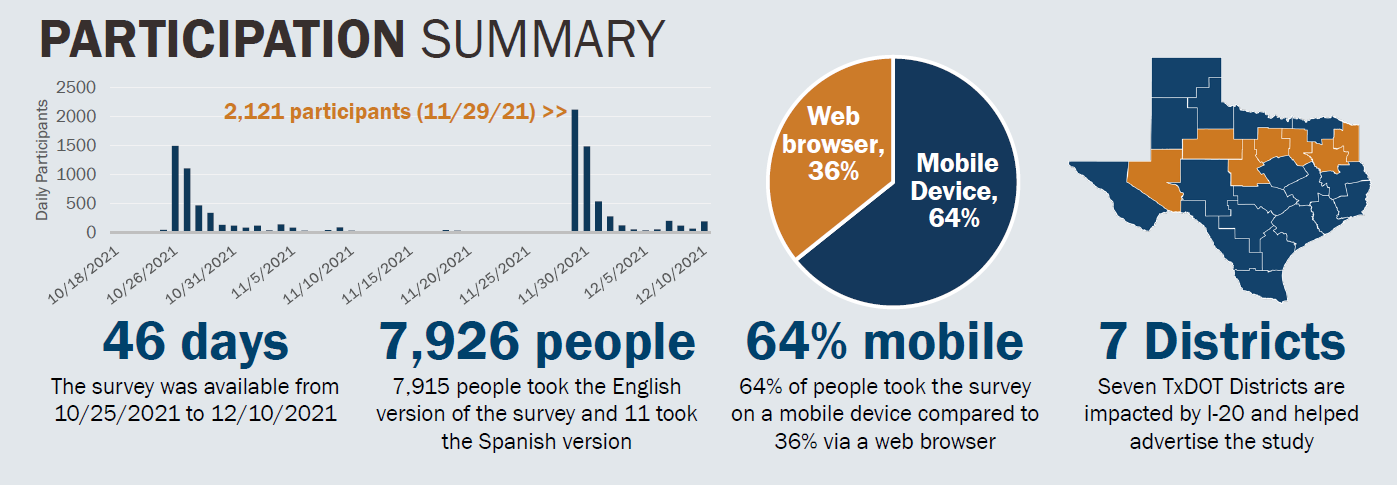
Correspondingly, 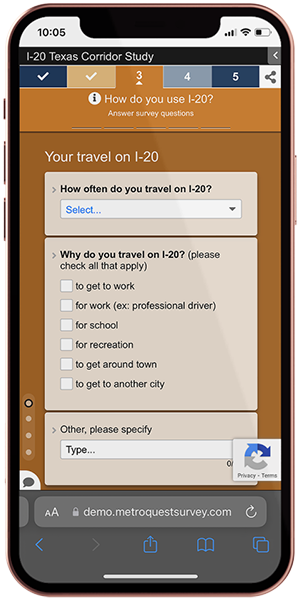 64 percent of participants accessed the survey on a mobile device. With more people finding out about surveys on social media via their mobile devices, it is essential to develop a survey that works just as well on a phone as on a laptop. MetroQuest’s Survey Editor allows you to view the survey as it would look on a mobile device while editing to make sure your content will appear properly on a phone.
The following graphic summarizes participation for the I-20 corridor survey and demonstrates the success of the TxDOT team’s outreach strategy. Over 46 days, 7,926 people participated in the survey by taking the English or Spanish version. The bar graph below demonstrates how survey participation numbers significantly increased on days where promotional materials were launched. Survey promotion was targeted across Texas in seven districts near I-20, as highlighted in orange on the map.
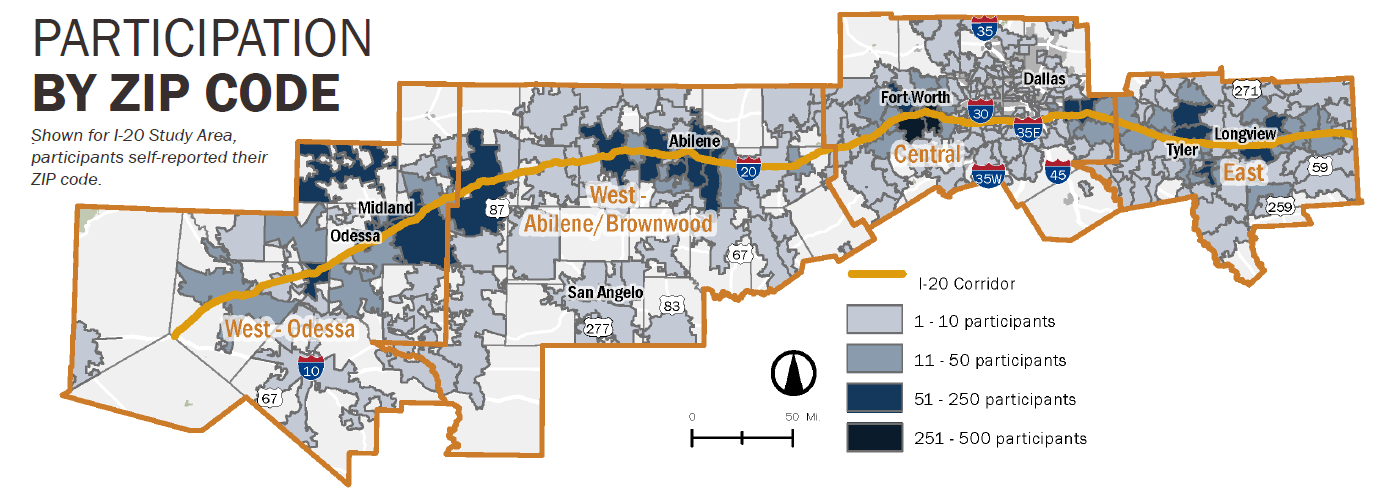
The project team also identified potential gaps in the demographic representation of participants while the survey was live by reviewing geographic representation of the responses (see graphic below showing participation by ZIP code). From this research, the team adjusted the promotional materials and focused on reaching underrepresented areas for the remainder of the survey period. This is an excellent strategy and a step we highly recommend adding during your engagement period to ensure that your survey reaches a diverse and representative audience.
To learn more about the study and the engagement process, visit the I-20 Texas Corridor Study project page.
Anatomy of a Corridor Survey: Identifying Needs and Prioritizing Improvements
As we go through the survey content in more detail, you will notice how the simplified approach taken by TxDOT makes each Screen quick and easy for participants to complete!
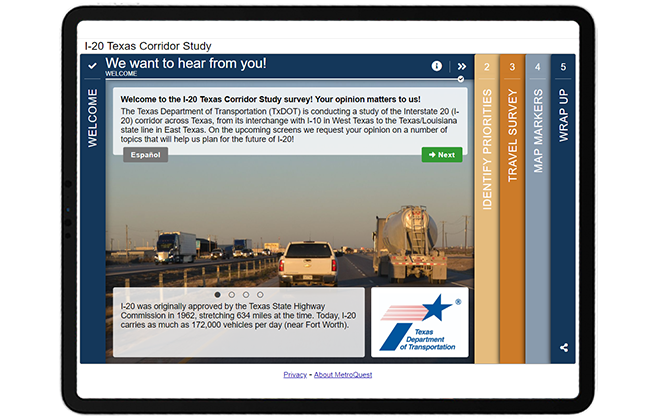
First, the Welcome Screen content greets participants with the call to action of “We want to hear from you”. It does not waste any time and immediately outlines the project location, the purpose of the survey, and some interesting but relevant facts, such as pointing out the importance of the study by highlighting the large number of bridges and interchanges on I-20 in Texas.
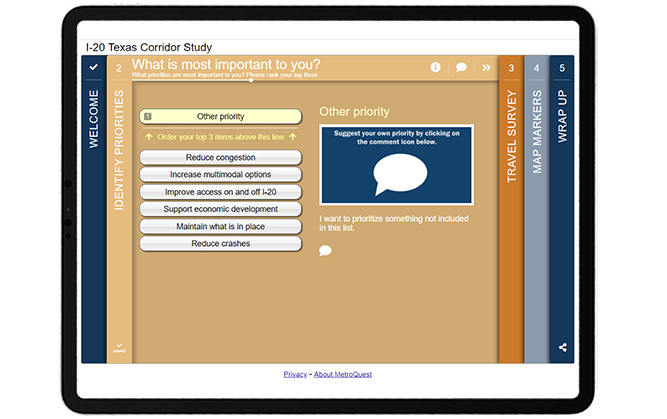
Like many MetroQuest surveys, the second Screen is in our Priority Ranking format to ask respondents what three priorities are most important to them out of six options. Additionally, this survey takes a unique approach by including an “other priority” option within the ranking list. This allows participants to customize their ranking to include a unique priority.
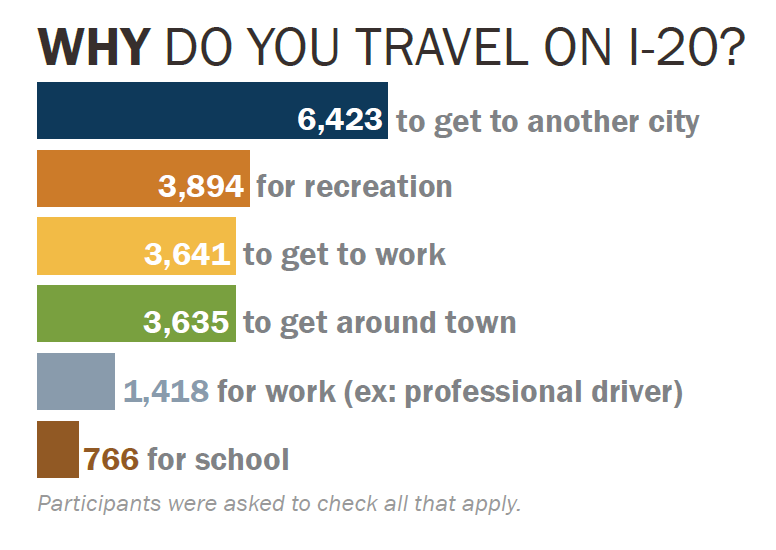
The survey continues with a Standard Survey Screen asking participants to provide input on their current and past usage of the I-20 route through a series of multiple choice, checkbox and comment questions. Questions are direct, asking for simple input on transportation use. Quantitative questions allow the project team to easily summarize key data, as demonstrated through the following graphics.
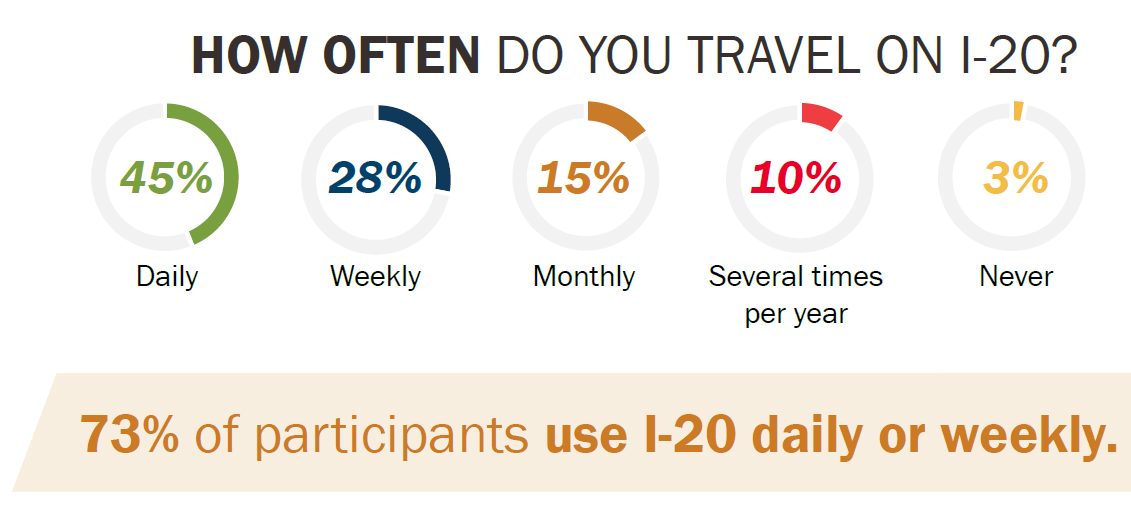
One of the biggest challenges when designing any survey is narrowing down what you want to ask. It can be tempting to ask endless questions, but the key is to flip your thought process when developing your survey. Start by determining what information and data you require to make future decisions, and then design your survey to ask for feedback on only those required items.
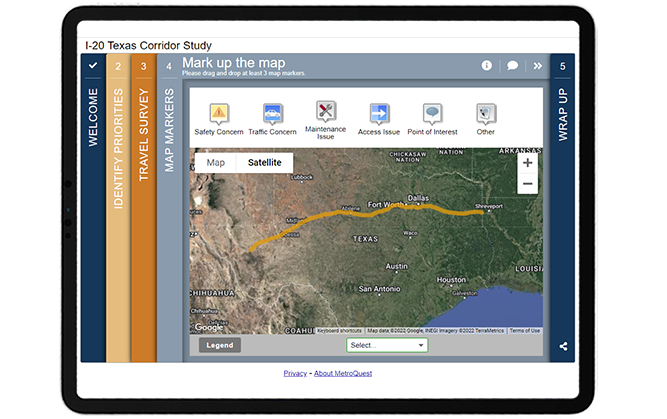
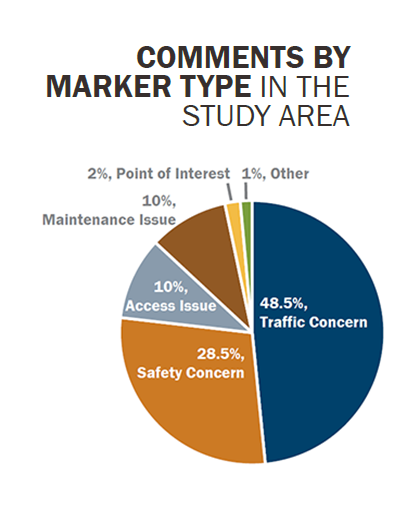
The Fourth Screen of this Survey uses one of our most versatile Screens for gathering location-based input: the Map Marker Screen! The I-20 route is easily highlighted through a yellow line uploaded on the KMZ layer and markers offer participants options to provide data on safety or traffic concerns, maintenance or access issues, points of interest and other comments.

The map also includes custom location settings for the overall study area, as well as west, central and east locations. That way, if a participant is only interested in providing feedback on one area, they can use the auto-zoom option to narrow their view. This Screen provided the project team with more than 21,700 unique data points from markers being dropped on the map!
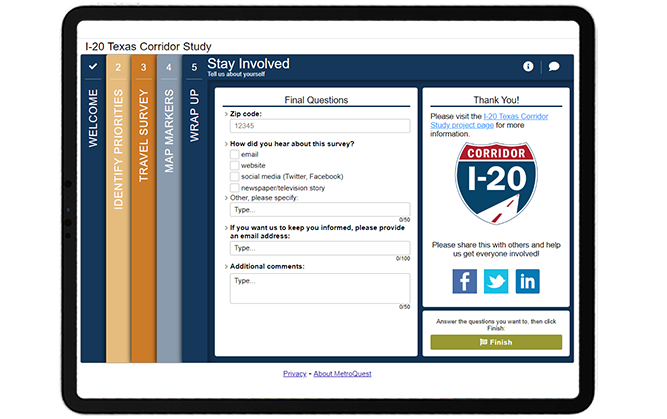
This survey is also an excellent example of a Wrap Up Screen done right! The Screen asks just four simple questions. Often, respondents will drop off before the end of the survey, especially if there is a long list of demographic or personal questions. At the same time, demographic information is vital to ensuring diverse participation and representation, and knowing where participants first encountered the survey is important for fine-tuning your promotional efforts. We recommend only asking what you need to know, and this survey did exactly that!
Thanks to this simplified approach, they received more than 6,000 responses to the checkbox question: “How did you hear about this survey?”. This number amounts to about 79 percent of total participants and demonstrates how this survey effectively kept participants engaged to the very end!
MetroQuest surveys are designed in specific ways to help you achieve great results. The Wrap Up Screen, which always appears at the end of the survey is the best place to ask final demographic and personal questions, as participants are usually more willing to provide this type of information at the end after becoming familiar with the study.
When writing demographic questions and your survey in general, consider how you will tabulate and analyze the data after the survey is complete. Thousands of open-ended comments can take many hours to analyze for key insights, so we always recommend including mostly quantitative questions where there are set options for participants to select, rank or rate, such as the checkbox questions on this Wrap Up Screen. Close-ended questions will allow you to identify key trends and opinions from your survey results immediately.
Check out this demo version of the survey to see how easy and quick this survey is to complete! You can toggle the green icon on the top right to view the survey in mobile or desktop view.
5 Tips from the I-20 Texas Corridor Study Survey: Concise Content and Simple Asks
1. Keep the content simple and short: We mention this often but for a good reason. People have limited time and attention spans. If you want to receive quality responses and hear from thousands, survey content needs to be concise, to the point and easy to understand. We recommend designing surveys to only take five to ten minutes to complete as most people tend to drop off after this amount of time. This survey is a prime example of a study that that required specific and general feedback on an entire corridor but managed to gather a huge amount of input through a very simple survey.
2. Track your outreach and re-assess your strategy partway through: It is essential to track the progress of your survey while it is live, especially to make sure you are reaching a diverse audience. In this case, the project team reserved time midway through the survey’s engagement period to dive into the data. By collecting ZIP codes and Map Marker geospatial data, the team was able to identify if certain areas were not well represented and broaden outreach to those areas for the latter half of the engagement period. With social media advertisements, it’s easier than ever to target specific areas and demographic groups without spending significant time or money.
3. Find ways to broaden your outreach through partner organizations: Especially when it comes to social media, often your reach is limited by the size of your audience. The TxDOT team did an excellent job of identifying other state organizations and contacts where they could get the word out of the survey. Even better, they prepared content and imagery so these organizations could promote a consistent message and didn’t need to take extra time to develop their own posts. The use of broad communication channels was a key driver in this survey receiving thousands of responses.
4. Start with an inviting Welcome Screen: The image choice on the Welcome Screen is important for greeting participants but so is the content. Use engaging calls to action, keep the content brief and identify key information to introduce the survey. The I-20 Texas Corridor Study Survey clearly indicates the project area and purpose without requiring the participant to read a large paragraph.
5. Ask only what you NEED to know, especially on the Wrap Up Screen: If you want participants to get to the end of your survey and still provide some personal information make sure only to ask demographic or personal questions essential to your data analysis process. Keep the Wrap Up Screen minimal and simple with a mix of quantitative and qualitative data. The simplicity of this survey’s Wrap Up Screen led to their team receiving feedback on this Screen from the majority of survey participants. Thanks to the quick and straightforward questions, participants were less likely to drop off partway through the survey.
Congratulations to TxDOT and the I-20 Texas Corridor Study project team for developing a robust communications plan and excellent survey that engaged more than 7,900 participants! Thank you to the project team for providing the excellent campaign images and data graphics featured throughout this post.
For more great tips on how to make the most out of MetroQuest, contact our Customer Experience team or reach out for more information!
Check out our recent webinar to learn ways to optimize your virtual community engagement through effective outreach strategies and great survey design!
Optimizing Virtual Community Engagement to Build Public Support
A well-designed survey and an effective outreach campaign are two elements critical to public engagement success. Watch this webinar for case study examples from successful projects!
