[SURVEY OF THE MONTH] Almost 6,000 Responses on Sacramento-Reno Rail Extension Study

The Survey of the Month series is a monthly blog where we highlight the extraordinary work our customers are doing! We feature well-designed surveys and share takeaways that are relevant for anyone interested in making the most out of online engagement using MetroQuest’s survey platform. To see more in the series, visit the blogs here.
What’s the story? Collaborating to Engage Potential Rail Passengers
This month we are heading into the mountains! MetroQuest subscriber Placer County Transportation Planning Agency (PCTPA) recently launched their Sacramento-Reno Rail Extension Study survey. The study, funded in partnership with several other local organizations pictured below and assisted by other agencies, investigated improvements that would be needed to provide additional passenger rail (Capital Corridor) service from Sacramento to the Tahoe and Reno/Sparks area.
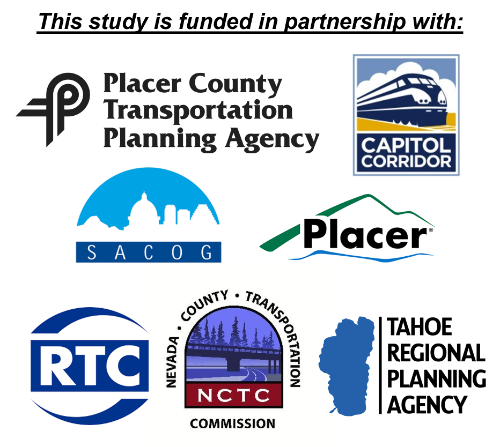
Project funding partners included Placer County Transportation Planning Agency, Caltrans, Capital Corridor, Sacramento Area Council of Governments (SACOG), Placer County, Regional Transportation Commission of Washoe County Nevada, Nevada County Transportation Commission and the Tahoe Regional Planning Agency. Other regional organizations were also consulted, such as Caltrans, Town of Truckee, and Truckee/North Tahoe Transportation Management Association.
PCTPA is the regional transportation planning agency for the majority of Placer County (excluding the Tahoe basin), and is made up of seven member jurisdictions. Bordering Nevada and extending into the Sacramento suburbs, Placer County sees visitors from around the world who come to enjoy the beautiful outdoors, including Lake Tahoe. There are endless opportunities for recreational activities such as fishing, skiing/snowboarding and mountain biking. With that comes the need for accessible transportation into the area from hub areas, such as Sacramento and the San Francisco Bay Area.
Working Together Across the Region
Since the rail line passes through several counties and jurisdictions, PCTPA worked with partner agencies to ensure the survey sought feedback that would be helpful for everyone involved. They distributed a demo link of the survey to the over eight stakeholder organizations involved ahead of its launch. Given each organization’s unique interests, teams provided suggestions for new or revised survey questions, resulting in a comprehensive and well-thought-out survey. Questions focused on how participants would see themselves using the service, rather than more general behavioral questions.
Additionally, the organizations collaborated to promote the survey within their networks, particularly on Facebook and through email blasts. It is worth noting that they did not pay for any social media ads; the promotion of this survey was entirely organic. By utilizing the networks of several other organizations, they were able to reach a broad audience. Given the amount of online discussion, local media also picked up the project.
Below are some examples of the Facebook posts shared. The action-oriented posts emphasized that the survey was short and mentioned the prize draw—likely enticing many to click the link:
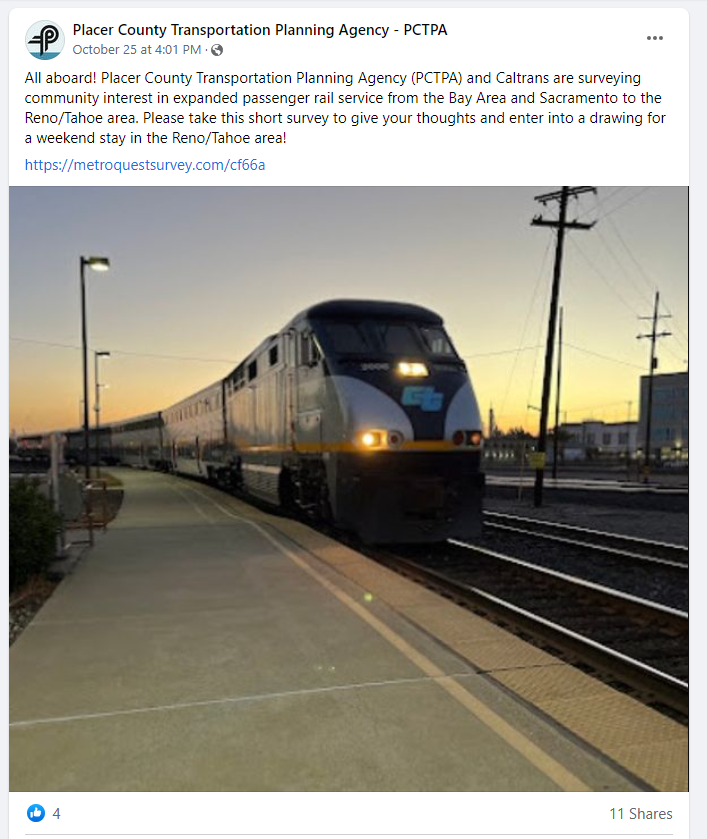
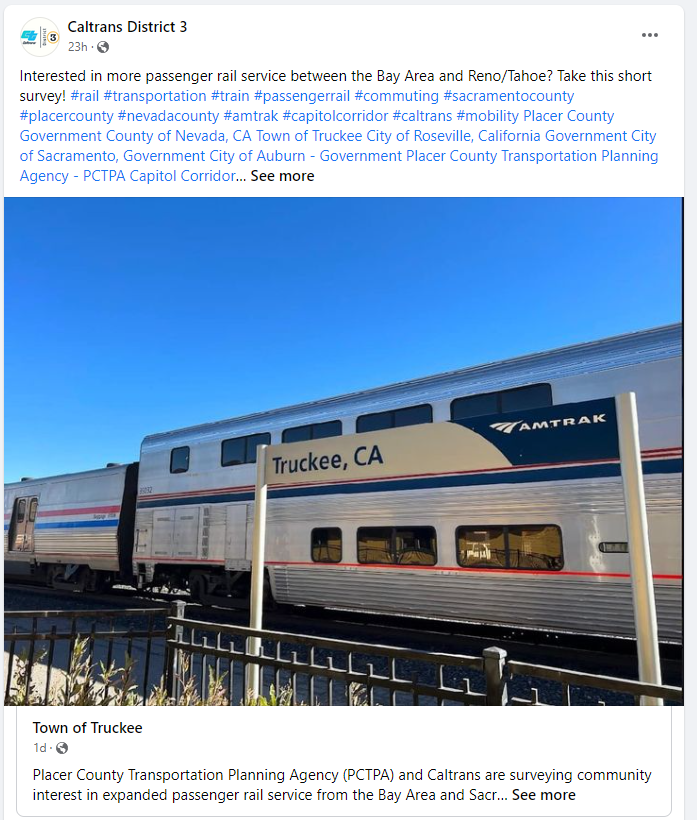
Posts from PCTPA and Caltrans District 3 to promote the survey. Similar posts were shared by other local organizations, such as the Regional Transportation Commission of Washoe County, Solano Transportation Authority, Truckee Tahoe Area Regional Transit, Truckee North Tahoe Transportation Management Association, and the Town of Truckee.
In most cases, transportation surveys cross boundaries and impact several areas. As PCTPA did, we recommend leaving plenty of time in your review cycles to consult other organizations. In this case, they had an existing working group that they could collaborate with. Additionally, it can be helpful to prepare a package of promotional materials and communicate with other agencies about your promotional plan; that way, they can broaden the reach by sharing the project with their audiences.
What Led to Over 5,800 Responses?
In speaking with the project lead, they attributed the survey’s large response to these key factors:
- The survey impacted and was therefore promoted to a large catchment area of approximately 10-12 million residents, including the Sacramento area, the Bay Area, and the Reno/Tahoe area.
- Over six partner agencies assisted with spreading the word about the survey. Additionally, social media posts were picked up by local community groups and grew organically.
- A significant incentive was offered to survey respondents, with a prize draw to win a weekend trip to the Reno/Tahoe area (a world-renowned recreational destination).
Next time you are planning a survey where you want to hear from a large audience, consider the following:
- Who is impacted? Are my promotions reaching all those areas?
- Do I have the budget to offer an incentive?
- Are there local organizations or community groups that could help spread the word?
Check out our recently released Virtual Public Involvement checklist for more questions to consider when planning your next survey.
Anatomy of a Rail Expansion Survey: Captivating Visuals and Situational Questions
In addition to the fact that the Sacramento-Reno Rail Extension Study Survey garnered responses from nearly 6,000 people, it also gathered key data to inform rail expansion in Placer County. In total, the survey collected over 133,600 individual data points!
Open the demo survey in a second window as we walk through its content!
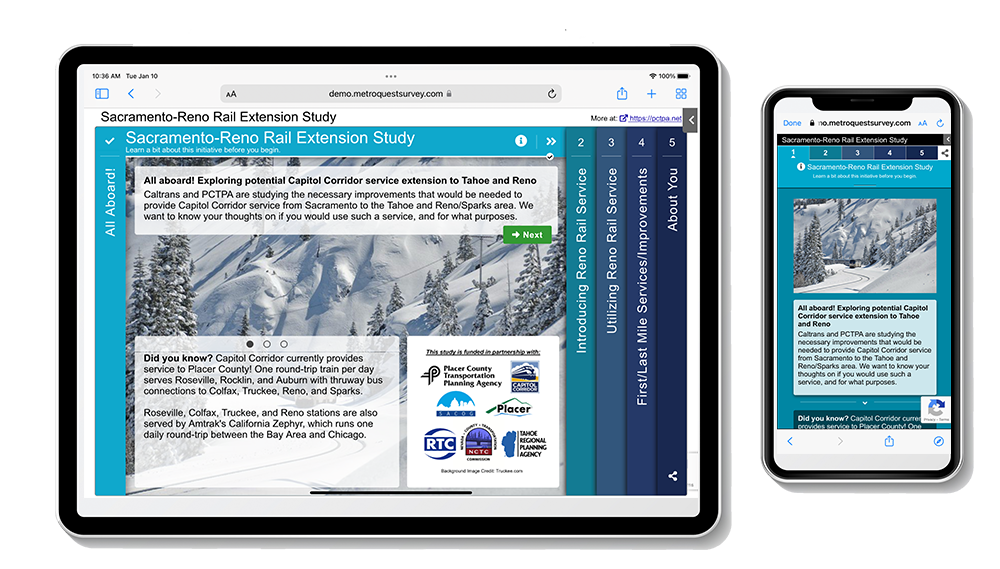
Screen 1: Welcome
We often express how important it is to welcome participants with an enticing image. This survey does just that with a captivating photo of a snowy mountain rail pass and cool blue tones.
The Welcome Screen is extremely informative, explaining the key parties involved in the study, the purpose of the survey and how input will inform the project.
Screen 2: Standard Survey
Next, the survey starts with introductory questions about preferred travel methods, interest in rail travel and commuting scenarios. The questions are thoughtful and specific; participants can tell that their opinions could influence the project outcome. Additionally, these questions are quick to respond to due to the dropdown or multiple-choice formats.
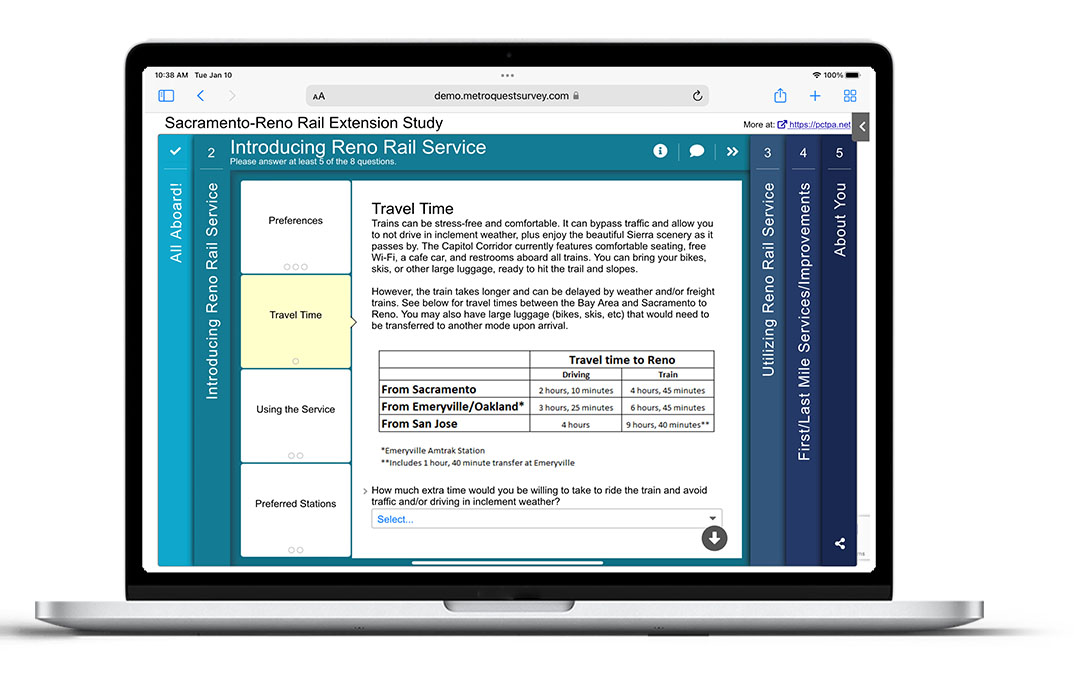
As the Standard Survey Screen is not the most inviting option to start with, we only recommend using it when necessary. However, it is a very suitable format here. Given the nature of the study, the project team needed to gather specific details from participants on an array of topics.
Tip: If you have explored all twelve MetroQuest Screen options and determined the Standard Survey Screen is the best fit, we recommend placing it fourth in your survey. This allows you to greet participants with a more engaging and visual Screen upfront before diving into more text-based questions.
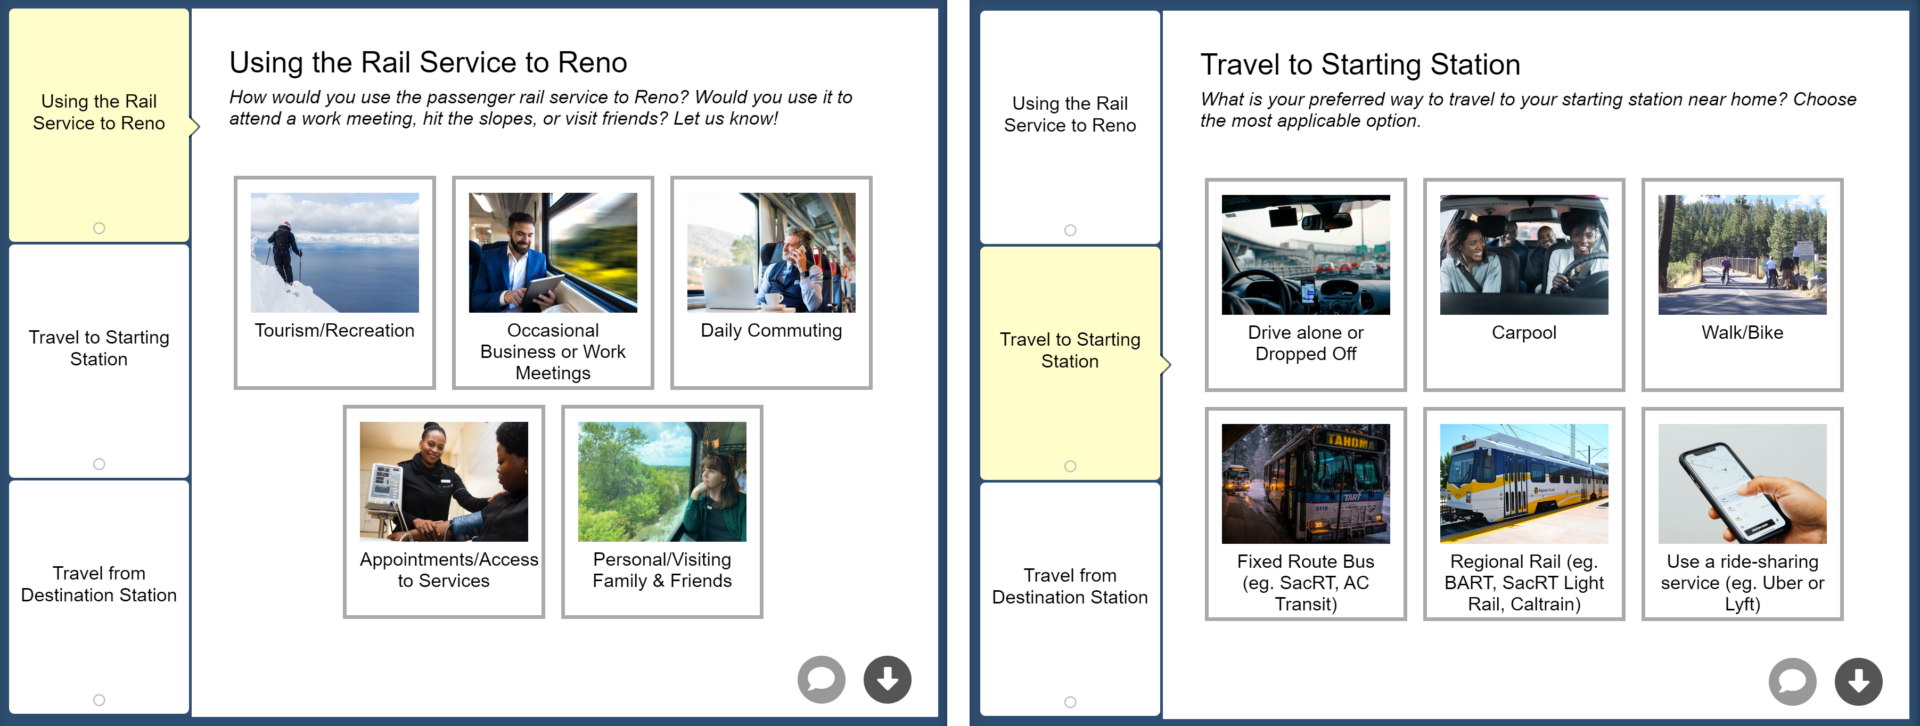
Screen 3: Visual Preference
To balance out the somewhat text-heavy survey screen, the third screen uses our Visual Preference format to ask straightforward questions about using the rail service, traveling to the starting station, and traveling from the destination station. Images are relevant and engaging, aiding in a quick option selection.
Screen 4: Image Rating
The survey continues its visual format on the Image Rating Screen. With this screen, they could ask 11 questions, using visual cues to keep the survey fun and engaging. The quality images well-represent the topic areas without imposing biased decision-making.
MetroQuest’s tab system allowed them to group the visual questions into three categories: Active Modes, Transit and Vehicles.
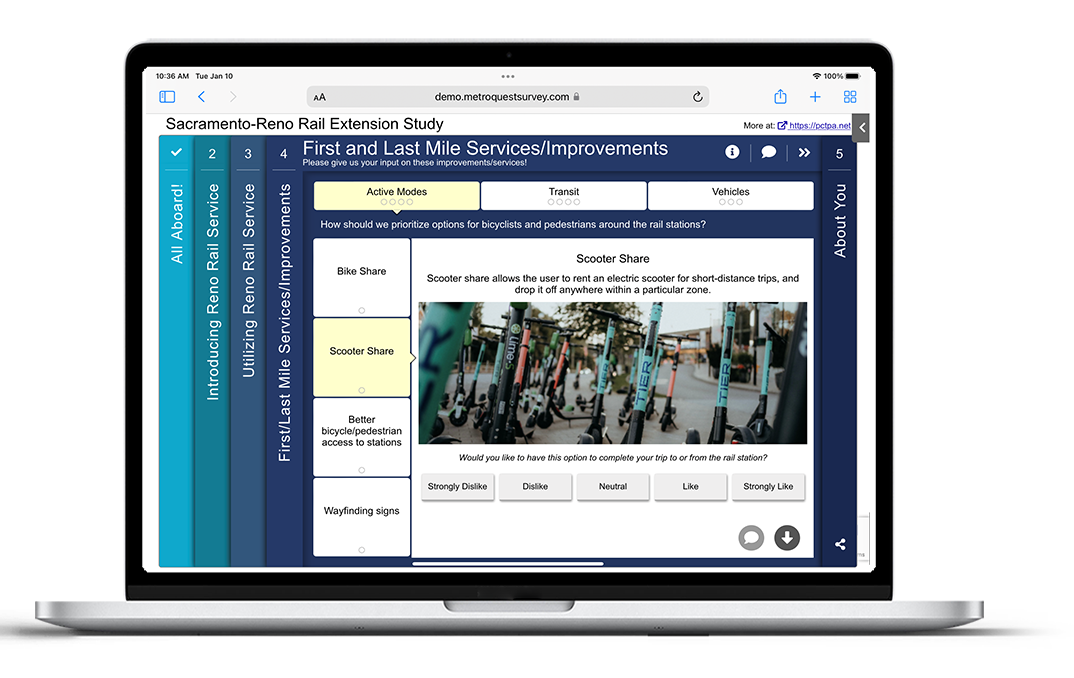
While you could ask many of these questions without a visual, images make for a significantly more interesting survey experience. With the rise of social media apps, especially Instagram and TikTok, we have become accustomed to seeing content accompanied by visuals. For many, that means we are instinctively drawn to more visual content—in short—visual surveys are significantly more effective.
Screen 5: Wrap Up
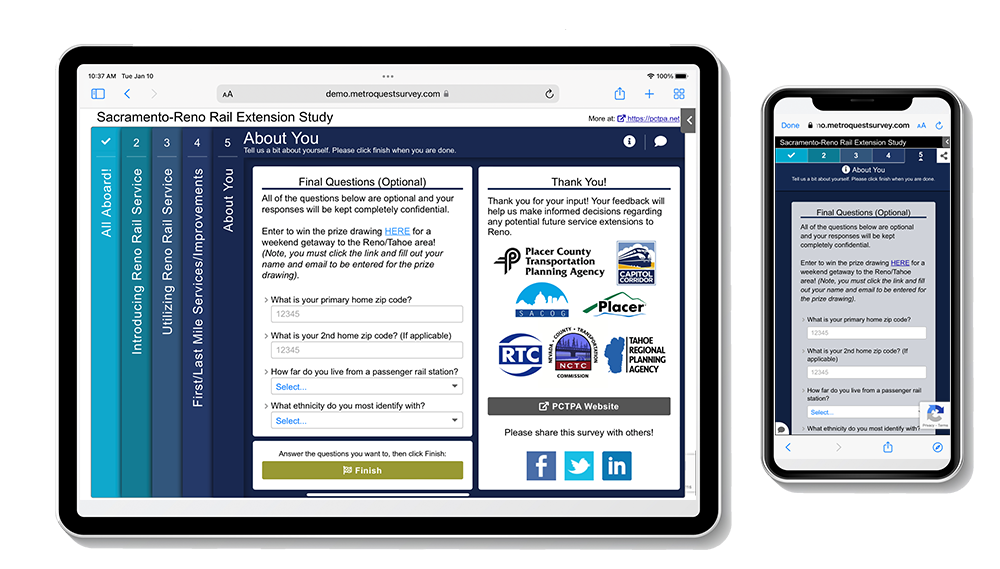
As mentioned earlier, this survey offered a prize draw for a weekend getaway to the Reno/Tahoe area, an amazing spot to visit. Instead of asking survey participants to enter the draw within the survey, they required them to visit another link to enter. This information was on the last screen, so participants likely only found the link after they completed the survey questions.
Survey contests can be tricky; of course, you don’t want to adversely impact the survey results or have participants only take the survey to win the prize. Yet, it takes significant public interest and promotional money to gather thousands of responses to a transportation survey. Offering an incentive can result in many more people finding it worthwhile to provide feedback. We recommend only offering prizes that can be collected in-person and used locally to avoid bots overriding your data (unfortunately, that is something to watch out for).
The final demographic questions allowed the team to gather key information about who they heard from. Since many Californians have second vacation homes in the Reno/Tahoe area, they asked for 2nd home ZIP codes, where applicable. With MetroQuest’s ZIP code heat maps, they could see the distribution of respondent’s residences immediately.
5 Tips from the Sacramento-Reno Rail Extension Study Survey:
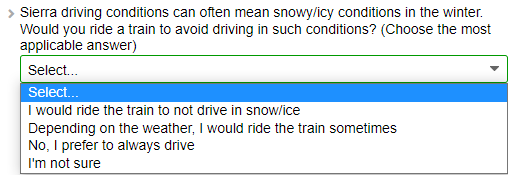
- Ask specific, actionable questions: Often surveys ask very theoretical questions, or they might ask for agreement on a set of goals or principles that are positive. Your participant’s time is valuable; make it worthwhile by asking questions that will elicit the data you need. In this case, the survey asked specific questions about travel habits and preferences relevant for this type of project. In turn, they gathered actionable feedback. For instance, the below question refers to a scenario many respondents are likely familiar with. The response options are clear but concise:
- Sometimes organic social media is all you need: We often recommend utilizing paid social media ads to promote a survey, but in some unique cases, a survey may be enticing enough to the community that it doesn’t require that extra boost. Since over five organizations across the county were sharing posts on social media and those posts got picked up by community groups, not a single dollar of social media advertising was required to boost the message. If budget is a concern, perhaps start your project with organic posts, and if halfway through you don’t have the results you hoped for, then boost your posts or pay for ads.
- Collaborate with area stakeholders: Teamwork is key. If your project involves other organizations, or perhaps you work for a Department of Transportation supported by regional agencies, ensure you set aside time in your project schedule to solicit input from stakeholders. It can be easy to get tunnel vision when working toward tight timelines, so different perspectives and ideas never hurt. As we mentioned earlier, consider working with local groups to spread the word about the survey across the area. Preparing a media package with messaging and images can make this process seamless for everyone.
- Offer a local prize: Emphasis on LOCAL—in some situations, a prize draw can entice more people to take a survey. To avoid ballot box stuffing, keep the gift local, such as a gift card to a local restaurant. Additionally, gather ZIP codes and emails to ensure you hear from locals.
 Gather quantitative demographic data: Comment responses take time to analyze and keep in mind you might want to do some cross-tabulation analysis to compare different demographic groups. Always ask about age, gender, income, or other personal information using single-selection questions, such as dropdown or button question types, ensuring you can quickly quantify the data.
There is so much we could point out in this survey so make sure to check it out more closely yourself. We hope you enjoyed learning about this initiative and that you gathered some ideas for your next survey.
Congratulations to the PCTPA team and the other project partners for successfully engaging thousands through this survey! We can’t wait to see more amazing MetroQuest surveys from their team.
For more great tips on how to make the most out of MetroQuest, reach out for more information or, if you are an existing subscriber, contact our Manager of Client Services Team, Woo-Ree Cho.
Get a free copy of our 101 questions for successful virtual public involvement:

The Virtual Public Involvement Checklist for Success