[SURVEY OF THE MONTH] Taking Action on Road Safety in Phoenix

The Survey of the Month series is a monthly blog where we highlight the extraordinary work our customers are doing! We feature well-designed surveys and share takeaways that are relevant for anyone interested in making the most out of online engagement using MetroQuest’s survey platform. To see more in the series, visit the blogs here.
Road safety and the goal of Vision Zero have come to the forefront of transportation planning in recent years. The idea of Vision Zero—a strategy to eliminate all road fatalities and severe injuries—started in Sweden in the 1990s and has gained traction in North America. We can all agree that safer roads, sidewalks, and bike lanes benefit everyone!
Continue reading to learn how the City of Phoenix, Arizona, engaged over 2,500 community members and gathered precise data to inform their Road Safety Action Plan. Following this engagement process and the plan submission, Phoenix City Council unanimously approved a comprehensive Vision Zero Road Safety Action Plan on September 7, 2022, and the allocation of $10 million annually for its implementation.
What’s the story? Thorough and Thoughtful Engagement
The WSP team regularly develops outstanding MetroQuest surveys, such as the one we featured about a year ago for Illinois DOT. This time, they worked with the City of Phoenix to engage community members on their roadway experiences. Phoenix consistently ranks among the worst three cities in the US for traffic fatalities. As demonstrated in the bar graph below, an improvement in road safety and a reduction in collisions is urgently needed.
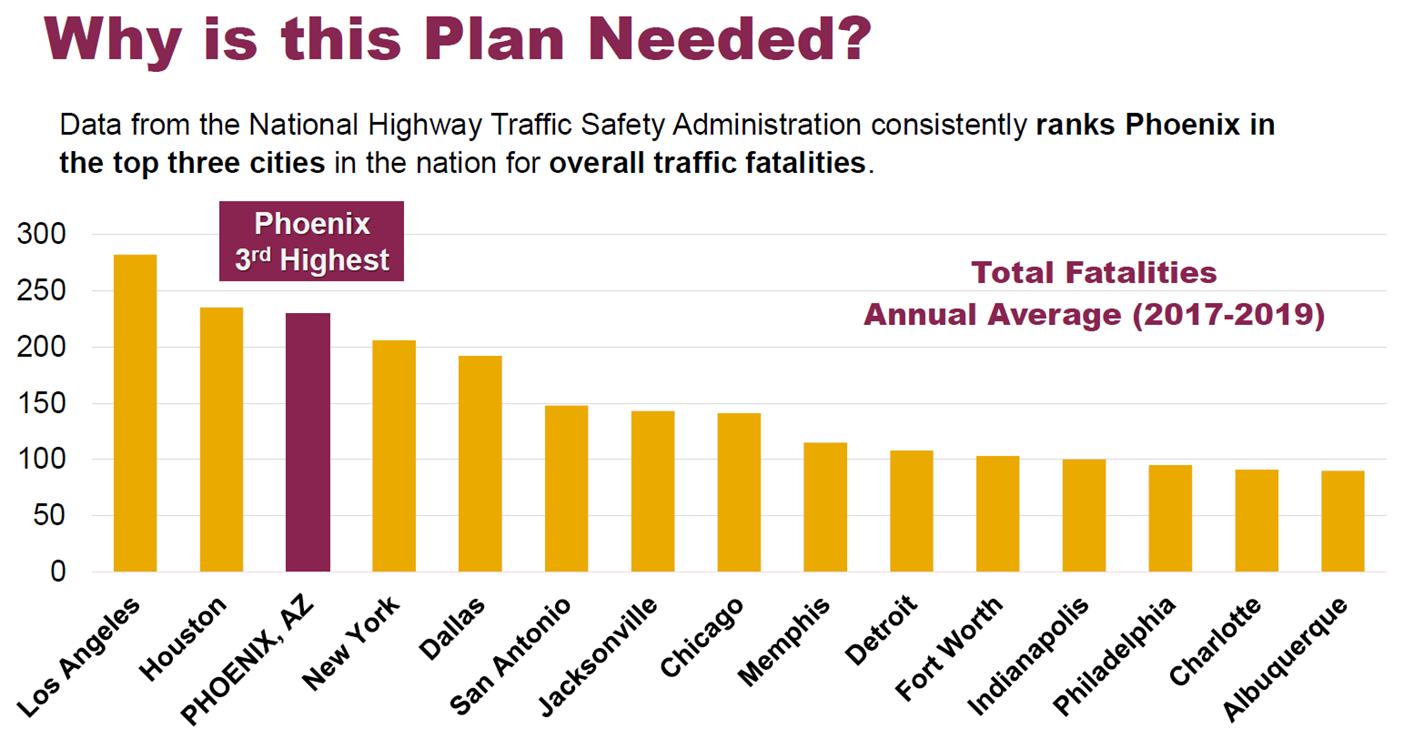
Bar graph showing Phoenix with the 3rd most traffic fatalities, with Los Angeles and Houston 1st and 2nd .
We often concentrate on the survey itself, but this time, we also want to emphasize the importance of transparent public consultation processes. It is one thing to survey a community, but closing the loop and showing consideration of input is what will build long-term civic involvement and trust.
We’ll highlight several key components and results from the Public Involvement Summary Report, but we recommend checking it out yourself!
Before we get into the survey content, we want to point out a few key factors that contributed to the success of this initiative.
Achieving a Cohesive and Identifiable
Project Brand
At the outset of the planning process, the project team developed a brand package to create a cohesive visual look for the project. Since cities must communicate about a wide array of topics, it is particularly helpful to create strong project identities.
The brand package included: a logo, colors, fonts, letterhead, and templates for a memo, meeting agenda, fact sheet and PowerPoint presentation.
Creating a brand package makes a lot of sense for longer-term projects and saves time in the long run, ensuring consistency across materials when a larger project team is conducting outreach. Additionally, you can leverage community group involvement by creating an outreach package for them to distribute.
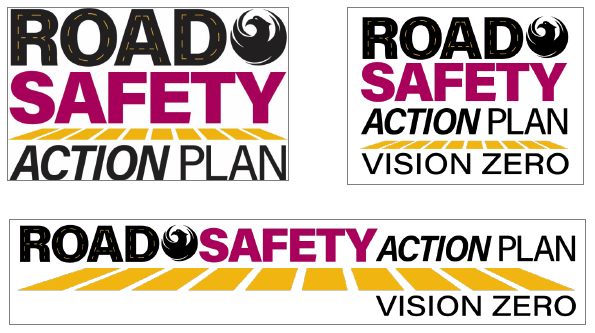
Example logos as part of the Road Safety Action Plan branding package. The Vision Zero line was added in February 2022 following Council approval to adopt Vision Zero.
Creating a One-Stop Project Webpage
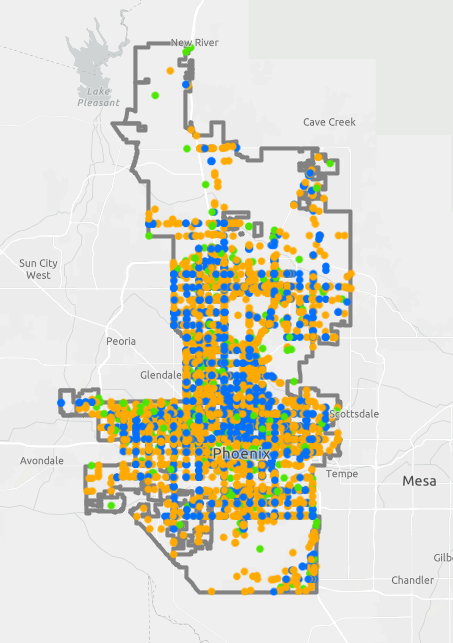
ArcGIS map identifying areas with frequent road injuries or fatalities.
We always recommend having a project website to host your survey information. The City of Phoenix created phoenix.gov/roadsafety as a hub for project information.
The City of Phoenix ensured the community was informed leading up to, during, and following the engagement process. The webpage offers a feed with project updates, links to project materials and even an ArcGIS map.
The High Injury Network (HIN) interactive map demonstrates the full scale of transportation incidents and deaths, displaying data from five years of motor vehicle crashes. Using interactive visuals to tell these devastating but true stories helps the public better understand the need for the plan.
Additionally, the team even embedded a video to update on the plan!
During the public involvement period, over 1,500 unique visitors viewed the project webpage.
Leveraging Social Media and Tracking Impressions
To ensure the community was well aware of the MetroQuest survey, they notified everyone through City newsletters and posts on the @StreetsPHX Twitter page. The project team tweeted 35 times during the engagement period, which resulted in 14,727 impressions! Social media posts were quick, visual and direct about when input needed to be submitted by:
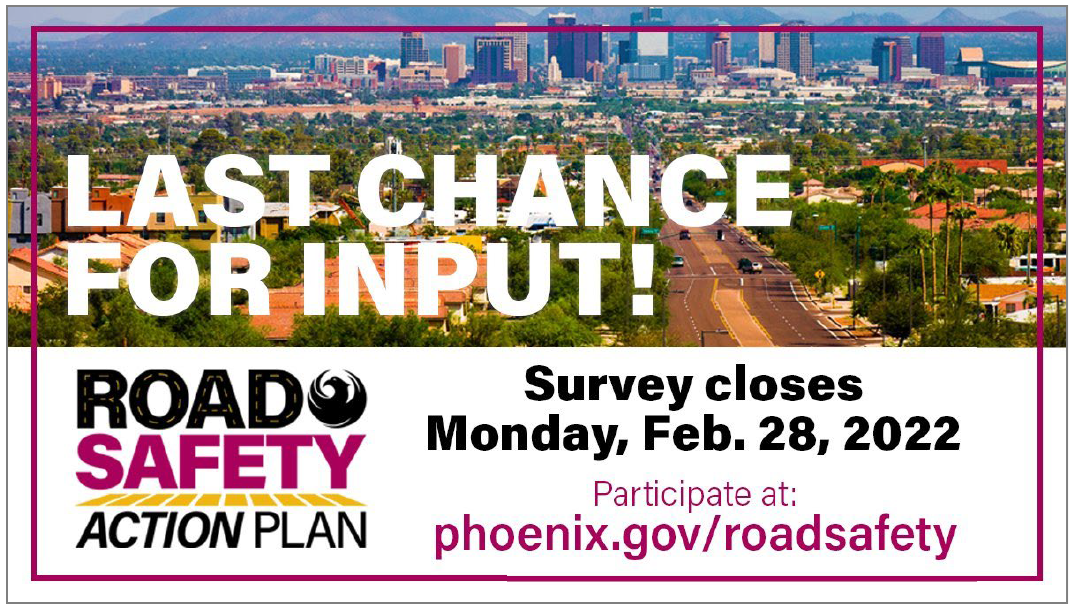
City of Phoenix Street Transportation Department Twitter Post
As evident in the below bar graph, the majority of respondents heard about the survey through social media:
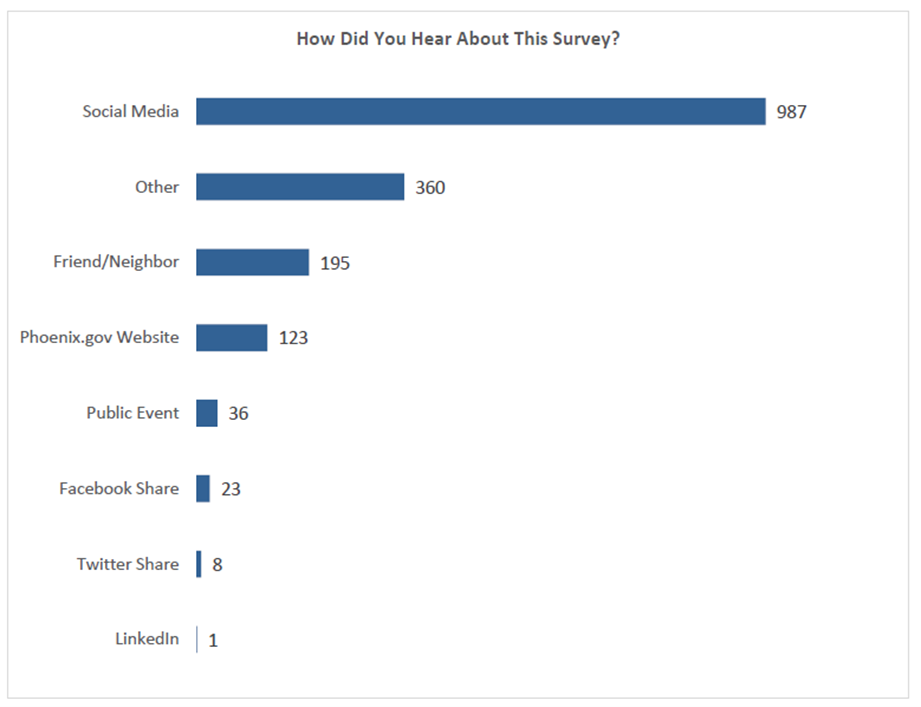
57 percent of respondents heard about the survey on social media. *Based on 1,733 total responses.
Informing the Community at Virtual Meetings
Following the COVID-19 pandemic, MetroQuest was the primary public involvement activity during the planning process. The project team also held a virtual public meeting and community touchpoint events in six community districts.
At the live virtual public meeting in November 2021, they shared an informative, graphics-focused presentation that highlighted the need for the plan. They made it extremely easy for participants to know how to provide input by outlining the options in the presentation:
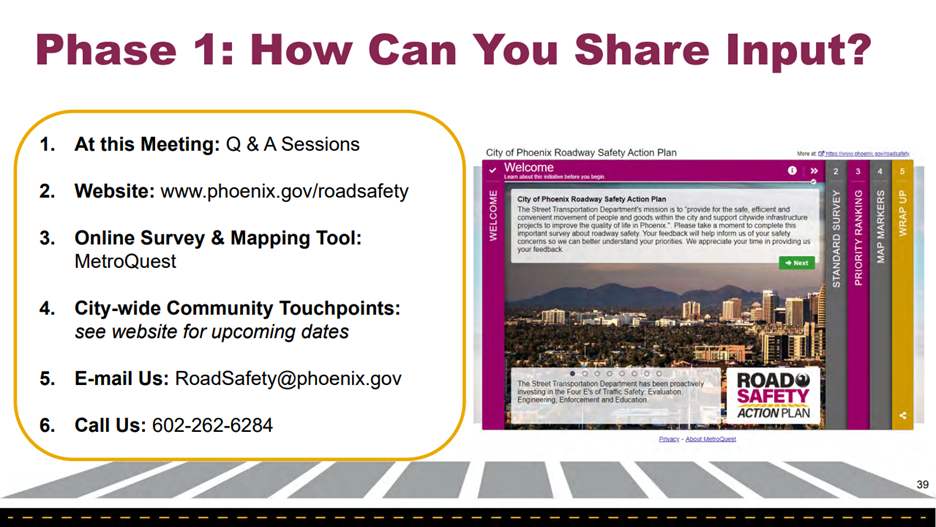
Presentation slide showing the six ways to provide input.
They also highlighted where to find the online survey and noted it only takes 8-10 minutes to complete (something we love to see).
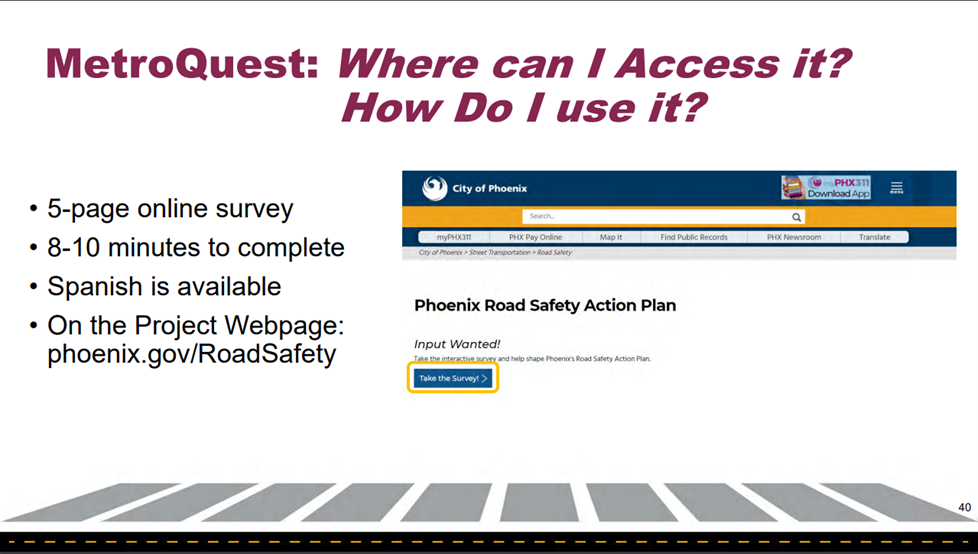
Presentation slide showing where to launch the survey.
Anatomy of a Road Safety Survey: Informing and Collecting Input to Make Roads Safer
The Phoenix Roadway Safety Action Plan Survey was live from November 16, 2021, to February 28, 2022, allowing 15 weeks for input. When surveys are live during a holiday period, it can make sense to leave them open for longer, especially if you are supplementing with events and continuously reaching out via social media.
In total, there were over 4,000 visitors to the survey and more than 2,500 people provided input for a conversion rate of over 60%.
Screen 1: Welcome
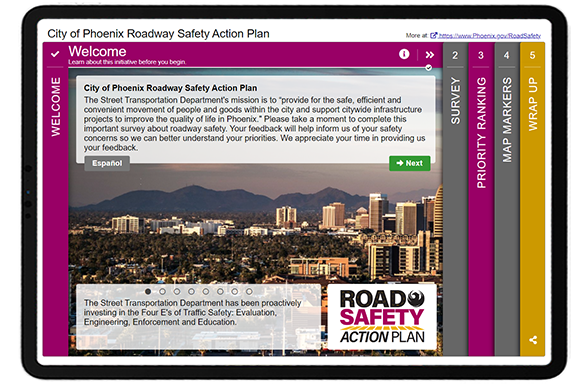
As demonstrated above, the Welcome Screen was particularly eye-catching. In speaking with the project team, the survey was not only important for collecting input but was also used as a method for educating the community about road safety issues.
“One of our key reasons for using MetroQuest is that it helps us educate the community as much as it helps us gather key input.”
– Alexandra Albert, Southwest Mountain District Lead, Communication and Public Involvement at WSP
In particular, they wanted the community to be aware of the four (now five) “E’s” of Traffic Safety: evaluation, engineering, enforcement, education and equity.
Following the informative and inviting Welcome Screen, the survey included three main activities:
- Standard Survey Screen: questions about safety concerns
- Priority Ranking Screen: prioritize the focus of safety work
- Map Marker Screen: mark locations and comment on safety concerns
As usual, we’ll go through screen-by-screen and share some of the data the project team gathered from this initiative.
Screen 2: Standard Survey
We typically do not recommend starting with a Standard Survey Screen, as it is not our most exciting or engaging Screen, but it can be the best option in some instances. Here, the project team needed to gain specific details on how participants move throughout the city, their greatest safety concerns, factors for crashes and how they would most like to learn about safety issues. This information made sense to start with upfront in the survey.
By asking a few simple quantitative questions, they were able to quickly understand the participants’ preferences, including that the majority of them drive:
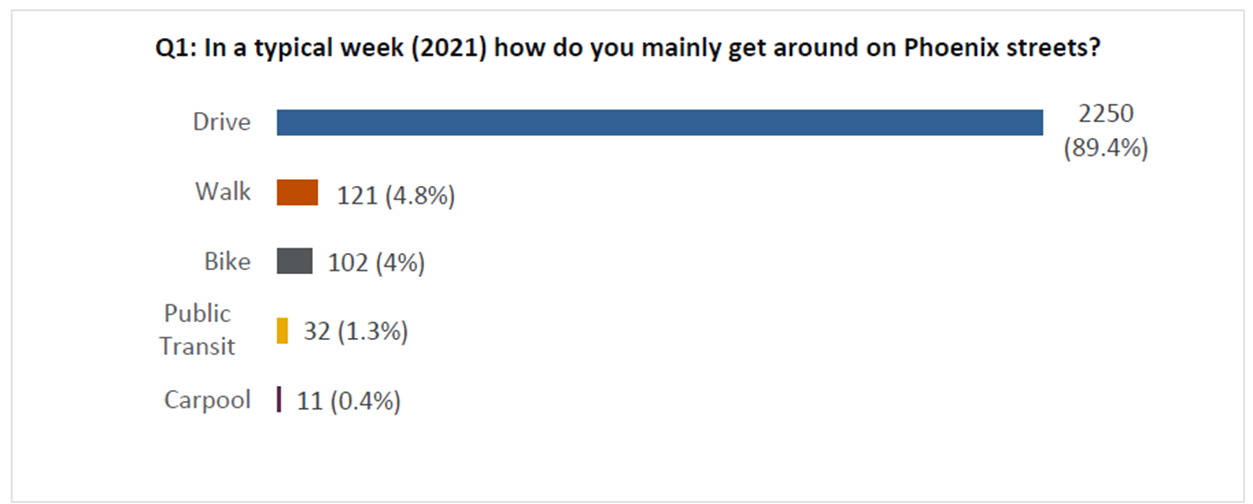
Bar graph showing that 89 percent of survey respondents typically drive to get around Phoenix.
They also learned that speeding, distracted driving and red light running were the top three safety concerns of residents:
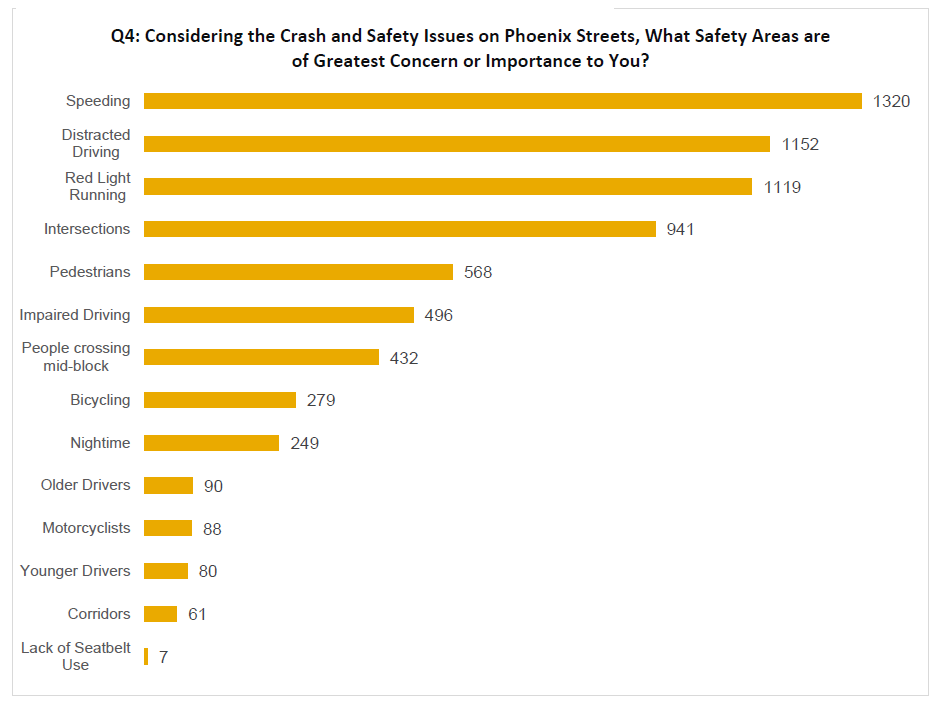
Bar Graph showing the greatest safety concerns.
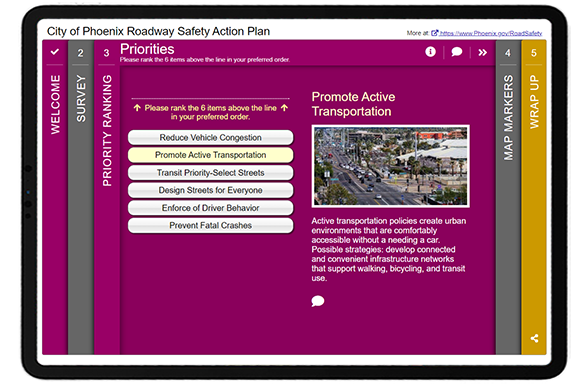
Screen 3: Priority Ranking
The survey remained straightforward on the third Screen. Participants were asked to rank all six priorities:
Following with the quantitative question format, they could quickly glean which safety actions were highest priority:
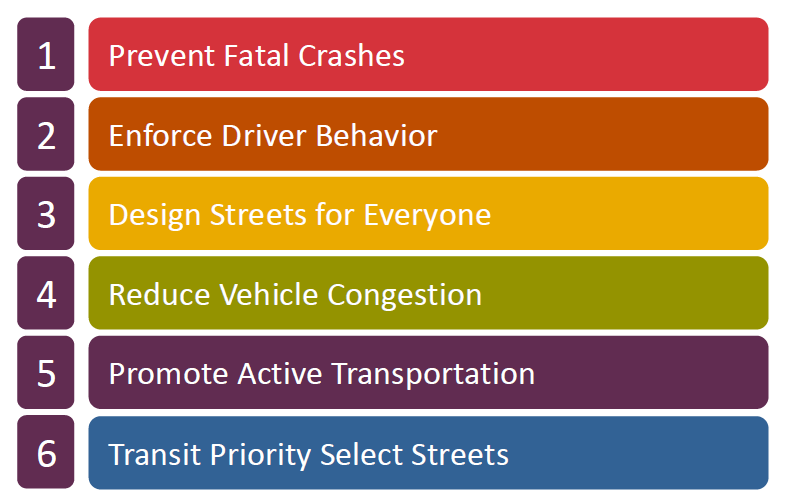
Image showing that the top priority is to prevent fatal crashes.
Did you know?
The Priority Ranking Screen randomizes the order of the priorities every time a participant visits it, eliminating potential bias from the item sequence.
Screen 4: Map Marker
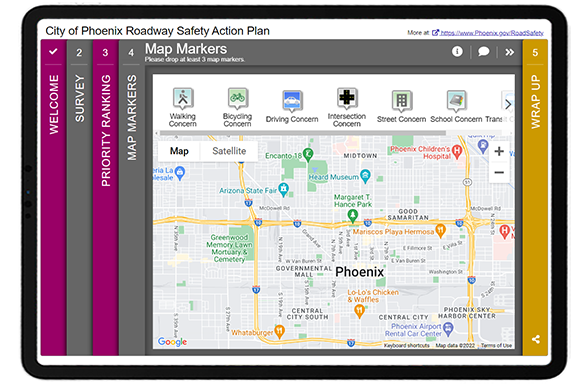
List of categories and sub-categories based on open-ended Map Marker Screen data. The number of comments per category help quantify qualitative data.
The Map Marker Screen was very well utilized to gather a wide variety of input on everything from walking/biking/driving concerns to transit, school and lighting concerns. They ended up receiving over 4,500 individual comments from the dropped markers.
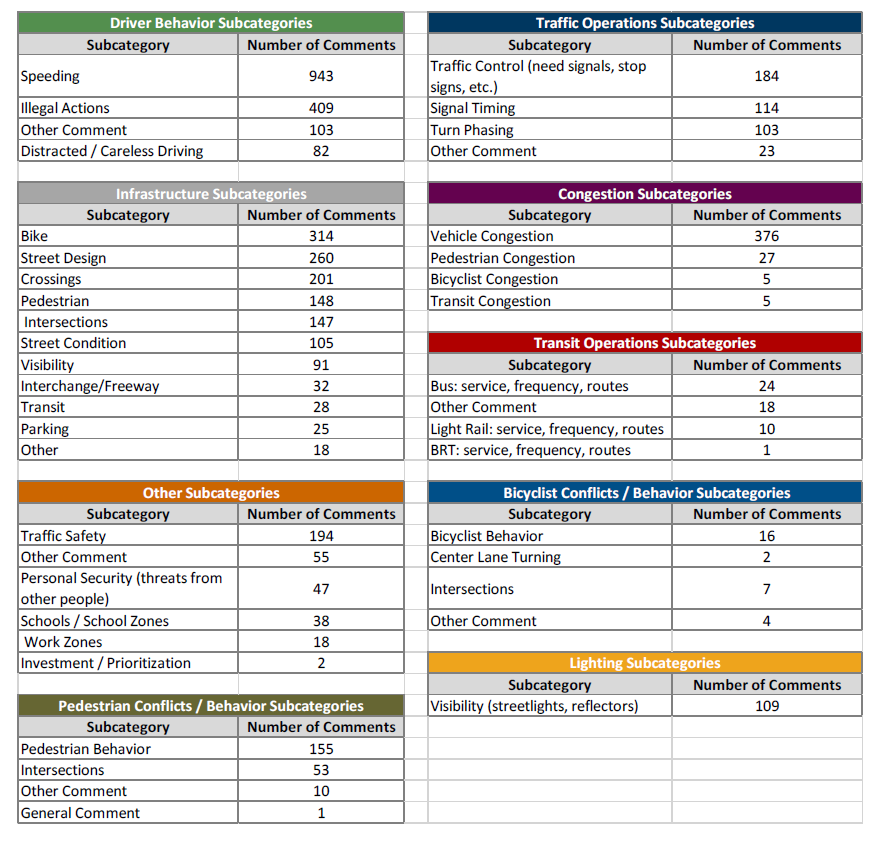 Qualitative data analysis can be time-consuming but often worthwhile to gather nuanced data. Following a category-based approach, the project team analyzed the data by categories and grouped them into sub-categories. As shown in the image to the right, they pulled out key themes and organized them by comment—quantifying the qualitative data as much as possible.
See pages 21-22 of the Engagement Phase 1 Summary Report for more details.
Screen 5: Wrap Up
Last but not least, the final Wrap Up Screen remained simple and quick with five key questions:
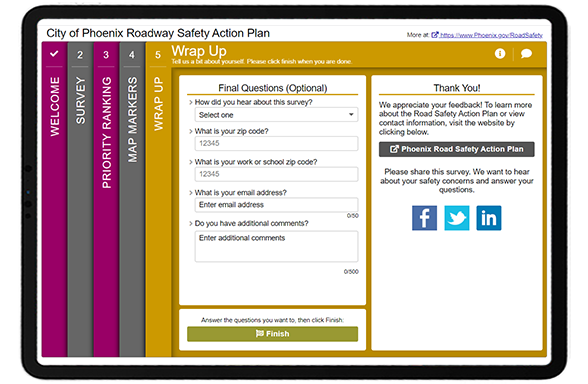
As indicated earlier, the project team learned that most participants heard about the survey through social media. They also made sure to ask for ZIP code details to get a sense of which areas were represented through survey respondents.
We can only highlight so much in this blog post; we recommend reviewing the project website and engagement summary report to learn more about the project. Then check out the demo link of the survey!
To close, here are our five key takeaways you should consider for your next project!
5 Tips from the City of Phoenix Roadway Safety Survey:
- Create an eye-catching branding package and stay consistent: The project team took the time to develop fun and striking project graphics. This makes such a difference, especially when tied in with the colors in the survey! People are visual, and you need something that stands out when someone scrolls through their feed. With longer-term projects and initiatives, having an instantly recognizable look adds a level of professionalism and ensures those you engage initially will be on the lookout for future materials and surveys.
- Consider your survey as an educational tool: Surveys are more than just a way to gather input; in many cases, they are the first time someone learns about an initiative. Consider your Welcome Screen content carefully and keep it light, fun and engaging. The better your community understands a project, the more impactful input will be.
- Track your social media and website impressions: Launching Facebook, Instagram or Twitter ads goes past the initial setup process. Ensure you check back regularly and assess campaigns after they close to determine their effectiveness. Use this data to inform future engagement endeavors and outreach.
- Use your project webpage to update the community continuously: We ALWAYS recommend developing a project webpage to house your project information, survey link, and any documents once your survey closes. MetroQuest survey links are not searchable online, so you need to create a webpage or site for the project. Consider updating your project website regularly as the project progresses. Showing a timeline can help participants gauge the scale of the project. We also recommend using maps, visuals and video to keep things interesting!
- Quantify your qualitative responses: Qualitative data is inherently more time-consuming to analyze but can elicit thoughtful, nuanced information. After reading several open-ended comments, you can learn a ton about overall community sentiment and opinions. When analyzing thousands of responses, tally comments by key themes and subthemes; this will help you quantify the responses, report on them fairly and get a sense of what matters most to the community.
We are honored to feature this survey! As noted earlier, the transparency of sharing survey results and comprehensive amount of information on the project website truly sets this project apart.
Congratulations to the City of Phoenix and WSP team for the excellent response, and kudos to Council for adopting a Vision Zero Strategy. Motor vehicle accidents sadly affect many, and we are always glad to see MetroQuest utilized for initiatives that will make roads safer.
For more great tips on how to make the most out of MetroQuest reach out for more information or, if you are an existing subscriber, contact our Vice President, Norma Hogan.
Check out our latest webinar where we discussed the most effective strategies for promoting and designing surveys that support diverse and equitable participation.

Optimizing Online Surveys for
Diverse and Equitable Public Engagement