[SURVEY OF THE MONTH] MnDOT Seeks Detailed Feedback on Interchange Reconstruction Project

The Survey of the Month series is a monthly blog where we highlight the extraordinary work our customers are doing! We feature well-designed surveys and share takeaways that are relevant for anyone interested in making the most out of online engagement using MetroQuest’s survey platform. To see more in the series, visit the blogs here.
This month, we are featuring a survey from the Minnesota Department of Transportation (MnDOT), developed in collaboration with SRF Consulting Group. The project team created a highly effective MetroQuest survey that sought feedback on complex interchange improvements through well-designed and easy to understand aerial graphics.
Read on to see how MnDOT used MetroQuest to gather easily quantifiable data that helped inform interchange reconstruction design options.
What’s the story? I-90/Highway 52 Interchange Reconstruction
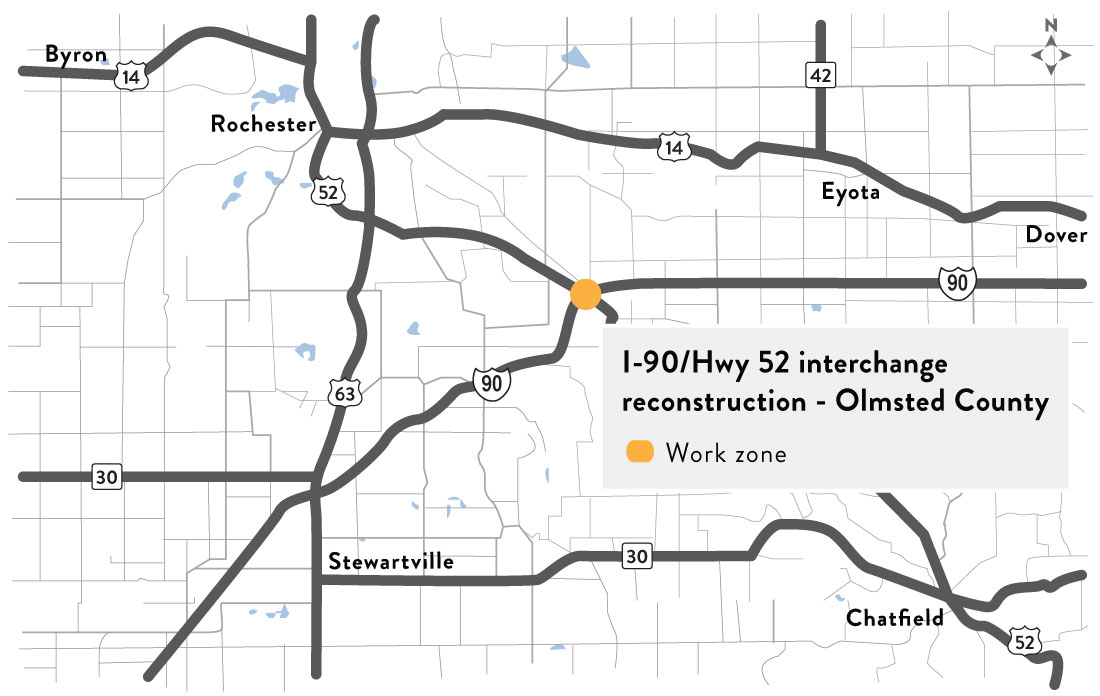
Map showing the interchange location southeast of Rochester, Minnesota.
The I-90/Highway 52 Interchange Reconstruction Project Round 1 Engagement was launched in February 2022 to gather feedback on interchange improvements to increase safety and reduce delays. Situated in Olmsted County, Minnesota, the I-90/Highway 52 major intersection is located southeast of Rochester and serves as a major arterial route intersection.
The primary project goals included:
- Safety improvements to decrease crashes
- Traffic flow improvements
- Increased clearance under the I-90 bridges
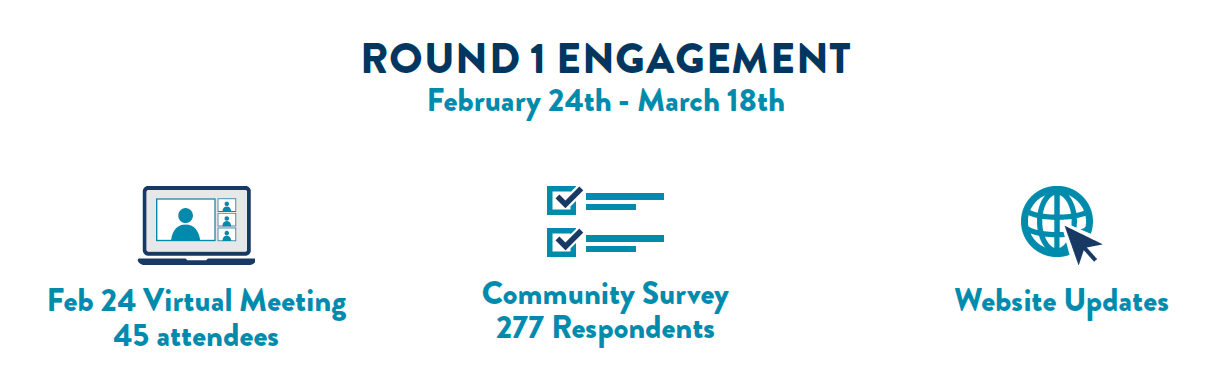
During this first round of engagement, MnDOT hosted a virtual open house and launched a MetroQuest survey. The survey asked participants to digitally “tour” various intersection improvements, provide feedback on a recommended alternative and rate specific interchange improvements.
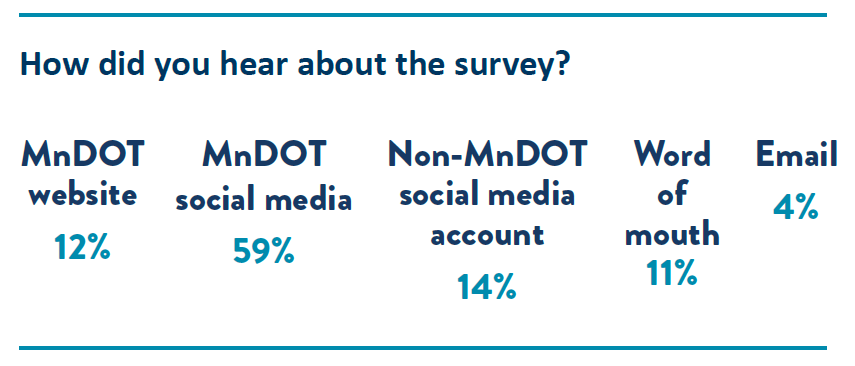
As with most engagement initiatives, social media proved to be a successful promotional tool with 73 percent of survey participants hearing about the survey through social media.
The project team incorporated very clear aerial visuals that turned an otherwise standard, technical survey into a fun and public-friendly exercise. We highlight these visuals and what made them so effective later in this post.
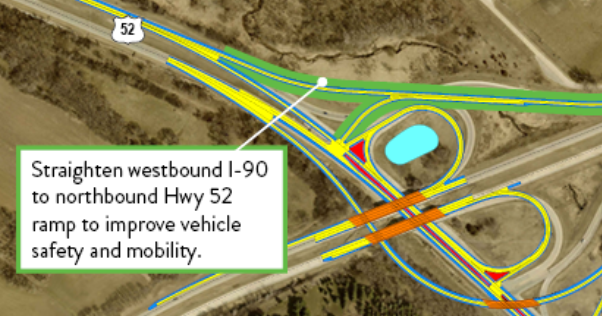
After reviewing community input and considering technical requirements, the project team had the data necessary to select a preferred alternative that will address several current intersection challenges. This includes constructing an elevated ramp to eliminate 92 percent of left-hand turns as shown in the following aerial shot.
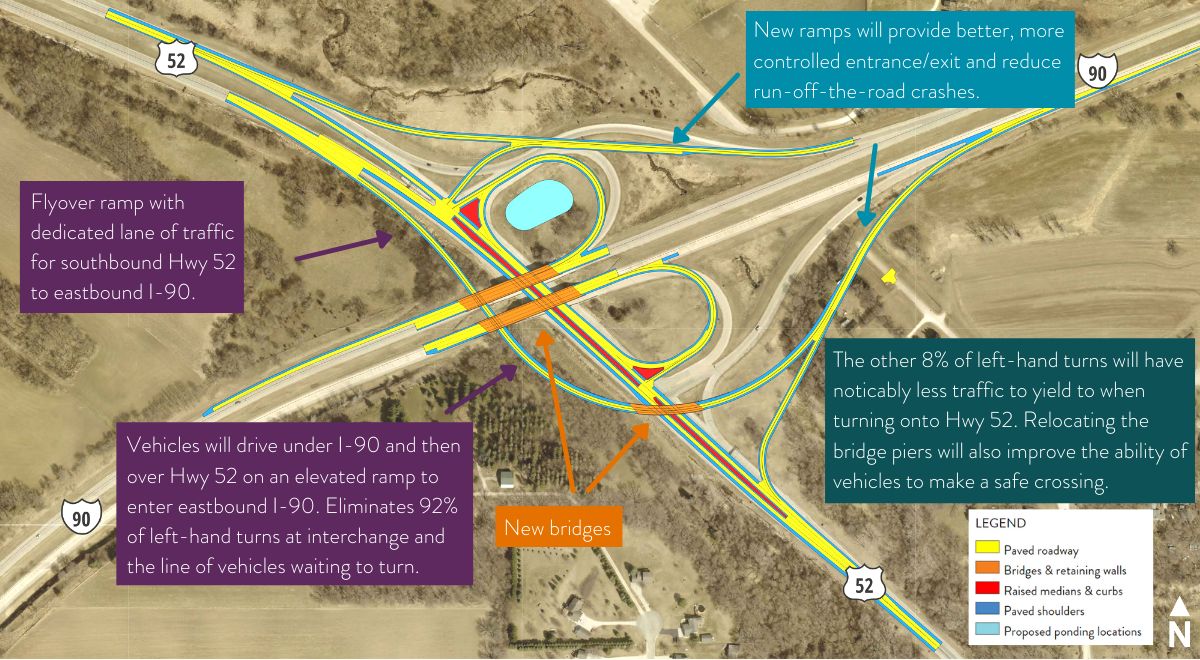
Proposed changes based on public input and technical requirements.
Learn more about the I-90/Highway 52 project and the proposed alternative on the project webpage.
Anatomy of a Transportation Infrastructure Improvement Survey: Clear Visuals Help Inform and Engage the Community
We often see surveys ask for feedback on interchange or road improvements, utilizing graphics to present the proposed changes. It’s a great way to convey complex materials and make them easily understandable. What sets this survey apart is how well the graphics are presented.
Tip: click on the survey images throughout this section to try out a demo of each Screen.
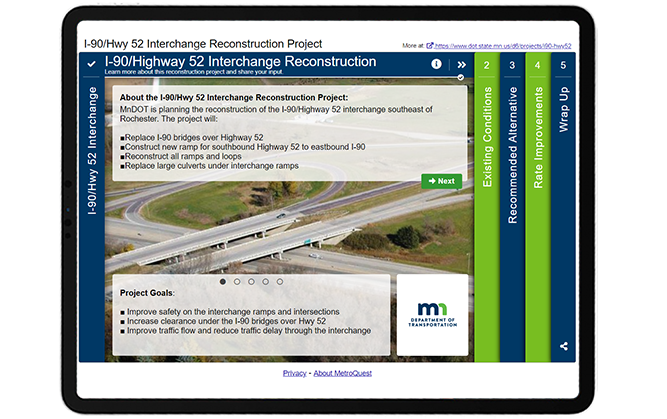
Screen 1: Welcome
The survey looks professional from the start, at the Welcome Screen. The project team utilized a color scheme that stands out and matches the MnDOT logo branding. Key details are shared on this Screen, but with the use of bullets and the sliders at the bottom, it does not appear text-heavy or overwhelming.
Screen 2: Priority Ranking
Screen 2 of this survey made use of our Priority Ranking format. If you read this blog regularly, you may be noticing a theme where surveys start with a Priority Ranking Screen. This simple exercise is an excellent way to gather precise data on your participants’ priorities. In this case, participants are asked, “What issues do you experience” and instructed to rank the following items:
- Vehicle safety
- Bike and walk safety
- I-90 bridge condition
- Vehicle mobility
- Safety at EB I-90 ramp (eastbound)
- Delays at EB I-90 ramp (eastbound)
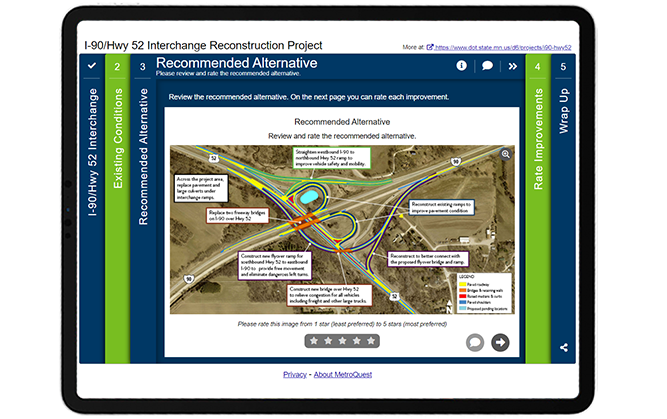
Screen 3: Image Rating (Overall Alternative)
Starting on the third Screen, the survey presents an aerial graphic with callout boxes explaining the proposed alternatives. Participants are given an opportunity to rate the overall design and are also told that they will be able to rate each improvement individually on the next Screen. This is an excellent way to gather overall feedback on the plan while also collecting specific data on each major proposed change.
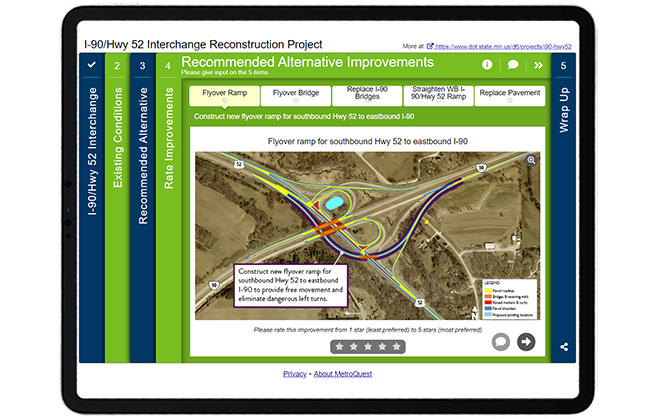
Screen 4: Image Rating (Individual Improvements)
Like Screen 3, Screen 4 uses our Image Rating Screen as a base to ask for feedback on a number of improvements. Each tab includes a large aerial graphic with a callout box identifying the specific improvement and what it will do for mobility or safety. Callout boxes are an excellent way to make an otherwise technical visual easy to digest!
Screen 5: Wrap Up
On the final Wrap Up Screen, the project team kept things simple with six demographic questions, with five utilizing a dropdown format. We highly recommend using a similar format for your next survey as the dropdown questions allow for one response per question, ensuring that you can easily quantify and cross-tabulate responses with other data. Additionally, keeping the questions minimal lessens the risk of participants dropping out of the survey early.
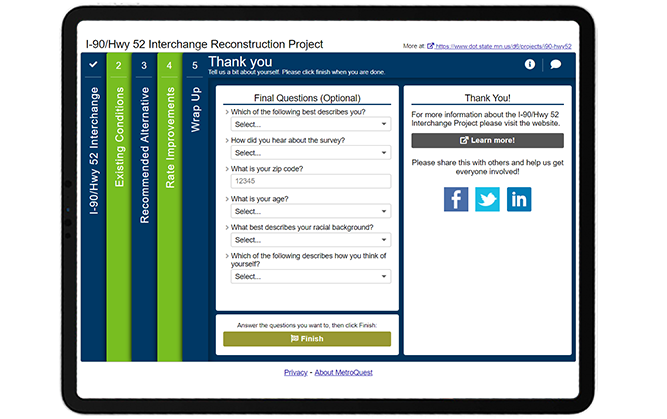
When asking demographic questions, explaining the purpose behind collecting the information can help build trust and understanding with your audience. For instance, MnDOT included the following introduction on the pop-up box for the last Screen:
Thank you for your input so far! Our goal is to get input from a wide range of individuals. In order to understand who is participating in this survey, we are collecting demographic information to identify who we’re hearing from. Providing data is optional, however, by answering you will be helping MnDOT understand the needs and preferences of the diverse communities that MnDOT serves. Your responses will be compiled in aggregate and will not be associated with you, personally.
This statement clearly explains why the information is being collected and that it will be compiled in aggregate. In this case, almost all participants completed the survey to the end, showing how effective this Screen design was.
To see for yourself, check out the demo version of the survey.
5 Tips from the I-90/Hwy 52 Interchange Reconstruction Project Survey: Effective Graphics Guarantee Quality Feedback
- Make your graphics easy to understand with callout boxes: We often see surveys that feature technical graphics and maps without explanation.
 While you may know what is being presented, it is important to remember that many of those taking your survey will not be familiar with technical drawings nor do they want to spend the time studying possible changes. Make it easy for your participants to understand the design by highlighting key improvements in callout boxes and explaining the key project benefits. Also, ensure that your aerial graphic or map has visible street labels, a clear legend, and is zoomed in enough to show the key area. This survey is an excellent example of well-designed project graphics!
 - Use visuals to seek input on infrastructure improvements: Further to the above point, we recommend to ALWAYS use visuals when you are seeking input on specific project improvements. It can be challenging for the public to visualize what the area will look like without a graphic representation. Our Image Rating Screen is an excellent choice for gathering feedback on project visuals, renderings or representative imagery. To make your project even easier to visualize, consider developing an animated 3D flythrough/walkthrough that guides participants through the improvements, contracting a rendering artist to produce realistic renderings, or working with a graphic designer to produce fun and engaging graphics. There are many options to choose from, but great visuals present many opportunities and make great promotional tools.
- Match your survey branding to your corporate or project branding: This may sound straightforward, but you can boost the professional
 look of your survey by using a color scheme that matches your logo and overall project branding. In this case, MnDOT utilized bright green and deep blue to match its logo and website branding. Everything looks cohesive, and participants don’t have to question whether they are providing feedback to a legitimate source.
 - Keep the Wrap Up Screen brief and quantitative: Your survey’s primary purpose is to gather project feedback. In most cases, you will want to collect some demographic information to ensure you are reaching a diverse and representative audience. Try and stick to approximately five questions on the Wrap Up Screen and use our dropdown format to ensure you are gathering quantitative data that can be easily cross-tabulated if needed. Take advantage of our survey templates which include pre-set demographic questions for faster survey building!
- Explain why you require personal information: No one wants to provide personal details if they don’t have to. This is why it is a great idea to explain why you are gathering demographic information. As mentioned earlier in this post, MnDOT clearly described why they were gathering personal data and how it would be analyzed and remain private. Including a disclaimer ahead of any personal demographic questions substantially increases the chances that participants will complete them.
Hats off to the MnDOT and SRF Consulting team members who designed this excellent survey! We enjoy seeing examples like this where quality visuals lend themselves to gathering valuable feedback that will inform transportation improvements.
For more great tips on how to make the most out of MetroQuest reach out for more information or, if you are an existing subscriber, contact our Director of Client Services, Norma Hogan.
Check out our recent webinar to learn ways to optimize your virtual community engagement through effective outreach strategies and great survey design!

Optimizing Virtual Community Engagement to Build Public Support
A well-designed survey and an effective outreach campaign are two elements critical to public engagement success. Watch this webinar for case study examples from successful projects!