[SURVEY OF THE MONTH] Imagining Bridge Concepts Through Images with Linn County Conservation

The Survey of the Month series is a monthly blog where we highlight the extraordinary work our customers are doing! We feature well-designed surveys and share takeaways that are relevant for anyone interested in making the most out of online engagement using MetroQuest’s survey platform. To see more in the series, visit the blogs here.
In this blog series, we often feature surveys that focus on long-range planning initiatives, major statewide or corridor plans, or other broad-based planning projects. This month, we wanted to showcase a survey that demonstrates how MetroQuest can be equally useful for smaller or more specific local projects.
Community engagement is typically part of the process during long-range planning initiatives where projects and improvements are prioritized on a large scale. Yet, often there is not enough time to re-engage the community to gather their opinions as projects move into design phases. Tight project timelines, complicated decision-making processes, and bidding processes make it more challenging to conduct public engagement during infrastructure development projects. However, the small design choices often impact commuters and residents the most.
As your team heads into the new year and plans for upcoming projects, we encourage you to consider whether there is an opportunity to survey the community on more specific design components for a project. You might be surprised by how engaged people can be when it comes to the design of a specific street, bridge or public area!
What’s the story? Consulting on Bridge Design in Linn County, Iowa
Linn County Conservation owns and oversees over 8,000 acres of public resources such as parks, trails, campsites, and other facilities in the county area surrounding Cedar Rapids, Iowa.
The county, in collaboration with Corridor Metropolitan Planning Organization, is working on a Highway 100 Trail Alignment Project to convert a former railroad route around the western perimeter of Cedar Rapids into a cycling and walking route. This route is proposed to make use of the base structure of the Milwaukee Road Rail Bridge, first constructed in 1905-06. This bridge was eventually abandoned and deconstructed in 1983 due to changes in traffic patterns. With the popularity of active transportation infrastructure, this historic route may have a purpose once again—from rail to trail!
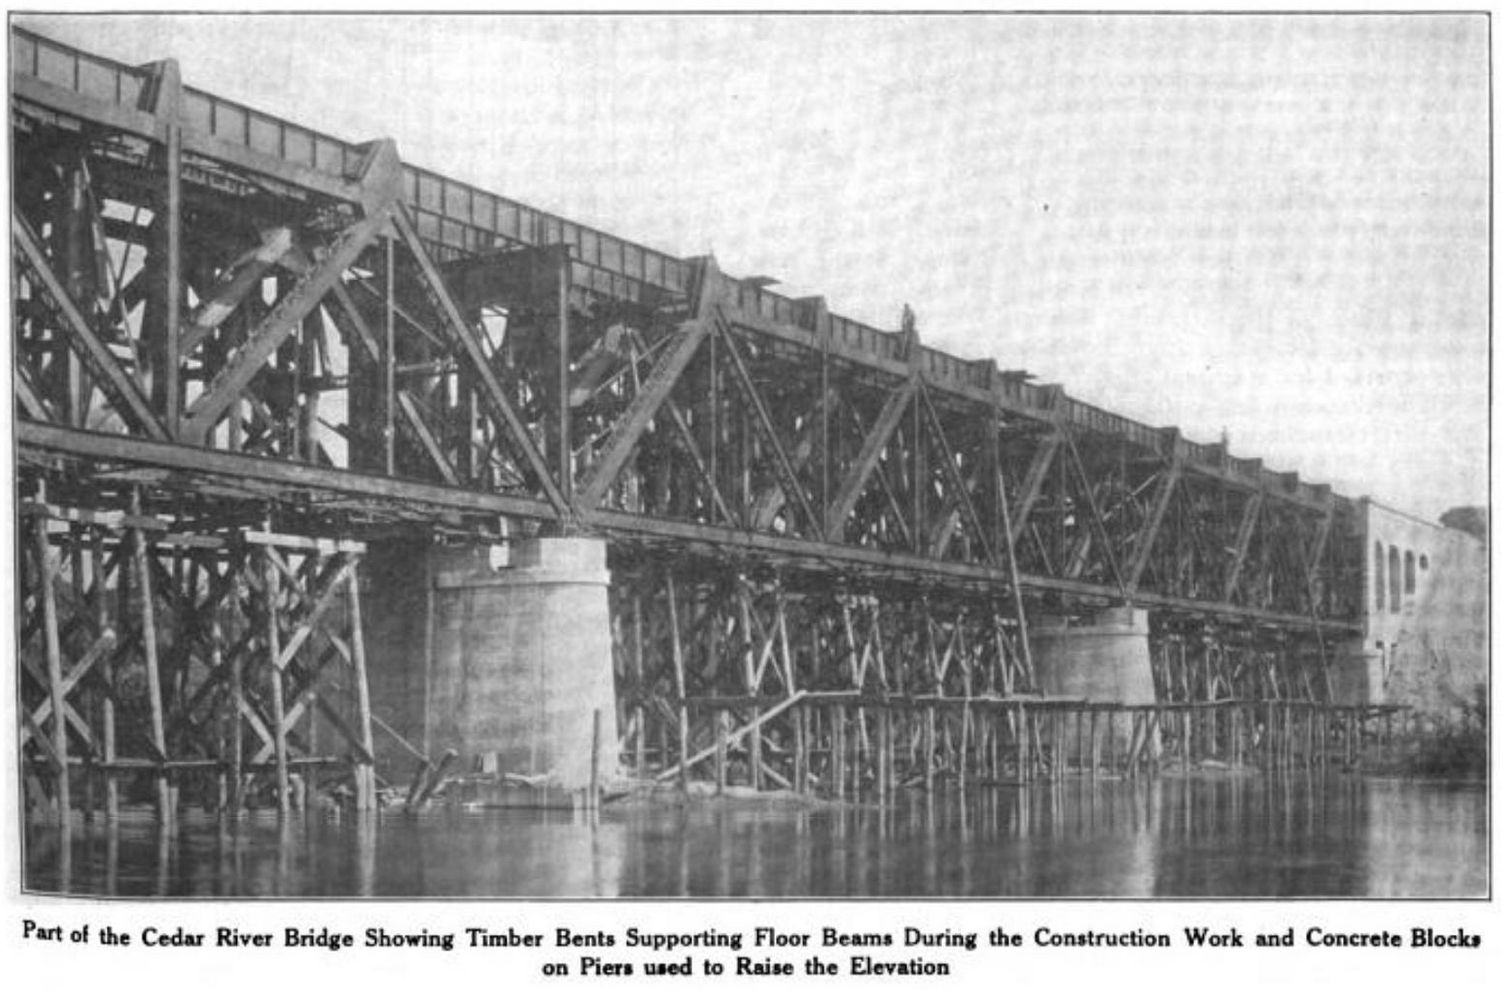
Image circa 1923 showing the original Milwaukee Bridge structure during construction upgrades (source).
Linn County contracted Snyder & Associates, a full-service civil and structural engineering firm and MetroQuest subscriber, to study the condition of the existing Highway 100 Bridge’s abutments and piers to determine whether they could support a new trail bridge to cross this section of the Cedar River. The engineering study concluded that the bridge’s abutments are sound (the supports at the end of each side), but the piers (supports in the river) are not in good condition.
To move forward with the design process and establish a preferred concept, Snyder & Associates developed a MetroQuest survey to gather feedback on important considerations and design options. Following the survey being live from September 16 to October 14, they heard from over 1,300 people—an astounding number for an area with about 230,000 residents.
As we see with many successful surveys, an emphasis was placed on sharing the survey frequently through various channels. Linn County Conservation spread the word through Facebook and e-newsletter blasts, reaching a wide audience across the area. Local media also covered the project, helping further inform the community.
Let’s get into the survey itself now and how the team at Snyder & Associates used a visual format to communicate the possibilities for the new bridge.
Anatomy of a Bridge Design Survey: Using Visual Screens to Communicate Design Concepts
As we walk through the survey, notice how it follows a logical order—starting with general considerations—and ending with bridge span and repair options. The survey is quick, takes approximately five minutes, and can be easily completed on a phone, yet it still managed to collect over 19,500 individual data points (about 15 data points per participant).
Feel free to pull up the demo survey on a separate tab to go through it while reading the remainder of this blog.
Screen 1: Welcome
Immediately, when you visit the Welcome Screen, you are greeted by a calming, almost watercolor-like image of the existing bridge’s concrete supports. Like consumer product branding, the color choices, image and overall look of the survey can significantly impact whether participants gravitate to the survey.
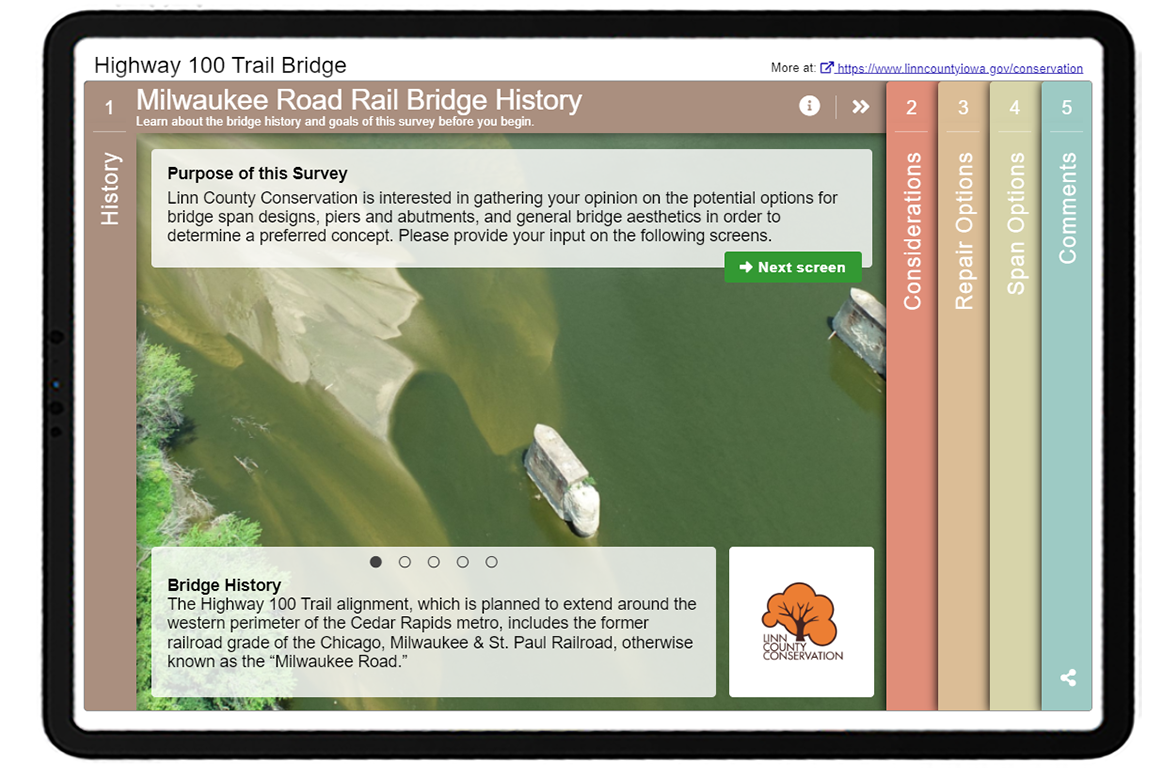
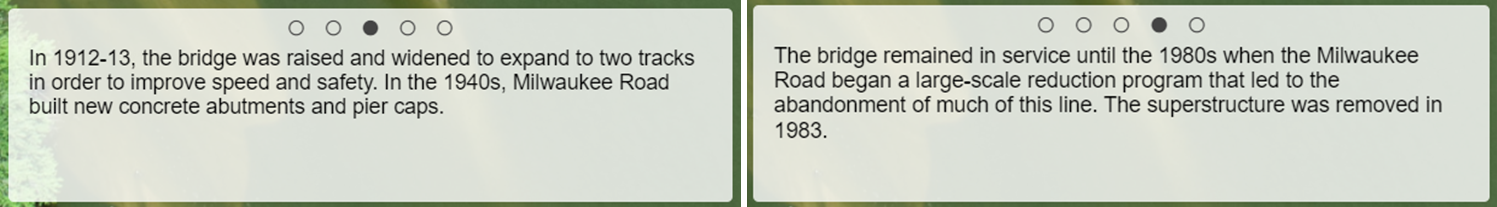
The descriptions on the Welcome Screen are concise yet informative. The sliding details at the bottom of the Screen help tell the story about the existing bridge:
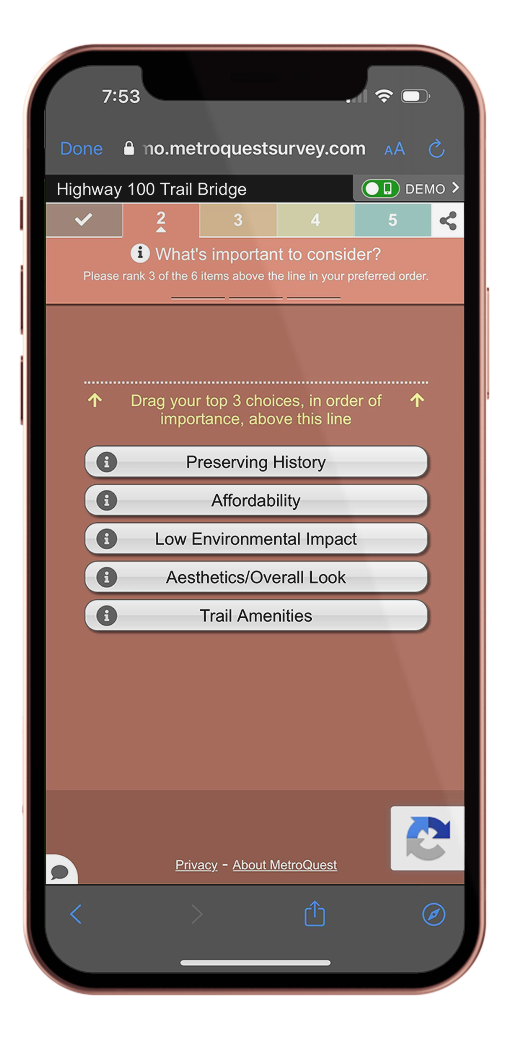
Screen 2: Priority Ranking
The survey exercises start with a customer favorite: the Priority Ranking Screen. The team used this Screen to ask participants about what should be considered the most when designing the bridge:
- Aesthetics/Overall Look
- Preserving History
- Low Environmental Impact
- Trail Amenities
- Affordability
By asking participants to rank their top three of five options, this Screen would have taken most participants just a few seconds to complete. We are all busy; if you can balance gathering quality data without expending your participant’s time, you have reached the perfect survey design scenario.
When building a MetroQuest survey, take advantage of our feature where you can toggle between web and mobile view. As demonstrated in the diagram below, over 50 percent of survey respondents completed this survey on a mobile device, meaning it was even more important to ensure the survey was quick, concise and compatible across all mobile devices.
By just including five priorities, notice how the survey content fits well on a phone screen.
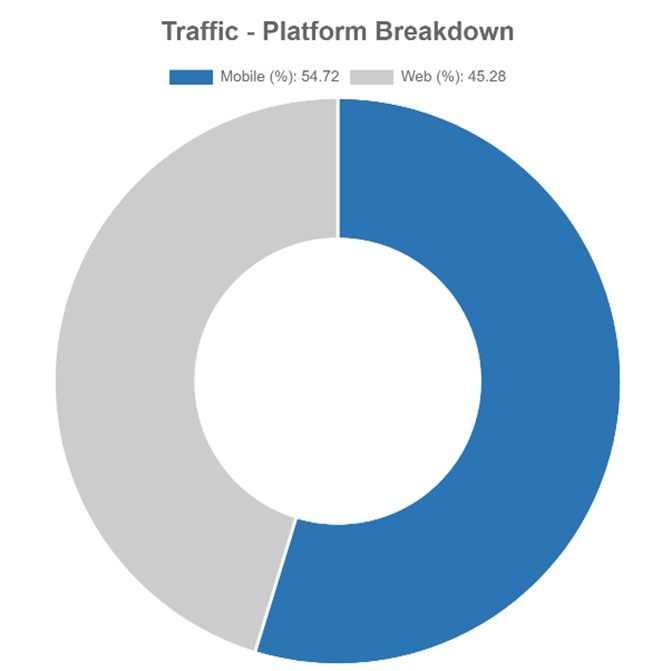
Circular graph showing that approximately 55% of respondents accessed the survey on a mobile device such as a phone and 45% on a laptop/desktop.
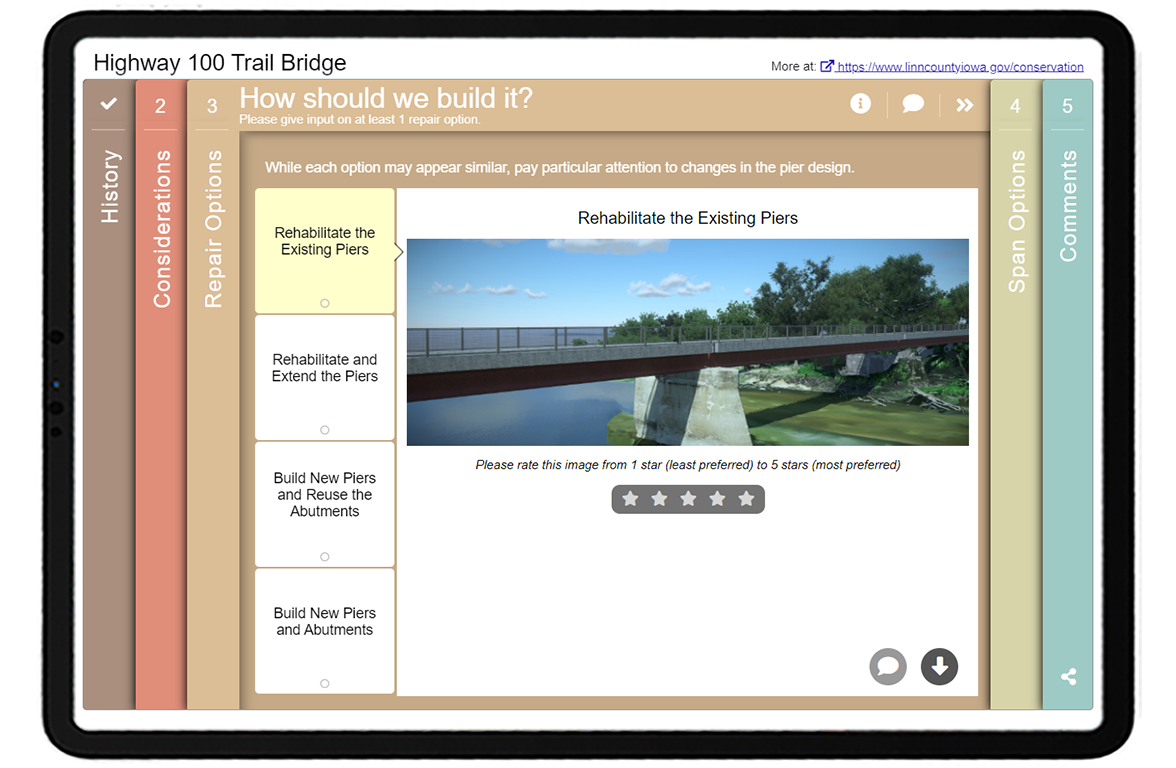
Screen 3: Image Rating
After defining the most important considerations for the bridge design process, the survey transitions into the highly visual Image Rating Screen. The Screen walks participants through four different repair options, showing a rendering of each concept:
- Rehabilitate the Existing Piers
- Rehabilitate and Extend the Piers
- Build New Piers and Reuse the Abutments
- Build New Piers and Abutments
As some of these terms may be new to respondents, they indicate on the info pop-up that “piers are the middle supports of the bridge, while abutments are the end supports”.
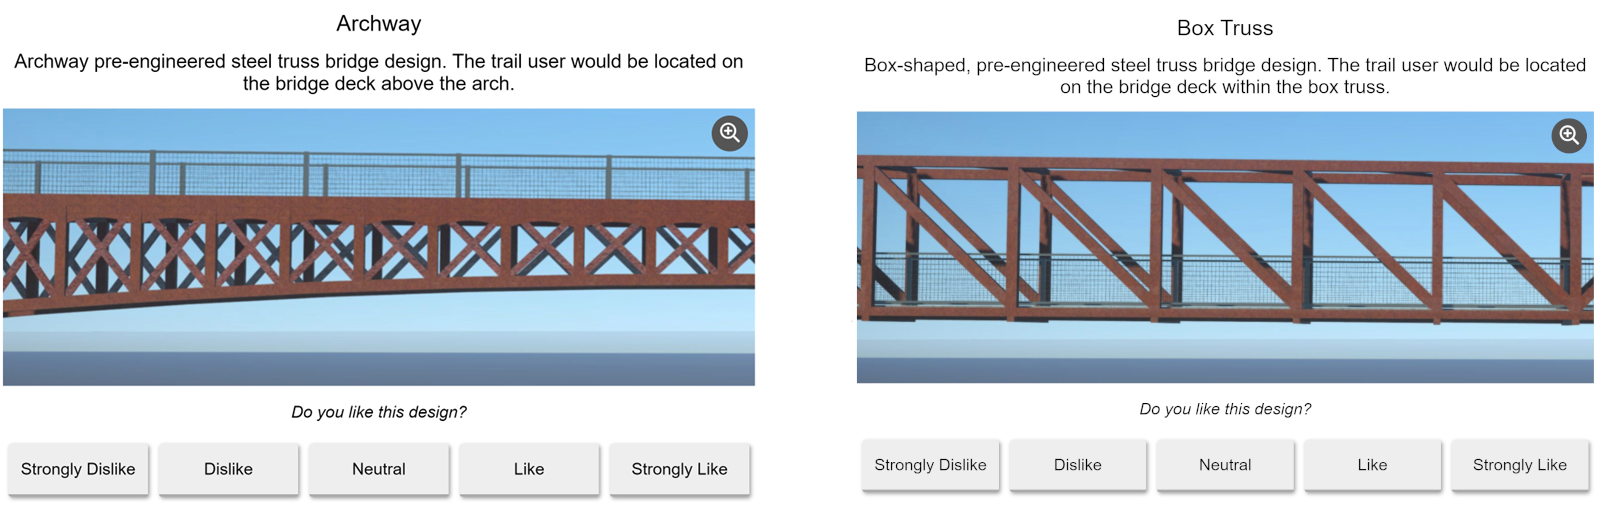
Screen 4: Image Rating
Bridges stand out, especially in more natural settings, so design matters! On this second Image Rating Screen, the team presented five bridge design options for input (shown below). As is important when using a Likert scale, they used a range with a neutral option. The average person not in the construction industry likely has no idea about the difference between an archway versus a box truss design and the visual impact they can have. Taking an image-based approach to collecting feedback will always ensure you receive valid input.
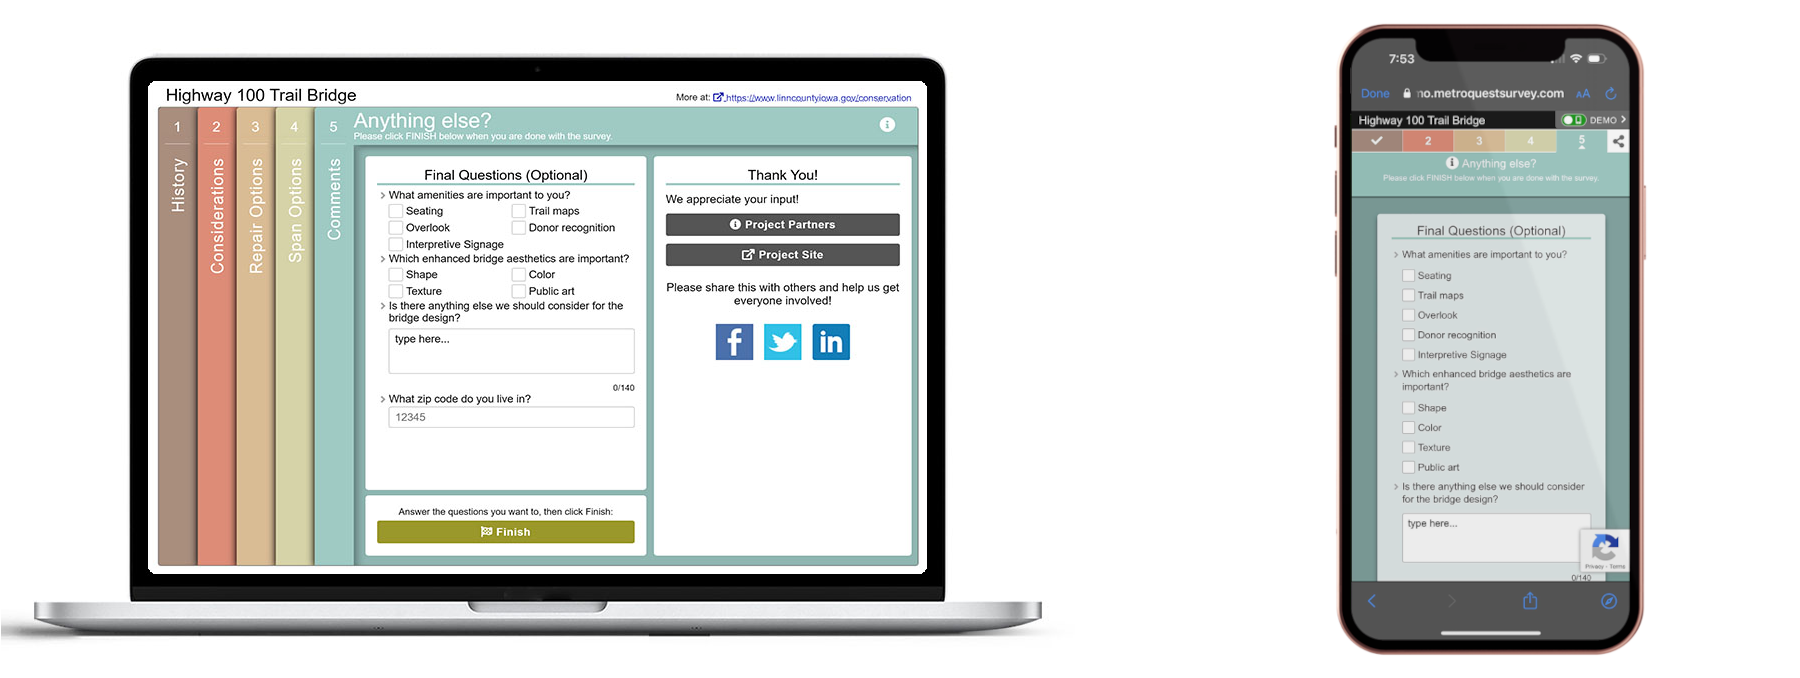
Screen 5: Wrap Up
On the final Screen, the survey continued its very simple and minimal approach. Participants were asked to check their top amenities, the most important bridge aesthetics, write any additional comments and share their home ZIP code. Notice how this Screen’s simplicity suits the mobile format shown on the right. The questions are brief and don’t take up too much space nor require significant scrolling.
5 Tips from the Highway 100 Trail Bridge Survey: Concise and Visual Surveys are Always Effective
- Consider engaging the community on specific design concepts: During infrastructure projects, there are numerous opportunities where you can solicit public input; it does not necessarily only have to be during the initial planning phase. Look at your project timeline and key decision points to determine where there might be opportunities to check back in with the community. When there are specific design concepts to share or a framework for feedback, participants may have an easier time providing comments as they don’t have to brainstorm from zero.
- Design your survey for mobile users: Since most of us design and create surveys on a desktop or laptop computer, it can be easy to forget that most participants will come across your survey while scrolling through social media and navigate to the survey on their phone. Use our survey editor’s mobile view to see your content’s appearance on a mobile frame. Usually, the less text, the better!
- Avoid jargon or explain it: Terms that you may be familiar with as a planner, engineer or communications professional may be entirely new to some participants. We recommend having a family member, friend or colleague unfamiliar with the project and industry take the survey before you launch it to ensure everything is understandable. If it is important to use specific terms, add a definition like Snyder & Associates did on Screen three.
- Let your visuals speak for the content: As the saying goes, “an image is worth a thousand words”; consider that many will be trying to complete your survey quickly. Typically, it is more effective to communicate a design concept through a rendering or visual. Add a caption and image descriptors/callouts where necessary but let the image communicate the design. Image-sourcing or rendering design can be the most challenging part of project communications and survey design; we recommend dedicating a good chunk of time to work on this and making sure to browse our image library.
- Keep your second Screen simple: Most MetroQuest surveys start with a Priority Ranking Screen for a good reason, it offers a quick, simple introduction to the survey. We always recommend starting with a straightforward exercise like Priority Ranking, Tradeoffs or Image Selection. The first two Screens are critical for influencing whether participants decide to close the survey window or continue answering questions—keep this in mind when designing the flow of your questions.
Thank you to the Snyder & Associates team and Linn County Conservation for the opportunity to showcase this excellent bridge design survey. Don’t forget to check out the full survey demo here.
If you’ve reached this point, thank you for taking the time to read our blog! See you next month.
For more great tips on how to make the most out of MetroQuest, reach out for more information or, if you are an existing subscriber, contact our Manager of Client Services Team, Woo-Ree Cho.