[SURVEY OF THE MONTH] TxDOT Gathers Over 35k Data Points to Inform Bike Plans

The Survey of the Month series is a monthly blog where we highlight the extraordinary work our customers are doing! We feature well-designed surveys and share takeaways that are relevant for anyone interested in making the most out of online engagement using MetroQuest’s survey platform. To see more in the series, visit the blogs here.
The transition into the spring season is welcomed by many, including enthusiasts of active modes of transportation, such as biking. Whether you are a dedicated year-round cyclist commuter, an avid road cyclist, or a “hop on a bike occasionally when the weather is nice” hobby biker, a growing number of people are utilizing bike infrastructure to get from A to B for exercise or leisure.
This month, we feature not one but four bike plan surveys recently conducted by the Texas Department of Transportation (TxDOT) across various districts, including San Antonio, Bryan, Pharr and Laredo.
Ride along as we delve into this series and share some key takeaways from their surveys and overall approach.
What’s the story? Improving Bike Infrastructure on Major Texas Routes
Long-time MetroQuest customer TxDOT launched four surveys in English and Spanish to seek input on bike infrastructure across several key regions in order to inform district bicycle plans. The surveys ran for ten weeks from December 2022 to February 2023. They focused on gathering feedback on cycling routes near roads owned and operated by TxDOT, often near major highways and arterial routes.
Questions and exercises gathered data on what priorities matter most to cyclists, key details about each person’s travel habits, and geospatial data on cycling concerns. This straightforward approach yielded an incredible amount of data: 35,000+ individual data points from 1,400+ survey participants!
Surveying by District
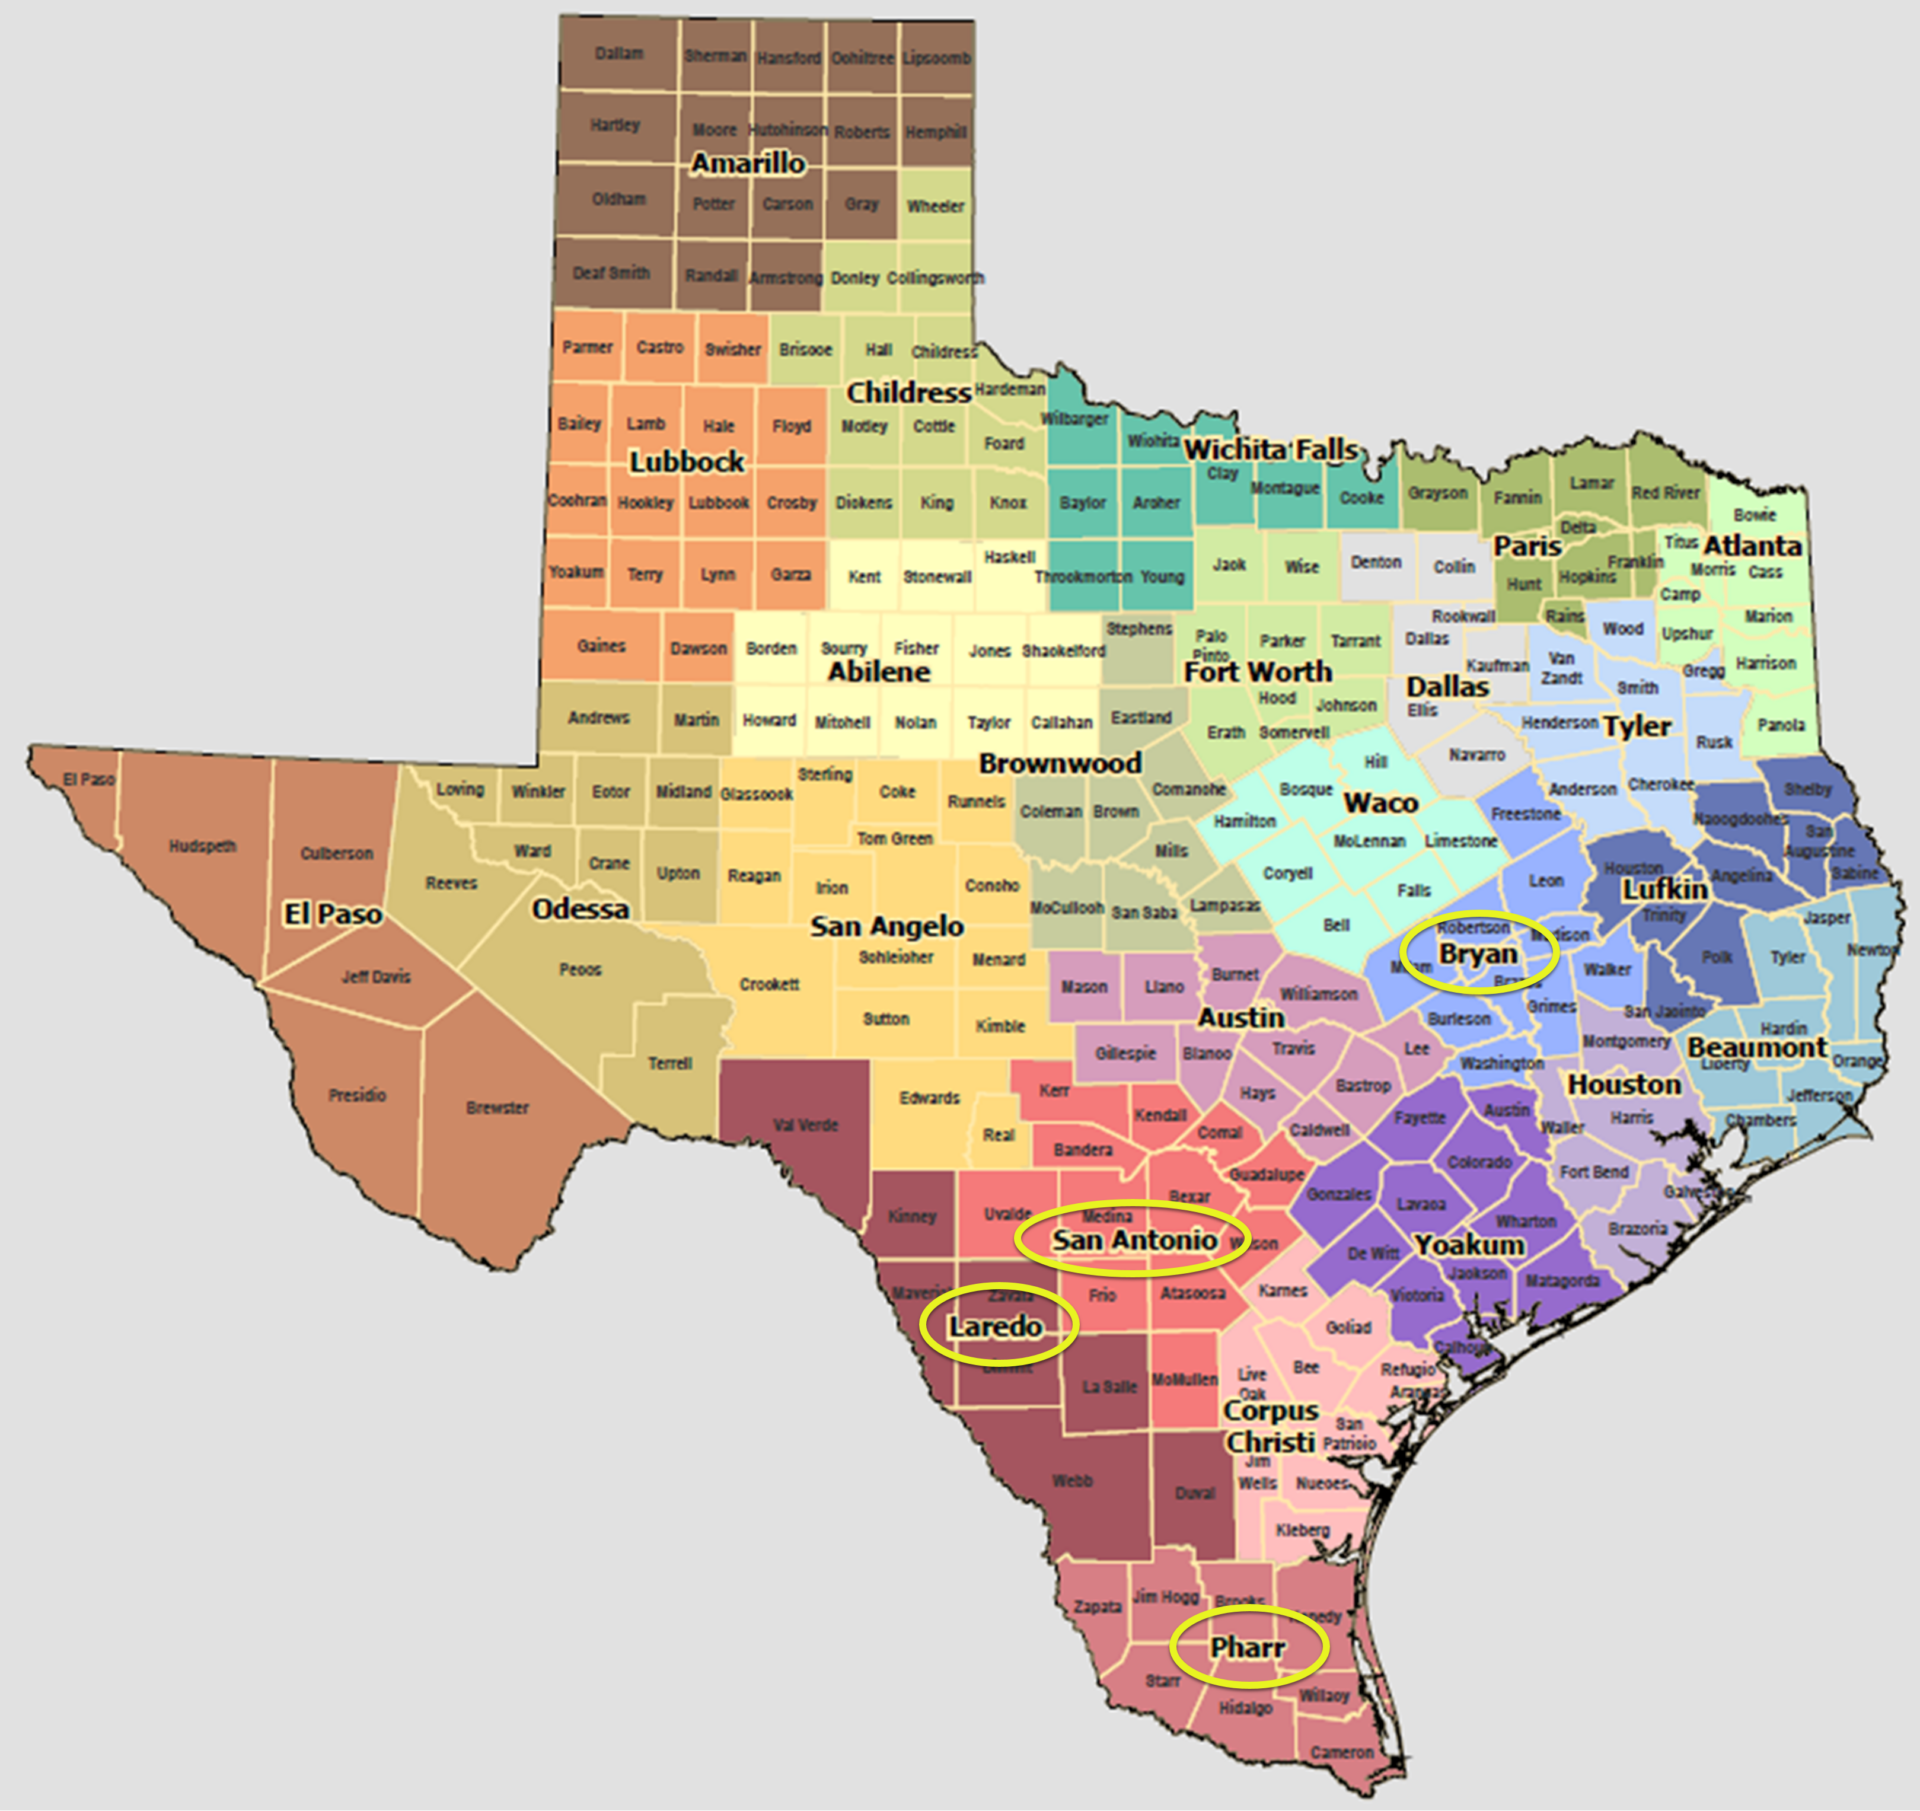
Map of Texas Districts with survey locations circled. Full map here: https://www.txdot.gov/data-maps/reference-maps/district-county-maps.html
We often see DOT’s survey statewide on bike or widescale active transportation plans. Even if the findings will eventually be compiled together to inform one statewide plan, in certain situations, it can be much more effective to take the time to create individualized surveys for separate regions. Several benefits stem from this approach:
- The ability to target each area specifically, including promoting each survey on social media to each region.
- The customizability of certain content and survey screens (e.g., zooming in on the Map Marker Screen on the specific area).
- Since the datasets will be divided with separate surveys, you can easily combine them at the end but have the option to easily see and compare sentiment in each area.
Deciding how you will engage various regions or areas in statewide plans is a key aspect to consider when planning for engagement.
Making Engagement Accessible
To ensure language would not be a barrier, all English surveys were translated into Spanish. As is standard with MetroQuest surveys, the translated versions are linked on the Welcome Screen so that anyone coming across the English version knows there is a Spanish one available as well.
Further, the TxDOT team provided contact information for anyone requiring interpretation, translation or assistance completing the survey. Overall, TxDOT’s approach to engagement provides valuable insights into conducting effective, region-specific surveys to gather feedback on bike infrastructure.
Translation Feature Update!
We just released a new, revamped translation process that allows you to translate your survey seamlessly in just a few clicks. Additionally, all data will now be combined into one dataset, so there is no longer a need to combine or analyze separate language datasets.
Anatomy of Cycling Surveys: Simple and Map-Based
If you read our March blog, you might be experiencing some déjà vu! These surveys follow the same screen order as PlanRVA’s BRT survey but solicit entirely different data on cycling, not transit.
All four surveys followed a similar format; feel free to open one or more of the following demo versions to try them for yourself:
Hold onto your handlebars as we cycle through some fantastic survey content!
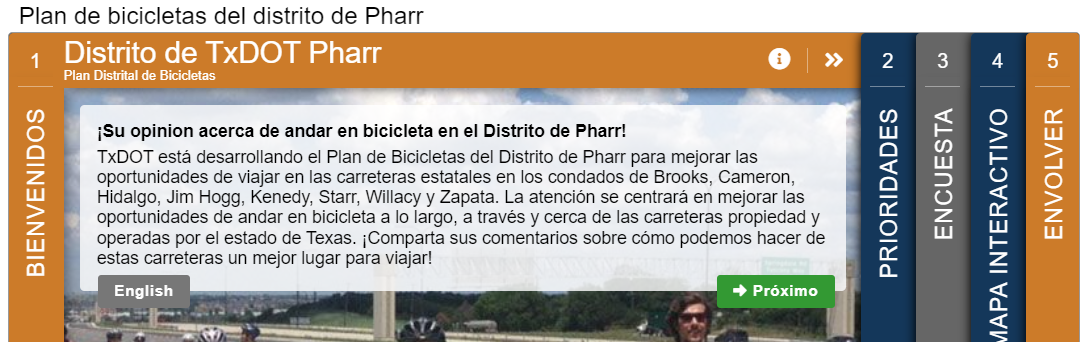
Screen 1: Welcome
All four surveys welcome participants with a quick introduction to the survey purpose:
“This plan will focus on improving opportunities to ride a bicycle along, across, and near roads owned and operated by the state of Texas. Please share your input on how we can make these highways a better place to ride!”
The Welcome Screen is informative but direct in the task at hand.
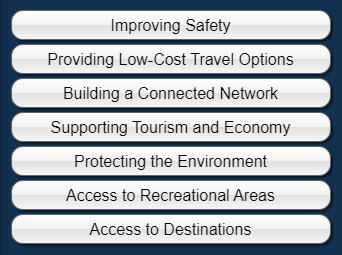
Screen 2: Priority Ranking
As with many well-designed MetroQuest surveys, they start with a Priority Ranking Screen, gathering preferences on the participant’s top three of seven key options for improving bikeways:
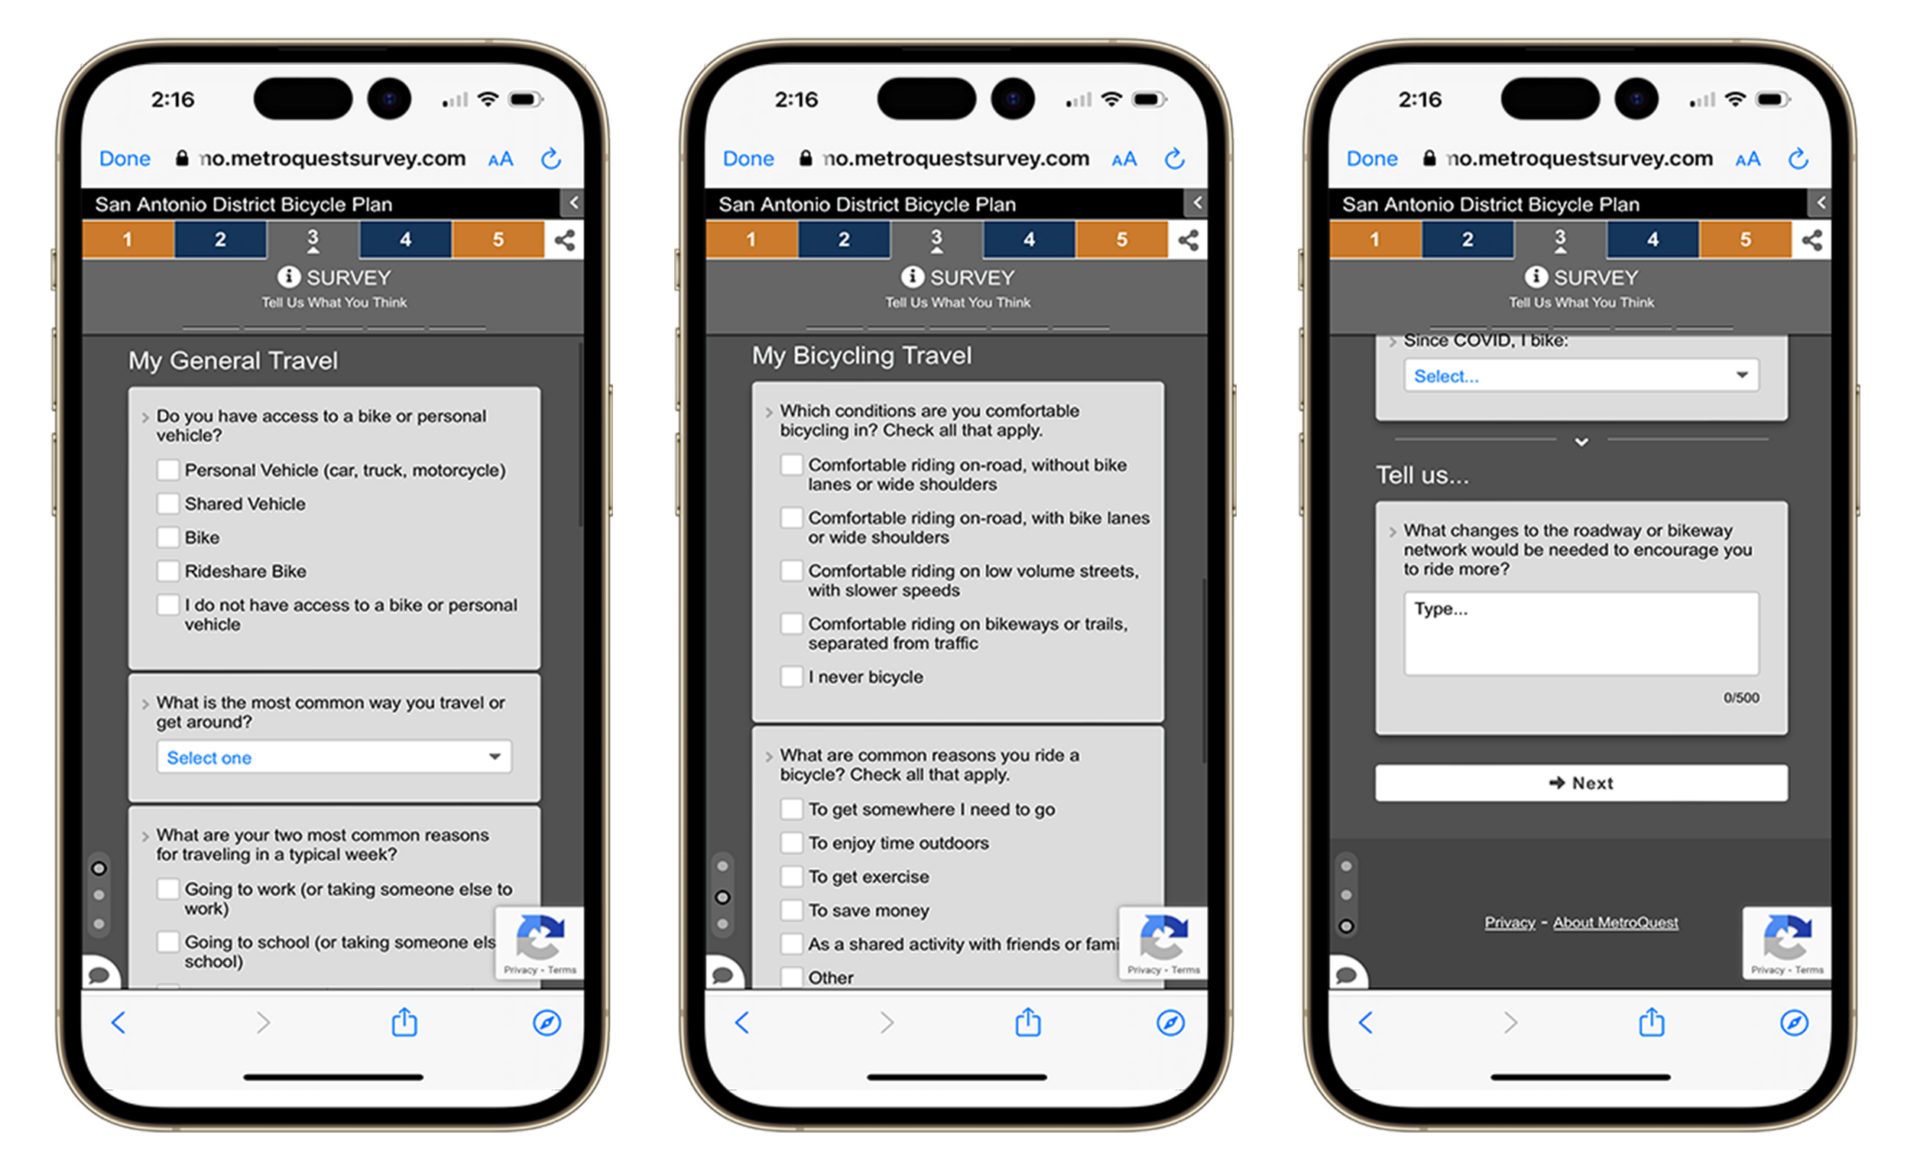
Screen 3: Standard Survey
Given that cycling preferences, behavior, and needs can vary, the team recognized the importance of collecting more general information on travel activity.
Utilizing the Standard Survey Screen, they asked various questions, such as biking conditions, why you ride a bicycle, how often, and other travel methods.
Finally, they end this Screen by asking what roadway or biking network changes would encourage you to ride more often. This simple question gets right to the point!
Screen 4: Map Marker
A MetroQuest transportation survey, especially about biking, wouldn’t be complete without a Map Marker Screen. This is where dividing the surveys by district really paid off. Rather than having participants start on a zoomed-out map of Texas, each survey featured an interactive map specific to the area. Blue road lines indicated TxDOT routes where they sought feedback, while a black outline delineated the study area.
In particular, we like how precise the dropdown Map Marker questions are here. Typically, the more specific you are with your ask, the more accurate data you will receive.
Check out the below GIF to see some of the different questions TxDOT asked through this map screen:
Screen 5: Wrap Up
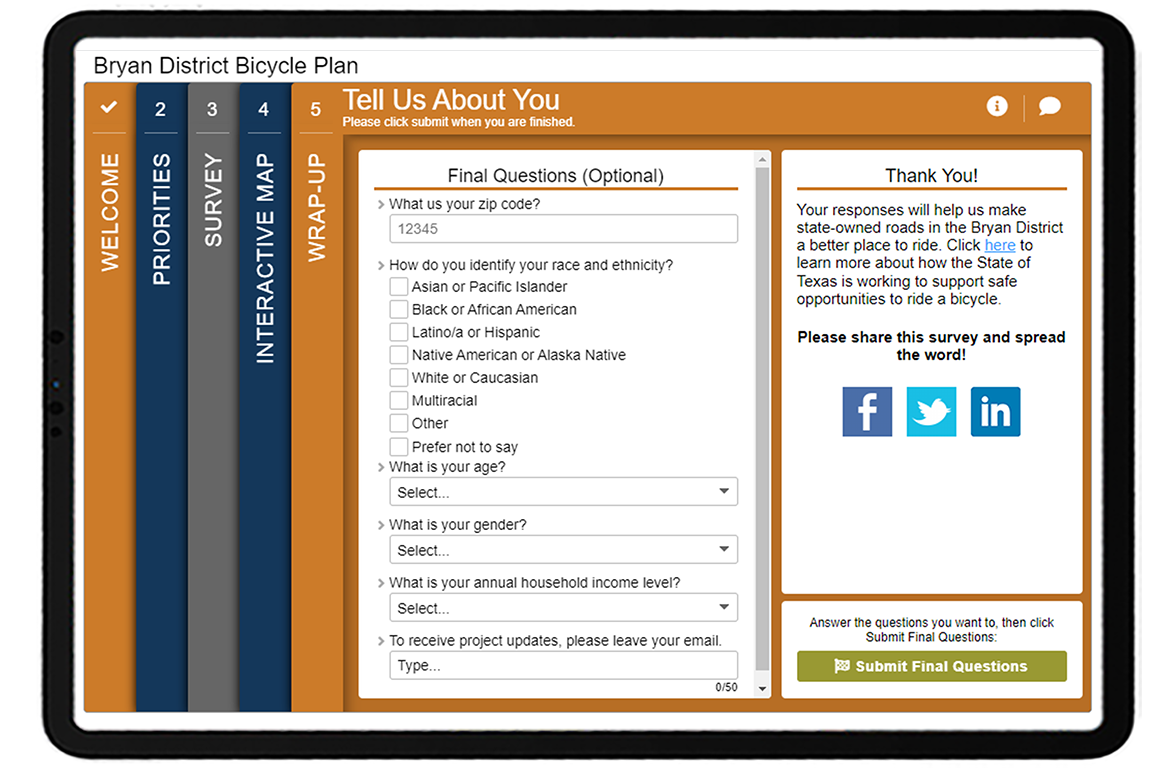
To close, the surveys ask for basic demographic information on the final Wrap–Up Screen. Asking for some personal information, including ZIP code, race and ethnicity, age, gender, and annual household income, ensured the project team reached a diverse audience and allowed them to identify any significant demographic trends linked with cycling. If you don’t ask for this type of information, you will never know who you reached in the first place.
5 Tips from the TxDOT District Bicycle Plan Surveys:
Overall, there’s quite a bit to take away from these bike plan surveys. Here are our top five suggestions:
- Consider a district-by-district approach for statewide planning: If you are involved in an initiative that requires engagement with various regions, it can pay off to take the extra time to create individualized engagement strategies and surveys for each zone. Try to keep your surveys and engagement equivalent, as TxDOT did here, so you can easily compile information together later.
- Get to know your participant above and beyond basic demographics: The amount of personal or behavioral information to ask is a delicate balance—you don’t want to seem intrusive but want to gather enough information to get a good sense of who you heard from. It can be instrumental in asking participants about their current transportation habits to help frame the context of their responses. Someone who has never cycled before versus a seasoned bike commuter will likely have very different preferences regarding bike infrastructure.
- Keep it simple: We might sound like a broken record saying this, but it’s likely the most crucial factor behind a successful survey. We are all busy, and most people have limited time for completing a survey. Many take surveys quickly on transit or while waiting in line somewhere. The more straightforward and direct your survey is, the more likely people will make it to the end.
- Ask for specifics on the Map Marker Screen: Your Map Marker Screen can solicit much more input than just pins dropped on a map. Utilize the option of up to five questions on each marker (one to three questions is best). As evident with this survey, you can get very creative with what you ask about each marker.
- Indicate why you need personal information: Personal data is sensitive; most prefer not to share it widely. Explain why you are gathering the information to encourage more respondents to share their ZIP code, age, income level or other details. For instance, TxDOT included a short note on the Wrap-Up Screen pop-up stating, “Please answer a few optional questions to ensure we are reaching a broad range of people and communities…”.
Bravo to the TxDOT team for their fantastic work with these surveys! We look forward to seeing more quality surveys from their team. Check out some earlier Survey of the Month blogs featuring TxDOT surveys linked in the right sidebar.
For more great tips on how to make the most out of MetroQuest, reach out for more information or, if you are an existing subscriber, contact our Manager of Client Services Team, Woo-Ree Cho.
New on our blog: 10 Tips on How to Promote Public Participations in 2023