![[SURVEY OF THE MONTH] Gathering Stakeholder Input for Future EV Infrastructure in Maryland](https://metroquest.com/wp-content/uploads/00-MDOT-ZEVIP-Header.png)
The Survey of the Month series is a monthly blog where we highlight the extraordinary work our customers are doing! We feature well-designed surveys and share takeaways that are relevant for anyone interested in making the most out of online engagement using MetroQuest’s survey platform. To see more in the series, visit the blogs here.
Continuing with the theme from our recent blog post, The Future of Electric Vehicles in Transportation Planning: An Interview with Andrea Noel about Tennessee’s electric vehicle survey, this month, we are featuring a survey developed jointly by the Maryland Department of Transportation (MDOT) and the Maryland Energy Administration (MEA).
Join us as we learn how MDOT and MEA gathered strategic input from key stakeholders and the public to inform their State Plan for National Electrical Vehicle Infrastructure (NEVI).
What’s the story? Applying for EV Infrastructure Funding
The NEVI Formula Program was established in 2021 as part of the Infrastructure Investment and Jobs Act (IIJA) and provides funding dedicated to implementing electric vehicle (EV) charging infrastructure. This major US-wide program comprises up to $7.5 billion total funding allocated between states.
Every state is required to submit a deployment plan before using any of its allocated federal funding to develop EV infrastructure. Maryland, in particular, has been consistently listed as a leader in transportation electrification. As is evident with this survey and the plan, they put a significant amount of time and resources into collaborating and coordinating efforts for improved EV infrastructure.
To directly inform the plan, MDOT and MEA sought input from stakeholders and the public through a MetroQuest survey launched in March 2022 that remained open for just over four months. The project team received input from 293 participants at the time of submitting the NEVI plan and ended up hearing from an additional 500 people before the survey closed. The survey results will continue to inform the development of the NEVI program.
The MetroQuest survey helped us better understand where communities and stakeholders would like to see publicly available EV charging stations. This will help Maryland prioritize installations along corridors and will be useful in the future as we move from corridor-based charging installations and into communities. This information will help us communicate priorities with site hosts and other partners interested in installing infrastructure
– MDOT Project Team
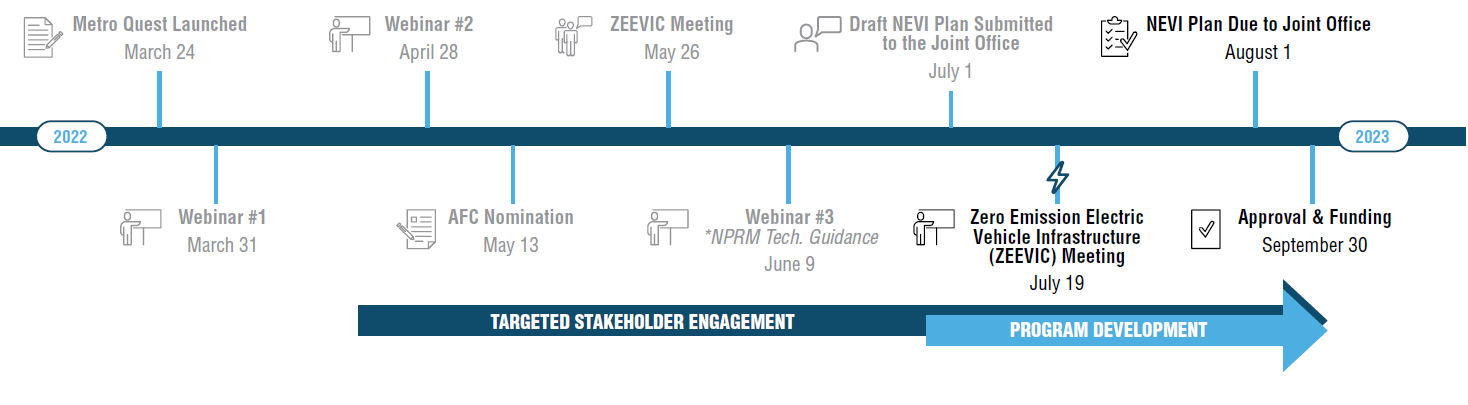
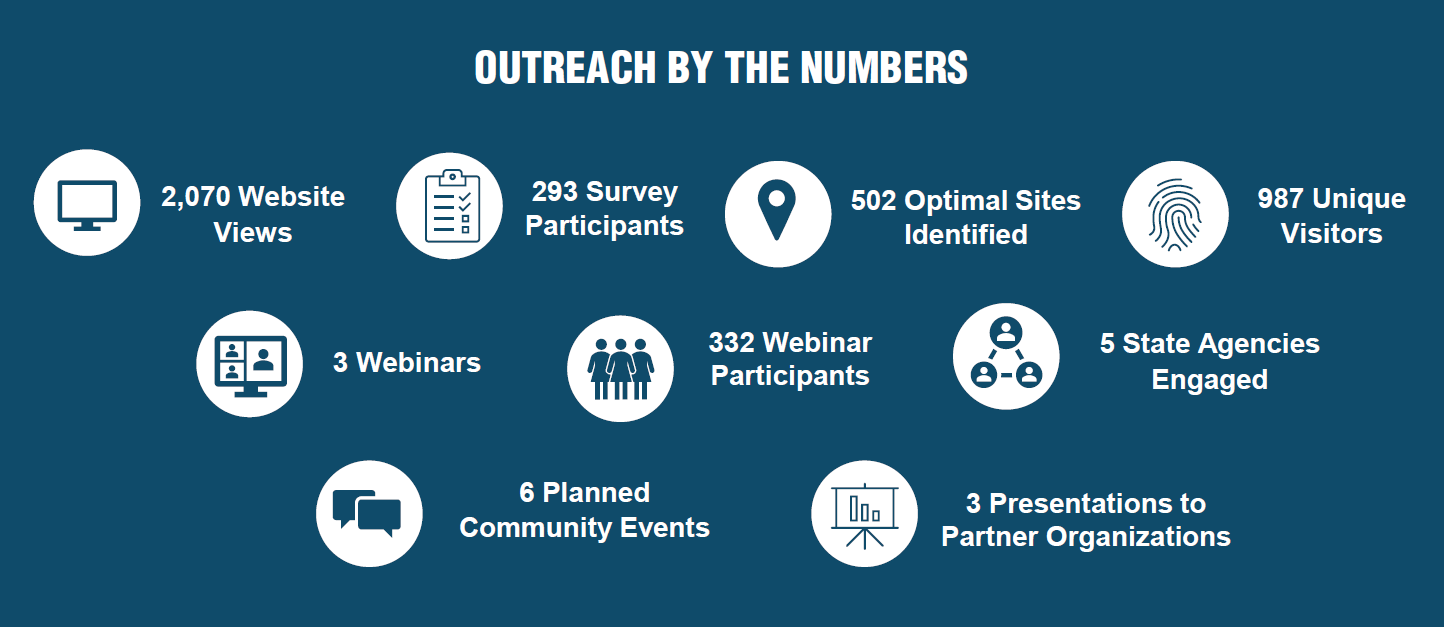
MDOT and MEA were able to reach a broad audience through advertising on their existing websites and social media channels. Additionally, interagency consultation and coordination were instrumental in expanding the survey’s reach and contributed greatly to a boost in responses in July. As with many projects, the survey was just one aspect of a comprehensive outreach program:
The ZEVIP survey was not MDOT’s first EV-related MetroQuest survey. In 2019 they engaged local governments 1 about EV infrastructure and gathered input from over 1,500 participants on their EV Workplace Charging survey in March 2020. These previous surveys identified EV-related challenges encountered by local governments and optimal charging locations—input that helped inform the ZEVIP survey and plan.
Follow along as we share key aspects of MDOT’s ZEVIP survey below. We also encourage you to check out their fantastic project website and NEVI plan for more details.
Anatomy of an Electric Vehicle Plan Survey: Gathering Key Criteria and Location-Based Data
Given the need to directly inform a plan to access state funding, the MetroQuest survey contained very specific questions and asks. The combination of a Strategy Rating, Standard Survey and Map Marker Screen resulted in specific quantitative input and geographic data on preferred EV charging locations.
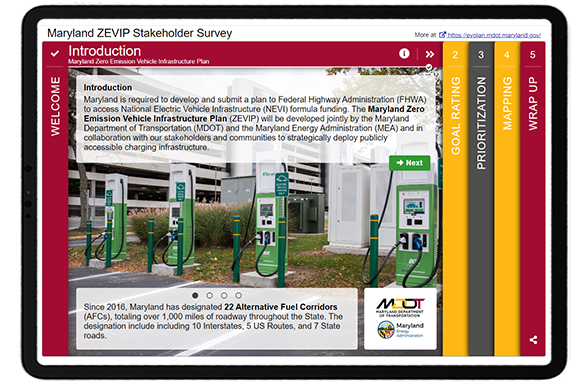
The survey is identifiable from the start as it welcomes you with a photo showing electric vehicle charging stations. The color scheme matches the branding, and the concise but explanative introduction shares the purpose behind the survey and key facts such as, “as of February 28, 2022, there are over 43,700 EVs registered in Maryland. Over the last 12 months, Maryland has been averaging over 1,100 new EVs registered per month.”.
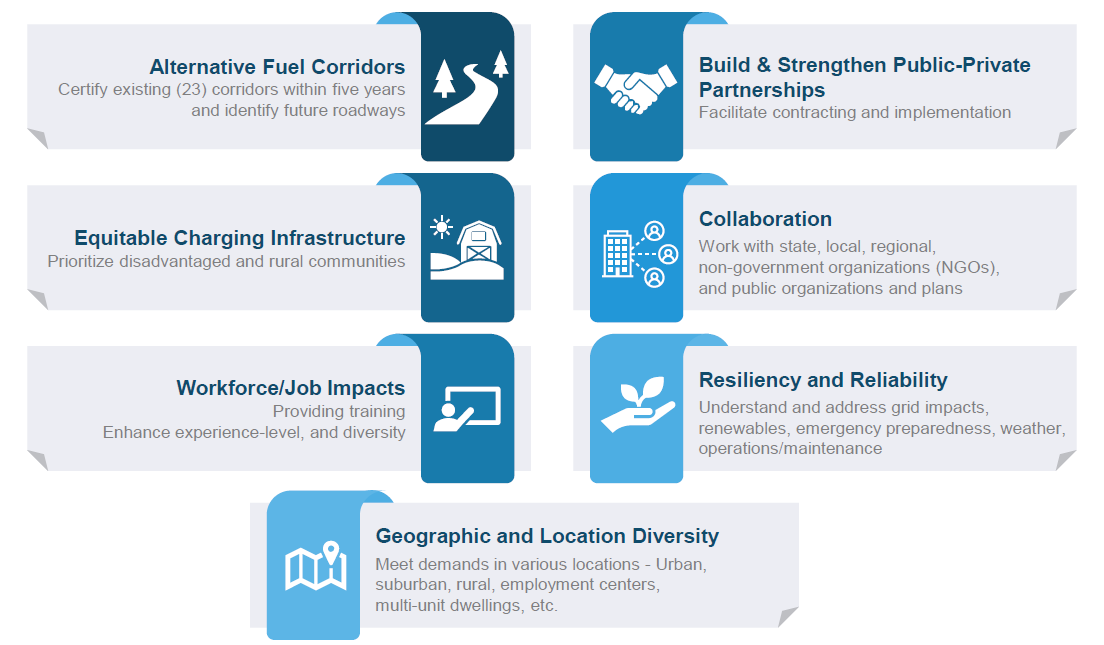
Following the initial Welcome Screen, a Strategy Rating Screen was used to gather input on seven key goals, as displayed below. The Strategy Rating Screen is one of our most popular Screen options as it allows project teams to gather quantitative input on a series of statements such as goals or project priorities. It is an excellent choice for projects in the initial planning phase when you are determining priorities and overall sentiment.
For the middle Screen, they utilized the adaptable Standard Survey format. While Standard Survey Screens don’t offer the same interactivity and gamification as some of the other MetroQuest Screen options, in some cases they offer the flexibility needed to ask a series of varied multiple choice, checkbox and textbox questions.
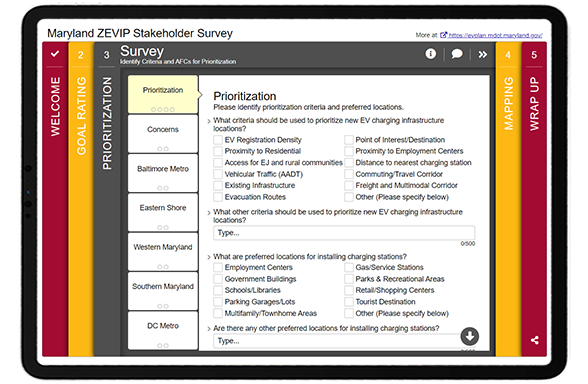
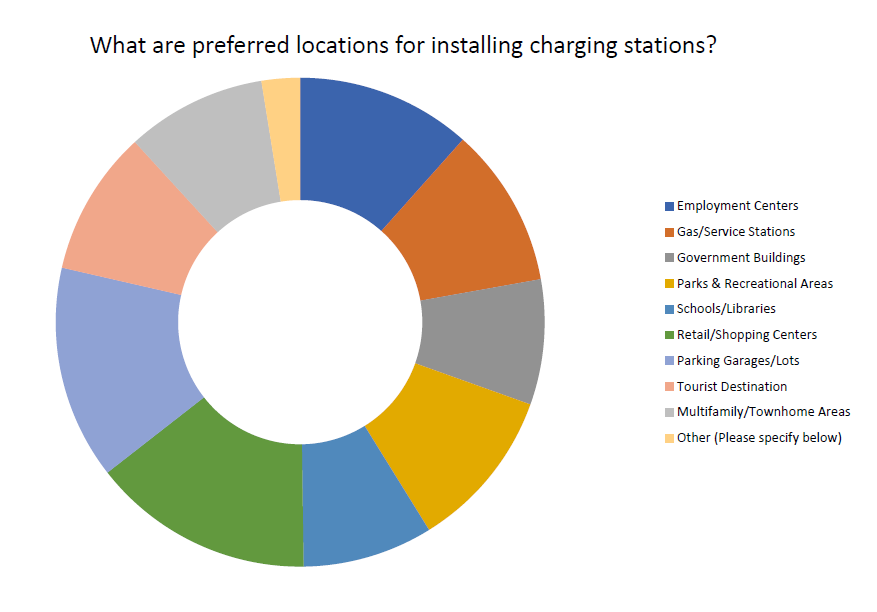
As evidenced here, MDOT and MEA were able to gather a wide variety of input on prioritization criteria, preferred locations for charging stations, concerns, as well as preferred Alternative Fuel Corridors 2 (AFC).
Like many successful MetroQuest surveys, they used a Map Marker Screen where participants could drop pins at optimal locations for EV charging on a Google map. Participants were asked to indicate the type of site and provide additional details.
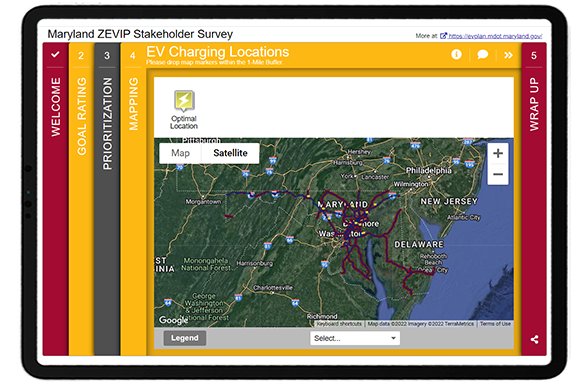
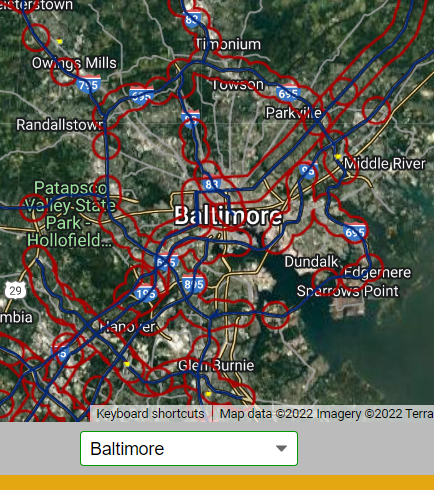
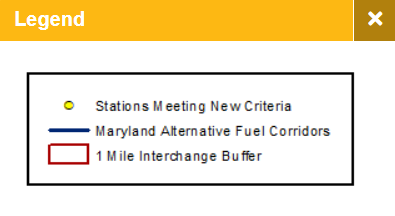 Note the use of a legend to explain the KMZ layer markings and the pre-set location options allowing participants to quickly zoom into popular areas like Baltimore. These features make this exercise easier for participants, especially those taking the survey on their phone and ensures that participants are providing input in the appropriate map areas.
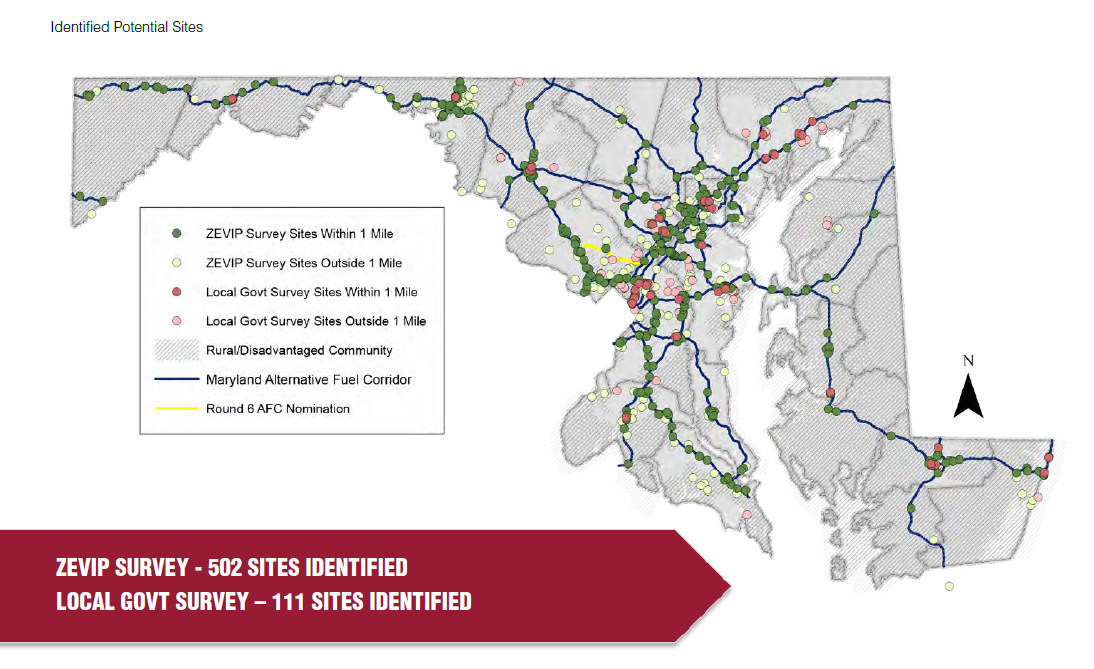
As demonstrated in the above map, the Map Marker Screen provided valuable location-specific data for the team to understand exactly where EV infrastructure is needed. Since the survey remained open after the plan submission, they ended up with over 1,200 dropped pins!
To close, the team kept things relatively simple on the Wrap Up Screen with a question about their affiliation or organization, ZIP code, a place to sign up for email updates and a box for additional comments.
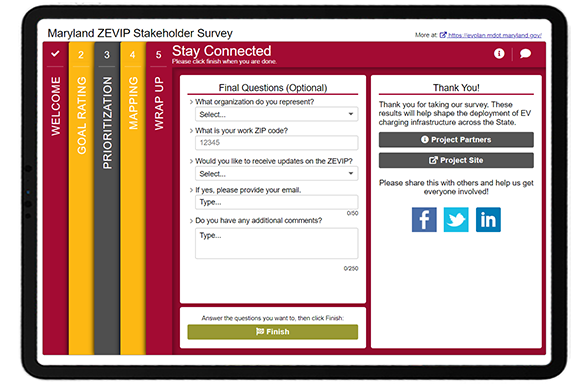
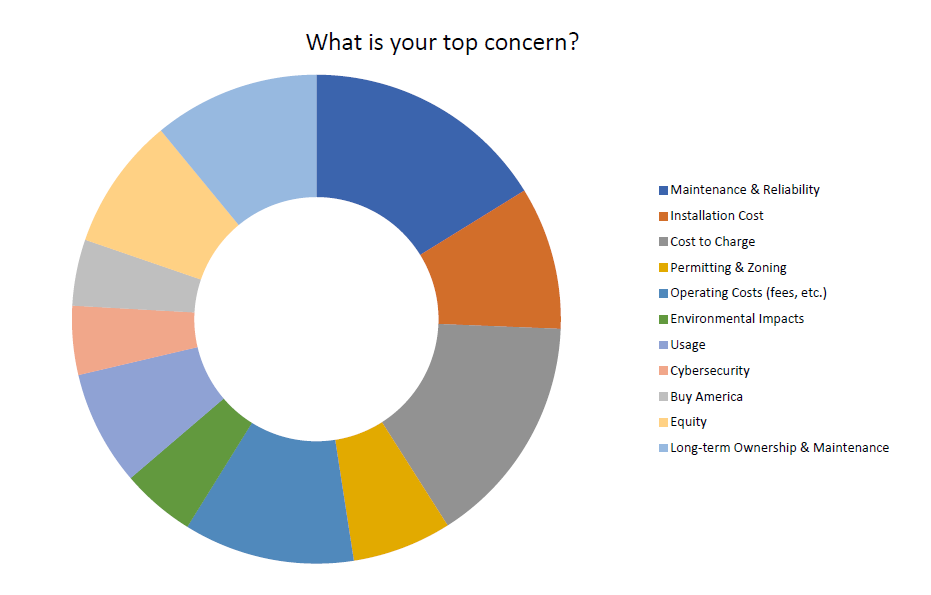
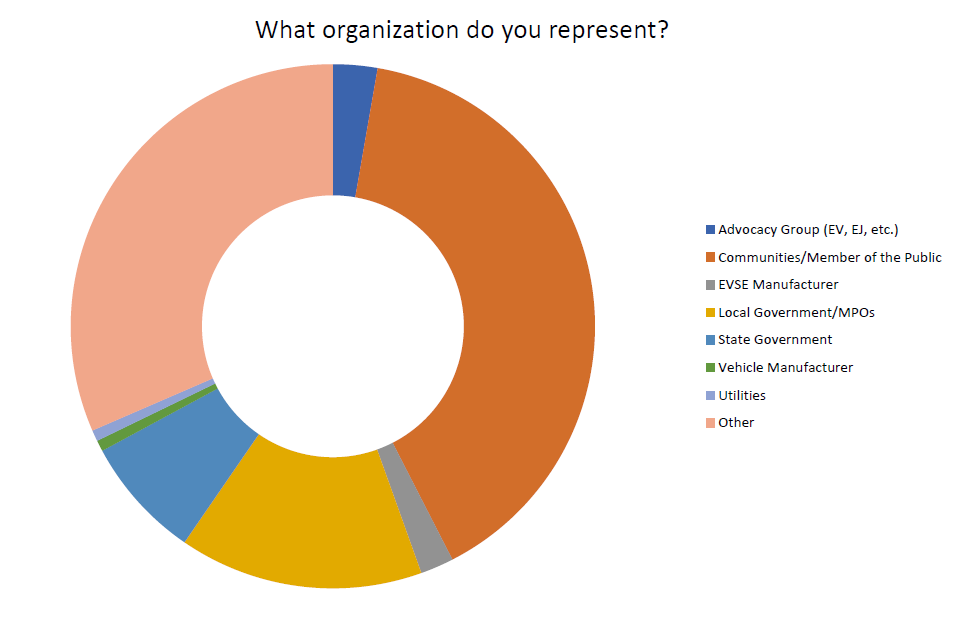
Through questions such as, “what organization do you represent”, the project team had a good sense of who they heard from:
Click through this demo version of the survey to see exactly how MDOT and MEA sought EV input!
5 Tips from the Maryland ZEVIP Survey: A perfect fit for
a Map Marker Screen
- Work with partner agencies to broaden your survey’s reach: We’ve consistently seen surveys garner great response rates thanks to cross-agency coordination. Rather than relying on your organization’s networks alone, contact related agencies across your area and stakeholder organizations. It can help to provide pre-developed messaging and graphics, so they don’t need to put in any effort to spread the word about your survey.
- Make the most of your Welcome Screen: The Welcome Screen sets the tone for your survey. This survey is an excellent example of well-crafted background information that is informative yet concise. The background image is relevant, recognizable and the overall color scheme meshes well with the organization’s logo.
- Consider the Standard Survey Screen when you need to gather varied data: We generally recommend customers try to avoid the Standard Survey Screen due to its lack of context and interactivity, but occasionally, it can be a very helpful addition. This Screen allows you to ask a mix of checkbox, multiple choice and comment questions on a series of tabs. We recommend using a Standard Survey Screen near the end of your survey to keep the initial Screens as engaging as possible.
Tip: boost the appearance by embedding an image in one of the text fields! - Spend time developing a very clear KMZ/KML layer for the Map Marker Screen: This is one of the most intricate and well-implemented KMZ layers we have seen. It clearly shows the routes for alternative fuel corridors and ensures participants know to drop markers within the burgundy-colored one-mile buffer zone. Having a GIS expert at your organization create a quality KML/KMZ layer defining the project or area for input is worthwhile. No fret, it is easy to create this file even if you aren’t an expert with GIS files—our support site has a step-by-step guide (search “KMZ”).
- Make use of the additional features to increase the ease of the mapping exercise: If you are using a KMZ/KML layer in your map, it’s integral to include a clearly labeled legend to guide participants. Additionally, for statewide projects or initiatives covering a large geographic area, adding location dropdowns to zoom into sub-locations speeds up the exercise so participants can navigate to certain cities or sites quickly.
Thank you to the MDOT and MEA team for the opportunity to highlight this unique and well-designed survey!
We are delighted that we could feature another excellent EV survey! If you are a MetroQuest customer, keep an eye out for our EV survey template launching in October – you can use it as a base for your next EV survey.
For more great tips on how to make the most out of MetroQuest reach out for more information or, if you are an existing subscriber, contact our Director of Client Services, Norma Hogan.
To learn more about how agencies like Tennessee DOT and Memphis MPO coordinate their public engagement efforts, check out our most recent webinar!
Exploring TDOT and Memphis MPO’s
Next Level Public Involvement Strategy
In this webinar, we highlighted how local and state agencies are working together to engage the broader Tennessee community with a deep dive into the Memphis MPO’s Regional Transportation Plan, Moving Together 2050!
Sources:
-
- 2019 and 2020 surveys were developed and launched with our previous software version, MetroQuest Classic. The design and some features will vary.
- AFC’s are national corridors designated for alternative fueling and charging infrastructure such as EV charging, compressed natural gas, liquid natural gas and hydrogen.