A New Window into Your Public Input
The MetroQuest development team has been busy this summer making many improvements to our community engagement software platform. We’ve been listening to the needs of our clients and over the past few months we’ve completely revamped the way our clients get the results of their public engagement.
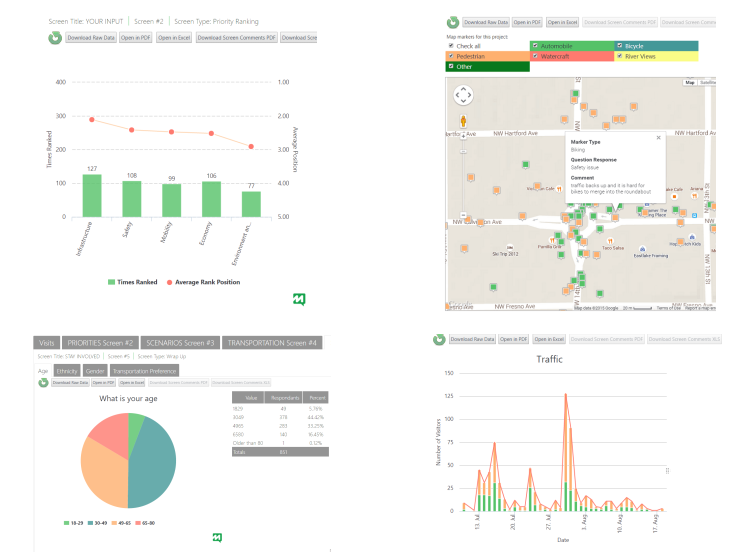
Introducing MetroQuest Insights, an intuitive dashboard to monitor, evaluate, report and export your public input. MetroQuest Insights allows you to visualize the results through colorful graphs and maps, summarize the findings, break the results down by demographic group and even export the data in specially formatted spreadsheets to allow maximum flexibility.
With MetroQuest Insights you can:
Monitor: Stay on top of traffic with an intuitive dashboard
- Monitor public participation in real-time
- Breakdown the results by demographic group
- Compare your web, mobile and kiosk traffic
Evaluate: Easily explore public input
- View visitor preferences, ranking and ratings in real-time
- See graphs, maps, tables and comments tailored for each screen
- Easily identify data – no more complex variable names
Report: Get instant visualizations
- View maps and graphs of results on-screen
- Customize your visualizations to show only the most relevant data
- Get colorful graphics suitable for cutting and pasting
Export: Dive into detailed data for final reports
- Create and download customized tables and graphs
- Download a complete table of all your results for detailed analysis
We think you’re going to love MetroQuest Insights. You’ll save time and money and dive deeper into your public input than ever before. MetroQuest Insights is ready for your next project!
![[CONFERENCE] “Going Viral – 8 Best Practices in Online Engagement” – Highlights from IAP2 2015](https://metroquest.com/wp-content/uploads/older-woman-with-tablet-for-public-engagement.jpg)
![[PRODUCT] Announcing MetroQuest Insights](https://metroquest.com/wp-content/uploads/guy-in-office-with-MetroQuest-anylitics-screen-on-his-computer.jpg)