[SURVEY OF THE MONTH] Seeking Input on Transportation Improvements in York County, PA

The Survey of the Month series is a monthly blog where we highlight the extraordinary work our customers are doing! We feature well-designed surveys and share takeaways that are relevant for anyone interested in making the most out of online engagement using MetroQuest’s survey platform. To see more in the series, visit the blogs here.
This month, we are featuring a Transportation Improvement Program (TIP) survey! The York Area Metropolitan Planning Organization (YAMPO) designed a highly interactive five-minute survey that gathered over 9,300 unique data points and provided insightful data to inform future transportation improvements. Read on to see how measurable data will help inform future transportation investments in York County!
What’s the story? Identifying Transportation Investment Opportunities
Located in south-central Pennsylvania, York County is a historic area with a population of around 450,000 people. 1
The TIP is updated every two years and proposes how transportation investments should be spent over the next four or more years. Often, TIP surveys will seek input on a list of projects to determine how funding should be spent. Investment decisions are then agreed upon by YAMPO, a decision-making body for all federally funded transportation projects in York County.
In this case, rather than asking for input on certain projects, YAMPO opted to gather input on project types for future TIPs.
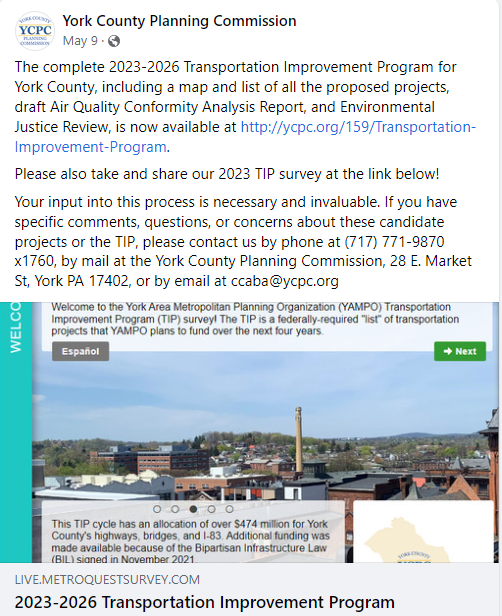
Survey promotion on Facebook
To drive traffic to the survey, the project team used Facebook advertisements and posts as their primary outreach method – a strategy that always helps reach intended audiences. The project team also shared information about the survey with County Commissioners and other committees during the public comment period. Additionally, they put up printed posters in areas that were less likely to be reached digitally.
Diverse outreach and an emphasis on social media led to YAMPO receiving over 600 survey responses!
For more information on the York County TIP, visit the project website.
Anatomy of a TIP Survey: Quantifiable Questions Yield Clear Priorities
As mentioned earlier, this survey used a different approach for TIP feedback, focusing on community priorities and perspectives rather than prioritizing proposed projects.
Open this survey demo link to follow along as we go through each survey Screen!
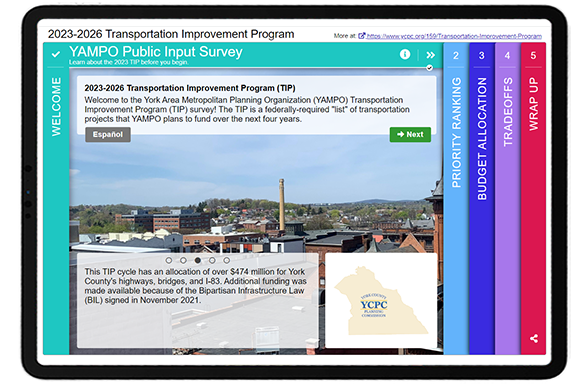
Screen 1: Welcome
The Welcome Screen concisely explains the purpose of the survey, what a TIP is, and how input will benefit residents. As with any survey featuring an additional language, the Spanish survey is linked on the top left so participants can navigate to that version, if preferred.
Screen 2: Priority Ranking
As with many quality MetroQuest surveys, the survey starts with the Priority Ranking Screen, collecting input on eight investment priorities to quantifiably identify what matters most to participants.
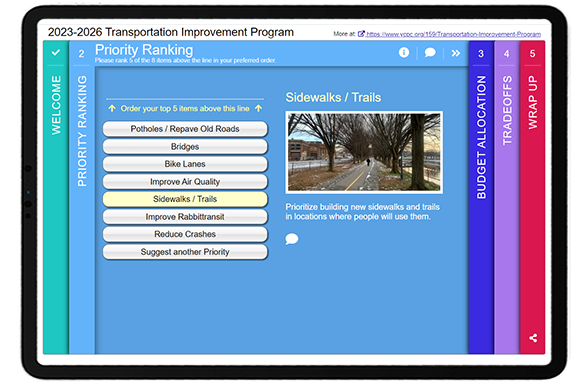
From the graph below, it’s clear that the community would like to see potholes and old roads repaved, with 37 percent of respondents setting it as a top priority.
Participants also had the option to write “something else” and rank it as a priority – an excellent idea to allow residents to share their unique ideas.

Bar graph indicating the percentage of respondents that selected each item as a top priority.
Screen 3: Budget Allocation
Continuing with a similar theme, the third Screen asks participants to allocate budget to the same eight topics covered in the Priority Ranking screen. Rather than ranking each item comparatively, this game allows each participant to allocate coins worth either one point or ten points. Participants drag and drop each coin into a category to allocate the budget. This fun exercise is a great option if you are seeking input on investments as it makes the respondent consider how they would invest funds and demonstrates that budgets are finite.
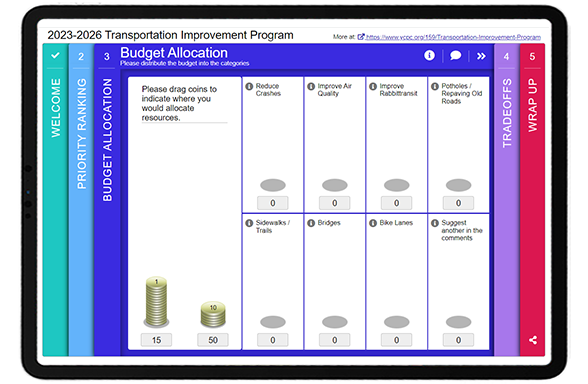
The results of this Screen reconfirmed the findings from the initial Priority Ranking exercise, with the same three improvements coming out on top again: potholes/repave old roads, bridges and reduce crashes. This data provided a very definite conclusion on what matters most to the community and what types of projects should be funded.
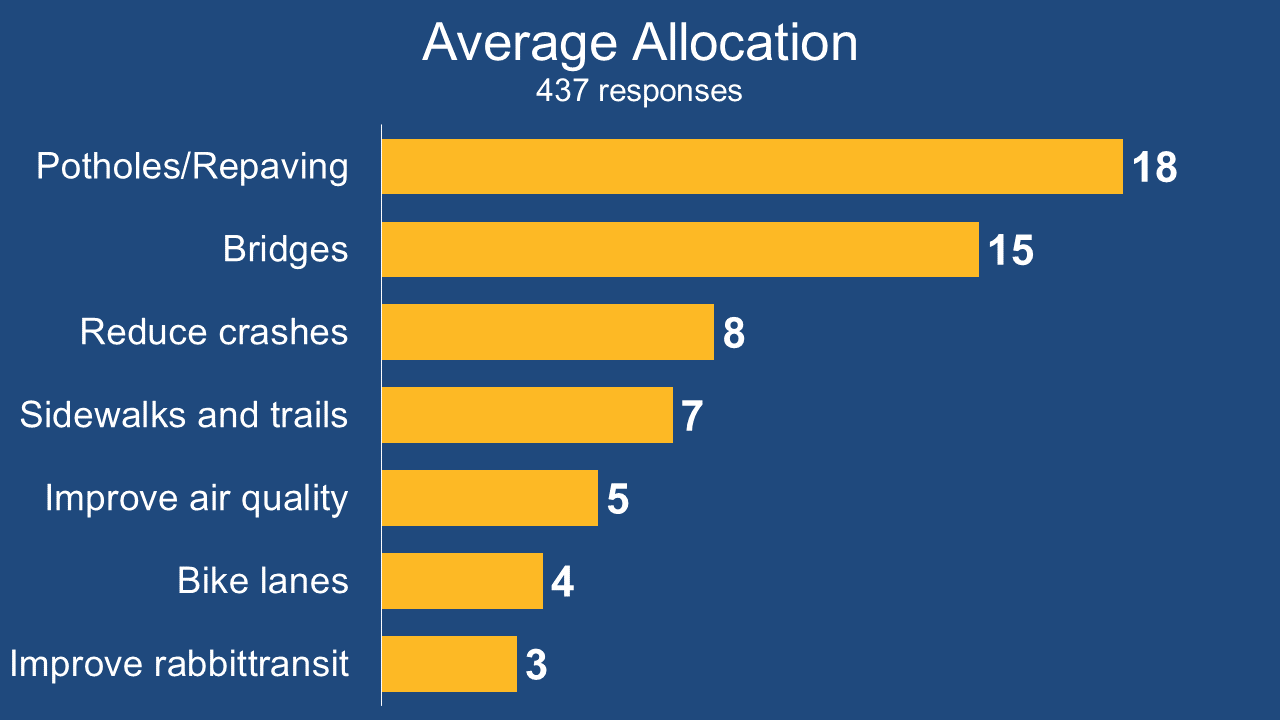
Bar graph indicating the average total value of coins allocated to each category.
Screen 4: Tradeoffs
The Tradeoffs Screen is an excellent choice if you want participants to compare two circumstances against each other. Respondents go through a set of questions and can indicate which one out of each set of two they prefer.
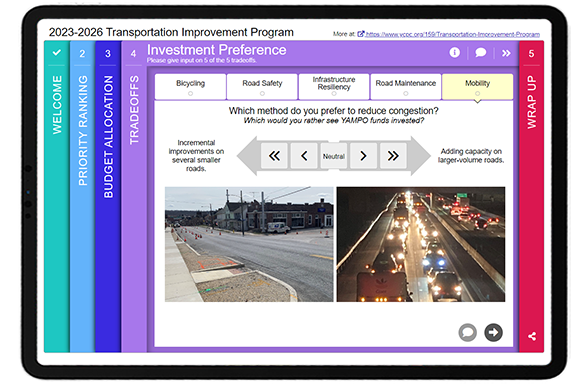
YAMPO asked participants to evaluate five scenarios. For instance, comparing the scale of projects:
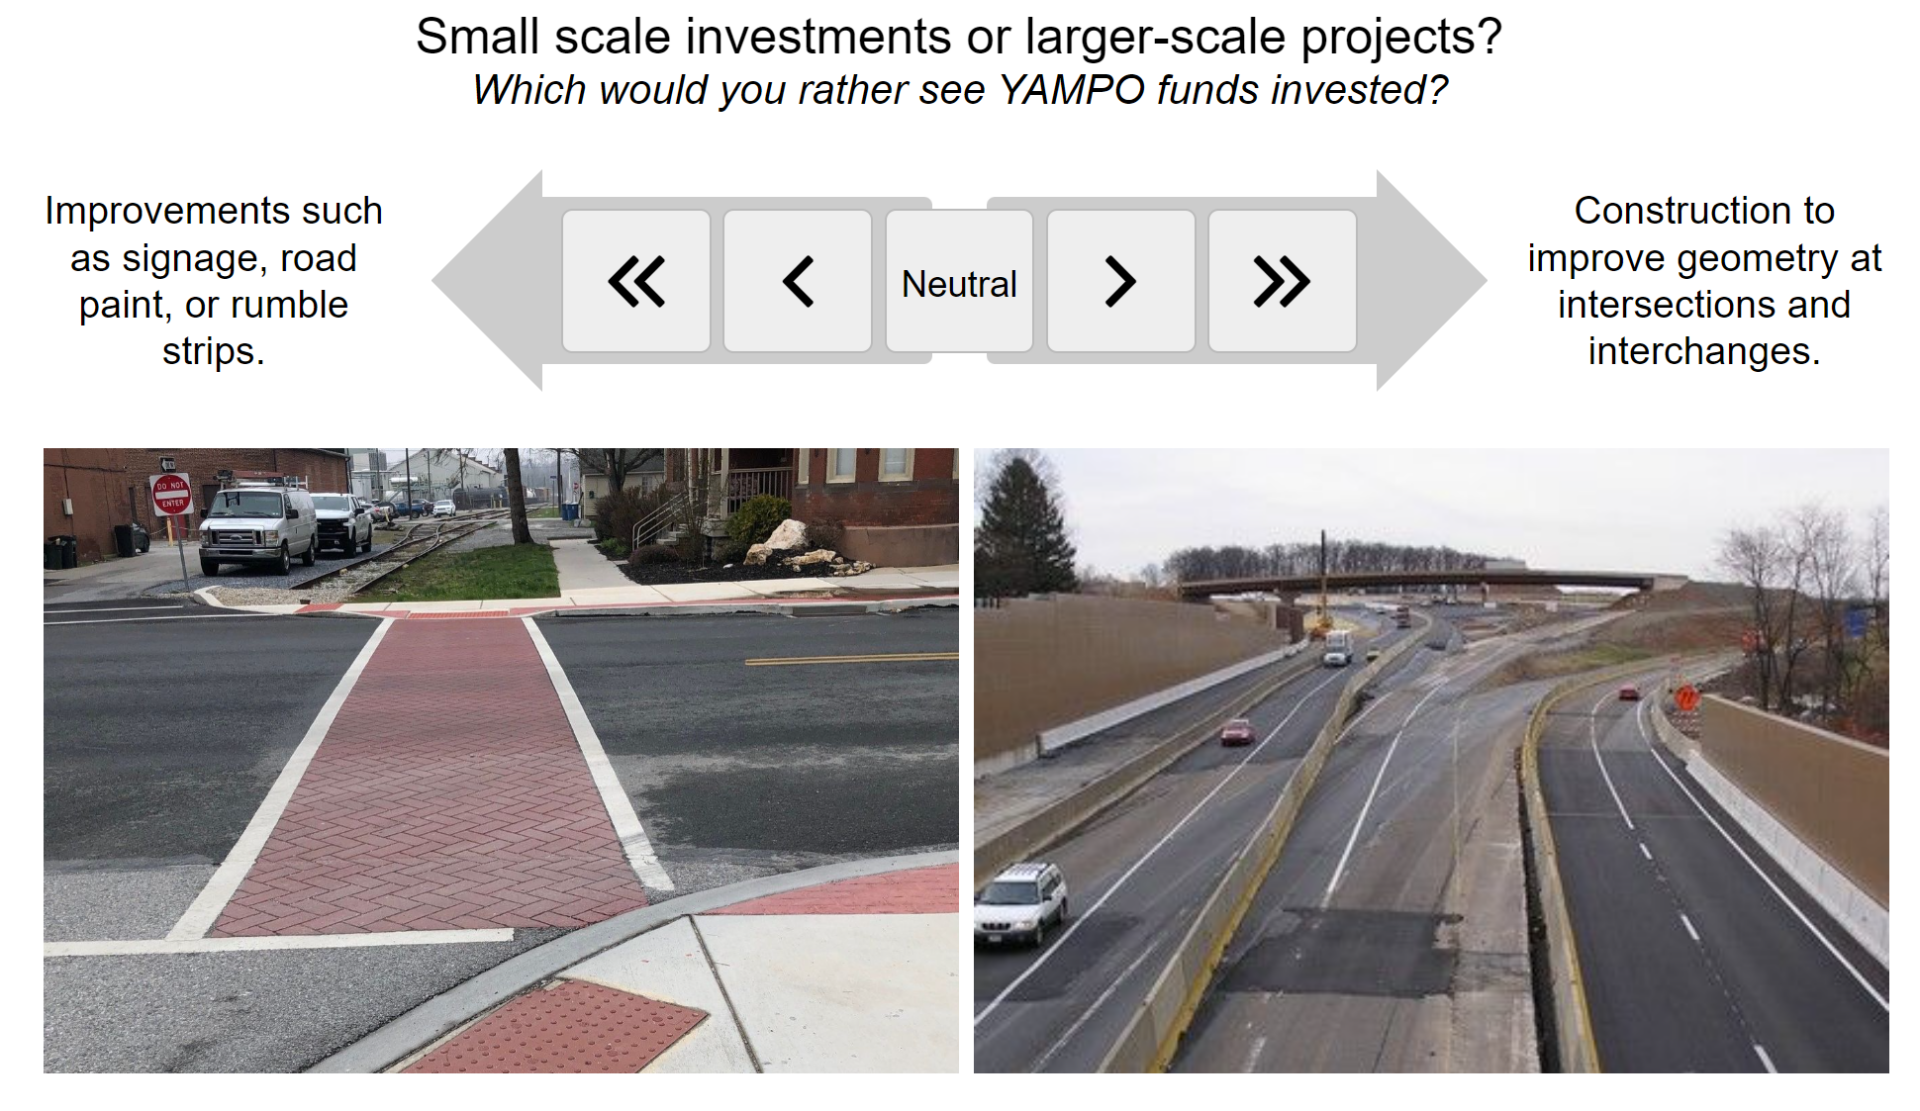
Example scenario on Tradeoff Screen, asking whether participants prefer small scale investments such as visual improvements, or larger scale projects such as geometric improvements at intersections/interchanges.
In response to the tradeoff above, 67 percent of respondents indicated they preferred construction to improve intersection and interchange geometry rather than improvements to signate, road paint and rumble strips:
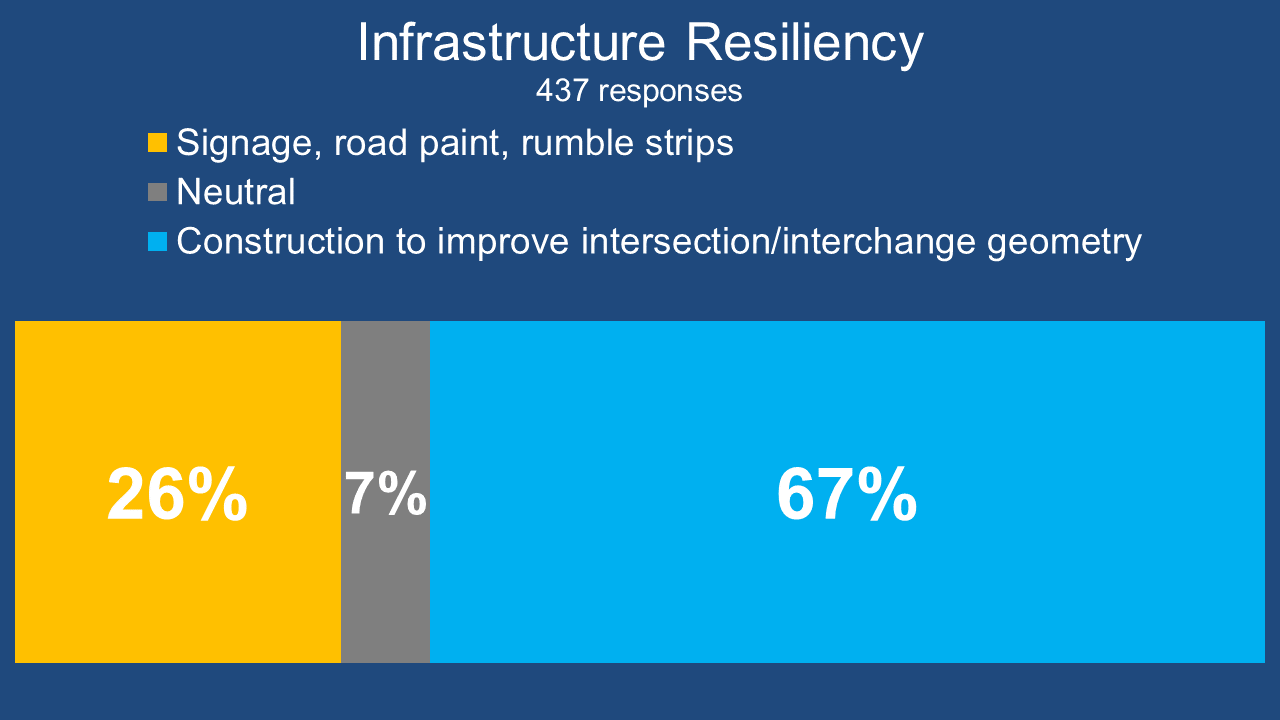
Segmented bar graph showing that 67 percent of participants preferred construction to improve intersection/interchange geometry.
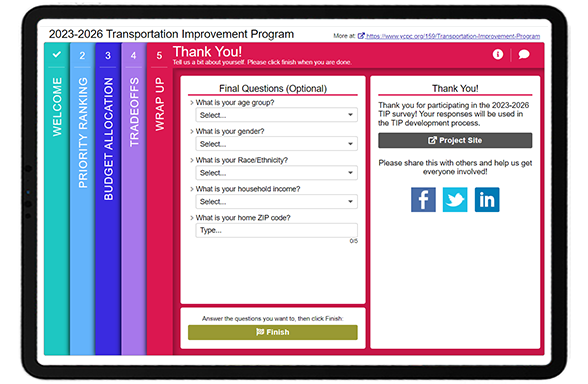
Screen 5: Wrap Up
On the final Wrap Up Screen, the team kept things simple by asking five demographic questions: quantitative dropdown questions about age, gender, race/ethnicity and income, as well as a spot to enter a ZIP code.
By asking standard demographic questions, they could compare respondent demographics to the median ages, income and ethnicities in the county.
The quantifiable nature of the survey allowed the team to quickly tabulate the results and share them at the MPO Board meeting, with an incredible turnaround time of just four days after the survey closed! This truly exemplifies why it’s so beneficial to collect close-ended data. The emphasis on quantitative questions allowed for an efficient analysis of data, and participants still had many opportunities ![]() throughout the survey to share comments in the comment bubbles.
throughout the survey to share comments in the comment bubbles.
Make sure to check out this demo version of the survey!
5 Tips from York County’s TIP Survey: Simple and Quantifiable Questions
- Significant, long-term projects don’t require complex surveys: It’s logical to think that the broader and more significant the investment, the lengthier the survey needs to be, but that is not usually the case. The York County TIP survey exemplifies how a survey about funding and planning for the next four years didn’t need to be complicated. Rather than requiring the community to evaluate many projects, the team took the opportunity to determine what priorities and improvements matter to residents. This approach ensures that future investments reflect the broader opinions of the community rather than preferences based solely on project location or benefits to certain residents.
- Stick to primarily quantitative questions: We know we are repeating ourselves but collecting quantitative data pays off. As mentioned above, the project team was able to compile results and create a presentation to share at their MPO Board meeting only a few days after the survey closed. Surveys don’t have to interfere with project timelines and can yield insightful findings quickly!
- Consider budgetary Screens for investment-related topics: Our Budget Allocation and Funding Balance Screens put participants in your shoes with regards to your agency budget. Participants are forced to make choices within budgetary constraints to allocate funds as if they were in your situation. These types of questions not only provide a fun exercise but also help the community understand that tradeoffs are necessary when determining how to allocate funds for transportation improvements.
- Digital advertising goes a long way: Predominantly, surveys that garner hundreds or thousands of responses include some form of social media advertising. Facebook, Instagram, Twitter and LinkedIn offer platforms to easily spread the word about the survey, and target who you are hoping to reach geographically or demographically with minimal investment required. It’s never been easier to inform the community about a survey.
- Final questions should take just a few seconds: When someone has spent at least five minutes on a survey, the last thing they want to encounter is a long series of personal questions at the end. Respect your participants’ time by keeping things simple. YAMPO asked about age, gender, race/ethnicity, income and location in just five questions; this is plenty of information to determine if you are reaching a diverse audience and provides various options to cross-tabulate the data to see potential demographic trends.
Thank you to the team at the York County Planning Commission for taking the time to share key details and the survey results/graphics featured in this post! We commend them on this superb survey!
For more great tips on how to make the most out of MetroQuest reach out for more information or, if you are an existing subscriber, contact our Director of Client Services, Norma Hogan.
To learn more about how agencies like Tennessee DOT and Memphis MPO coordinate their public engagement efforts, check out our most recent webinar!

Exploring TDOT and Memphis MPO’s
Next Level Public Involvement Strategy
In this webinar, we highlighted how local and state agencies are working together to engage the broader Tennessee community with a deep dive into the Memphis MPO’s Regional Transportation Plan, Moving Together 2050!
Sources
- 2020 United States Census.