[SURVEY OF THE MONTH] Interactive and Transparent: Rapid Transit Engagement with PlanRVA

The Survey of the Month series is a monthly blog where we highlight the extraordinary work our customers are doing! We feature well-designed surveys and share takeaways that are relevant for anyone interested in making the most out of online engagement using MetroQuest’s survey platform. To see more in the series, visit the blogs here.
This month, we are featuring a project and survey where results were reported back to the community effectively! Hop on board as we learn more about PlanRVA’s West Broad Street Bus Rapid Transit (BRT) Corridor Analysis Survey and discuss some key takeaways from both a survey and reporting standpoint.
PlanRVA’s use of MetroQuest falls under the Virginia Department of Transportation, which holds a license that allows regional planning organizations across Virginia to utilize MetroQuest for their engagement endeavors. Virginia consistently is one of our most active customers, launching nearly 90 MetroQuest-based surveys in 2022! We are thrilled to be featuring this VA-based success story this month.
What’s the story? Actively Engaging Transit Users
PlanRVA, which hosts the Richmond Regional Transportation Planning Organization, brings together communities across the Richmond region to plan and provide essential services, including transportation. In collaboration with the GRTC Transit System, they launched a MetroQuest survey in November 2022 to gather input to inform the potential expansion of the Pulse BRT line west in Henrico County, northwest of Richmond, VA. This rapid transit system provides efficient bus transport via dedicated lanes, center-boarding stations, and platform-level boarding.
The survey remained open for just over one month and received 1,378 responses! This successful response is likely attributed to the strategy the team used to promote the study, detailed below.
Going to the Community
To start, the team developed a Partner Toolkit to share with study partners and stakeholders. This information package made it efficient for organizations to spread the word about the survey on their channels and instantly broadened the survey’s reach.
The second part of their approach was to engage route users where they already are, often twice a day—commuting! This tactic works particularly well with transit projects. Since this survey involved extending a particular route, the project team took advantage of this to engage commuters while they were en route.
Promotional tactics included:
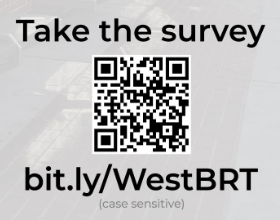
- Survey flyers with QR codes posted around the stations and stops.
- Staff being present during peak hours to interact with transit riders and share information about the survey. They handed out flyers with QR codes to the survey.
While we often discuss how effective social media promotion is, an opportunity to go directly to your audience can significantly boost survey awareness and traction.
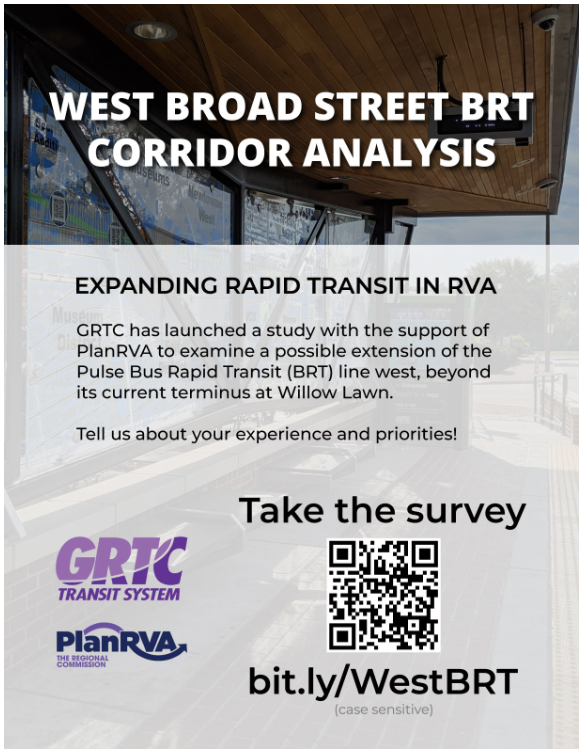
Flyer that was distributed at transit stations.
Circling Back with the Community
The project team did not stop at going to the community for input; they also ensured they came full circle in reporting back to the community. To stay on top of data analysis, the project team regularly reviewed the survey data as it was coming in. It often helps to get a head start on the data analysis while the survey is live, especially as project timelines can often be tight. Since the survey was primarily quantitative, they were able to quickly see trends and summarize the final results in charts and graphs.
The Esri ArcGIS-based project website provided an excellent and interactive format to review project information, results and geographic data. Visuals are front and center, and key highlights are pulled out – allowing readers to skim or read in-depth. The project website includes a detailed summary of the overall process and results. Transparency in survey reporting goes a long way in building community trust! Additional tabs contain more detailed reports, such as a full survey narrative and survey comments listed. They even embedded the demo survey within their site.
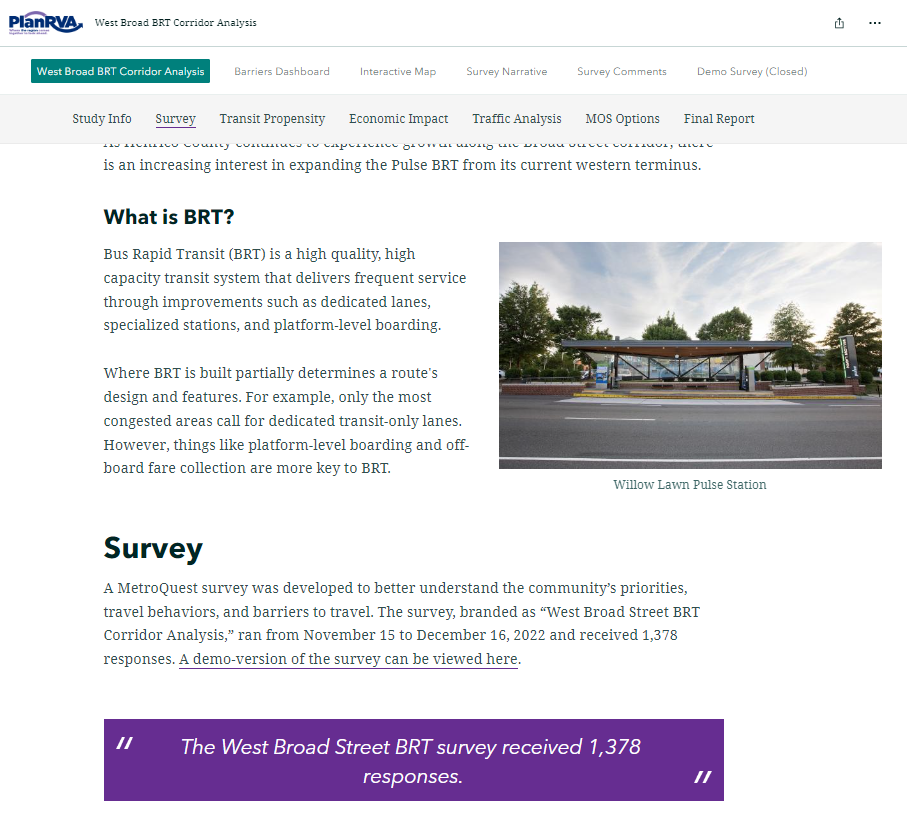
Excerpt from interactive project website.
PlanRVA’s main website homepage also includes a highlight carousel so anyone visiting their website will immediately be aware of the project:
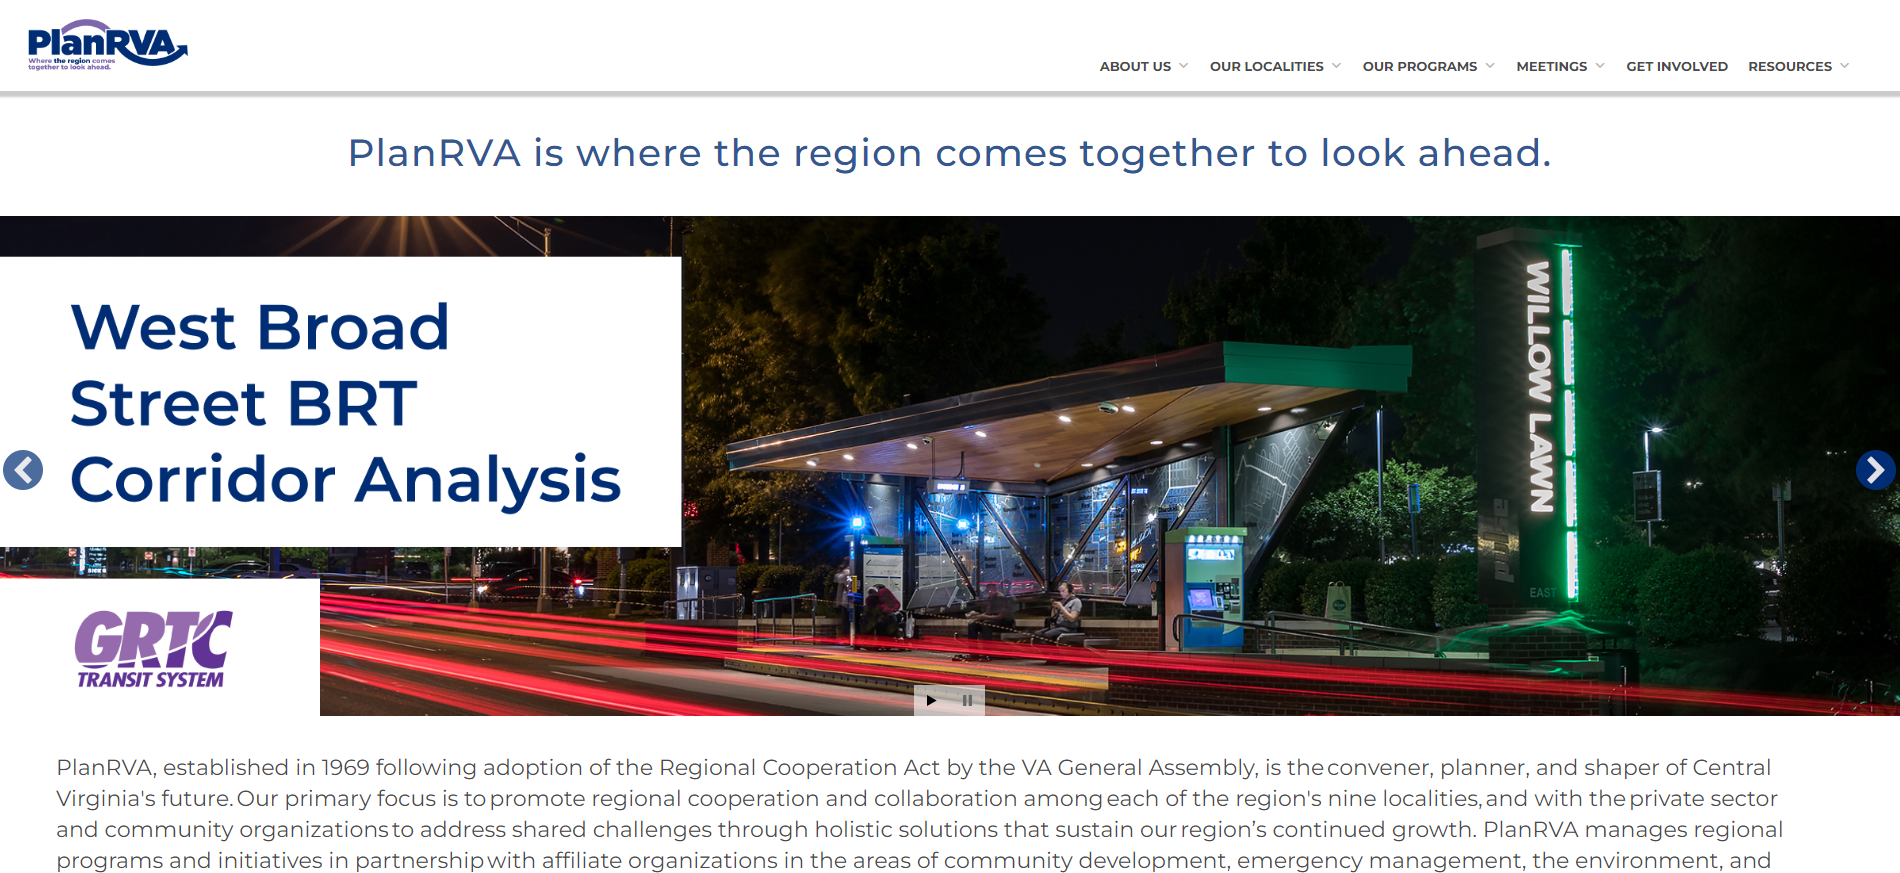
Rotating image carousel on PlanRVA homepage.
Please keep reading as we go into more detail on the survey and how they shared the results in this next section.
Anatomy of a Transit Extension Survey: Simple, Yet Specific
This survey used some of MetroQuest’s most popular screens very effectively. As we always say, simple and visual is best!
Follow along with us by opening the demo survey in a separate tab. Make sure to keep reading until the end where we uncover five key takeaways for your next survey!
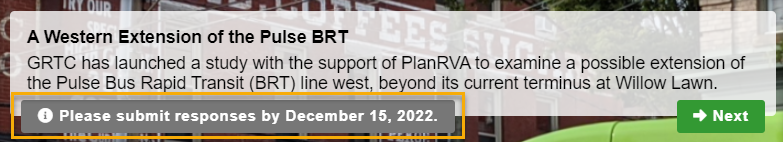
Screen 1: Welcome
The Welcome Screen is well organized in that it doesn’t appear text-heavy but uses the bottom slider to communicate some key details. Note they don’t assume that the participant already knows what a BRT stands for and explains what BRT currently looks like in Henrico County.
Clearly communicating your survey deadline can significantly impact the number of people you reach. This ensures that your community knows when they need to submit their input and that stakeholders aren’t surprised when the survey closes.
Welcome Screen
Tip: During the last day or two of your survey being live, do a final push on social media and advertise that the survey is closing very soon. You might be surprised by how many people complete the survey when they realize it’s almost gone!
Screen 2: Priority Ranking
The introductory Priority Ranking exercise is simple yet engaging as participants are being asked to rank their top four of seven items relating to different transit route improvements.
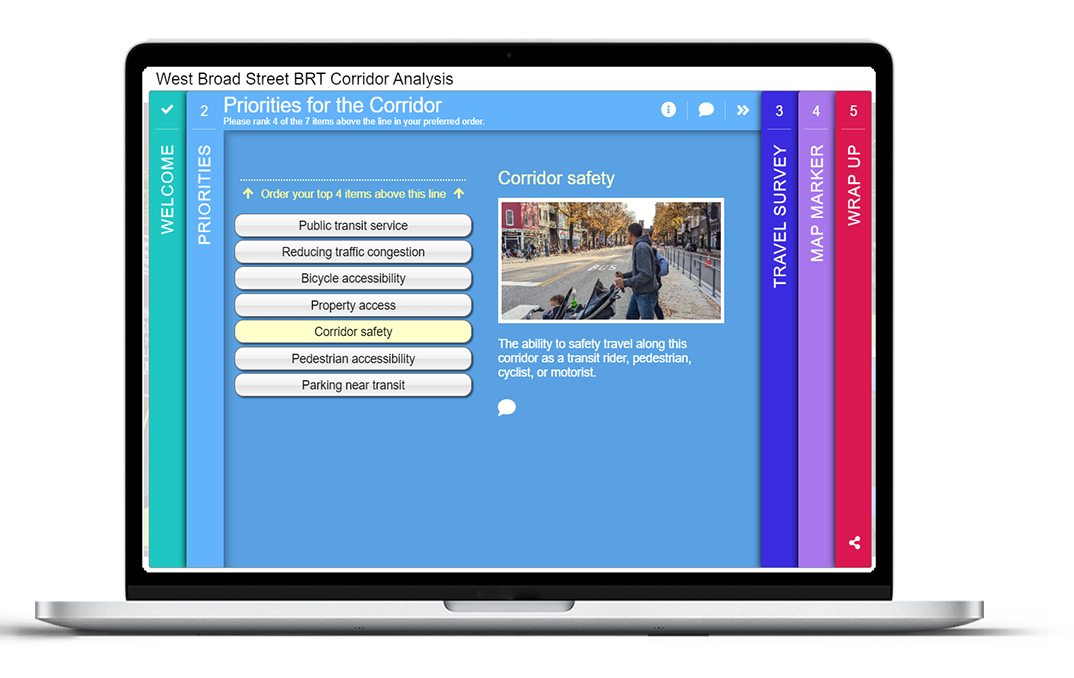
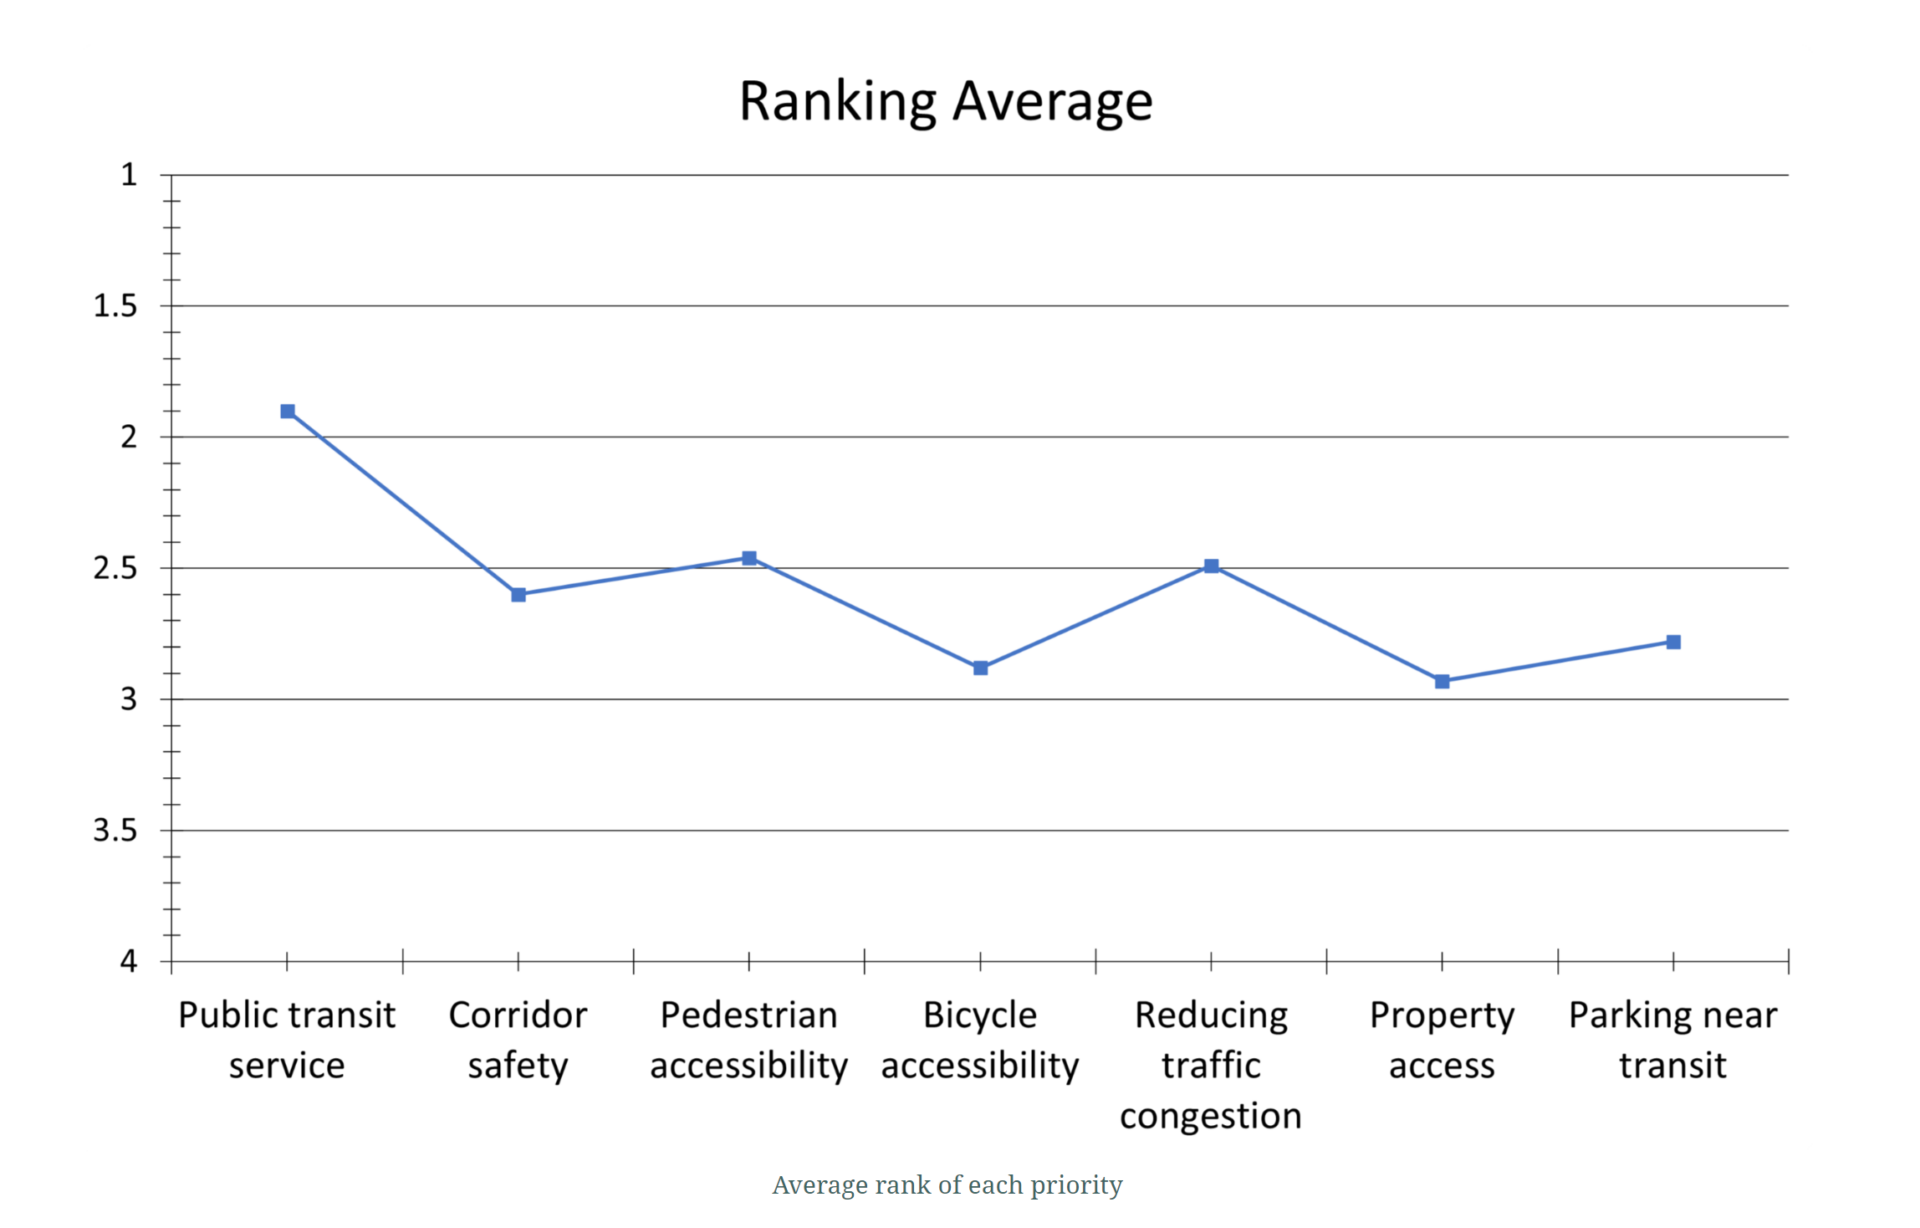
Given the quantitative nature of this activity, the team was able to easily confirm the top priority was public transit service, being ranked first by 527 participants.
Screen 3: Standard Survey
Then, the survey transitions into a form-based component utilizing our flexible Standard Survey Screen. This portion was comprised of four logical sections related to travel:
- How You Travel
- When You Travel
- Travel and Work
- Public Transit
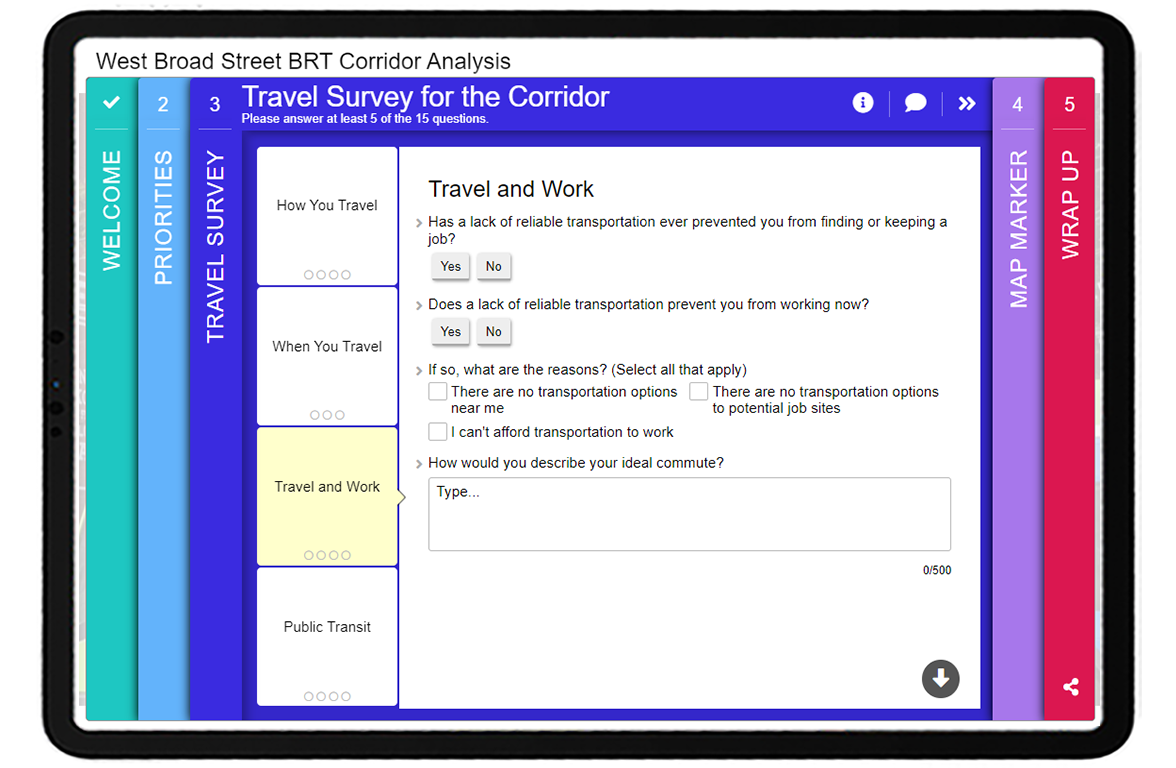
As with the Priority Ranking Screen, this section continued with the quantitative approach, asking a series of checkbox and multiple-choice questions, with a few comment boxes thrown in for collecting specific details and sentiment questions, such as “How would you describe your ideal commute?”.
The questions are concise, clear, and collect easily quantifiable data that is crucial to the project.
Some very important insights came out of this portion of the survey, such as:
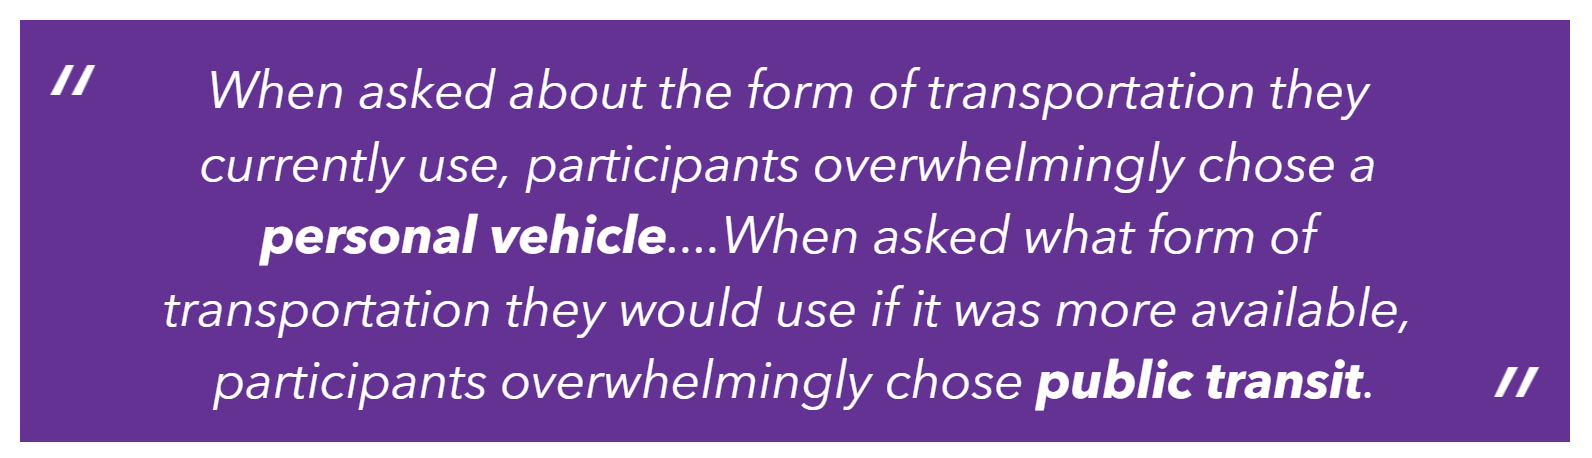
Key insight indicating that if public transportation was more available, participants would use it.
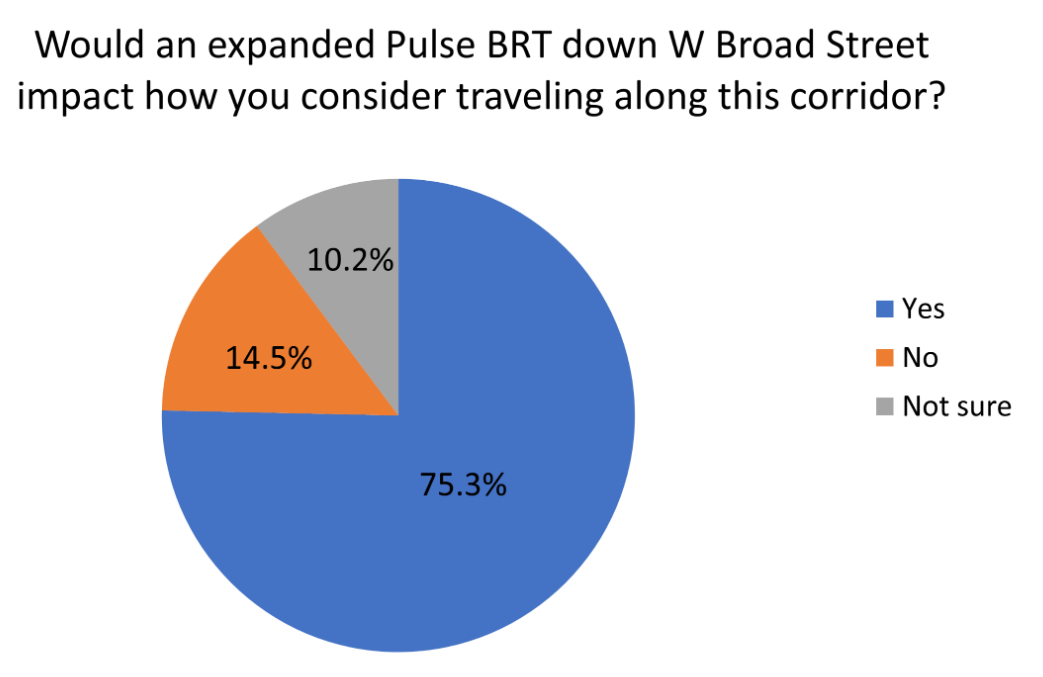
Survey respondents were asked whether this proposed expansion would impact their travel choices:
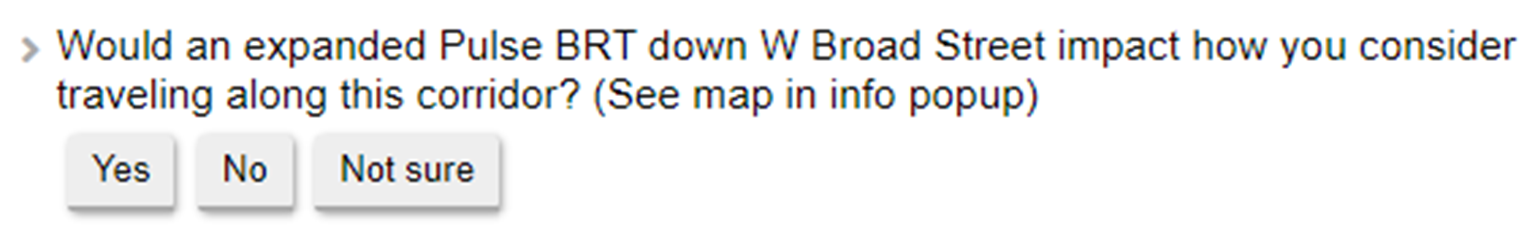
By asking this question, the project team could clearly determine overall public opinion on the project and in the end, the majority (over 75%) said “Yes”!
Screen 4: Map Marker
As with almost every transportation or transit related MetroQuest survey, they asked participants to drop markers on a map.
Several components of this Map Marker Screen were set up perfectly, including:
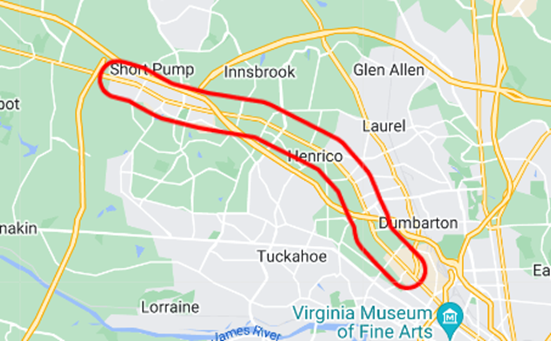
A clear project boundary and location using a KMZ/KML layer:
Specific markers prompting your participant to provide input:
![]()
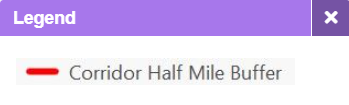
A simple yet important legend:
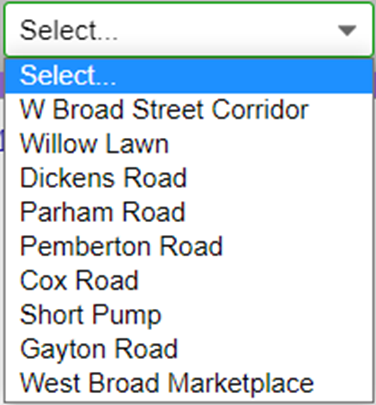
A dropdown list, automatically zooming the map into specific areas:
All of this culminated in over 3,600 data points for transportation barriers encountered. MetroQuest offers a map showcasing results but, in this case, the team uploaded the raw data into their own GIS software.
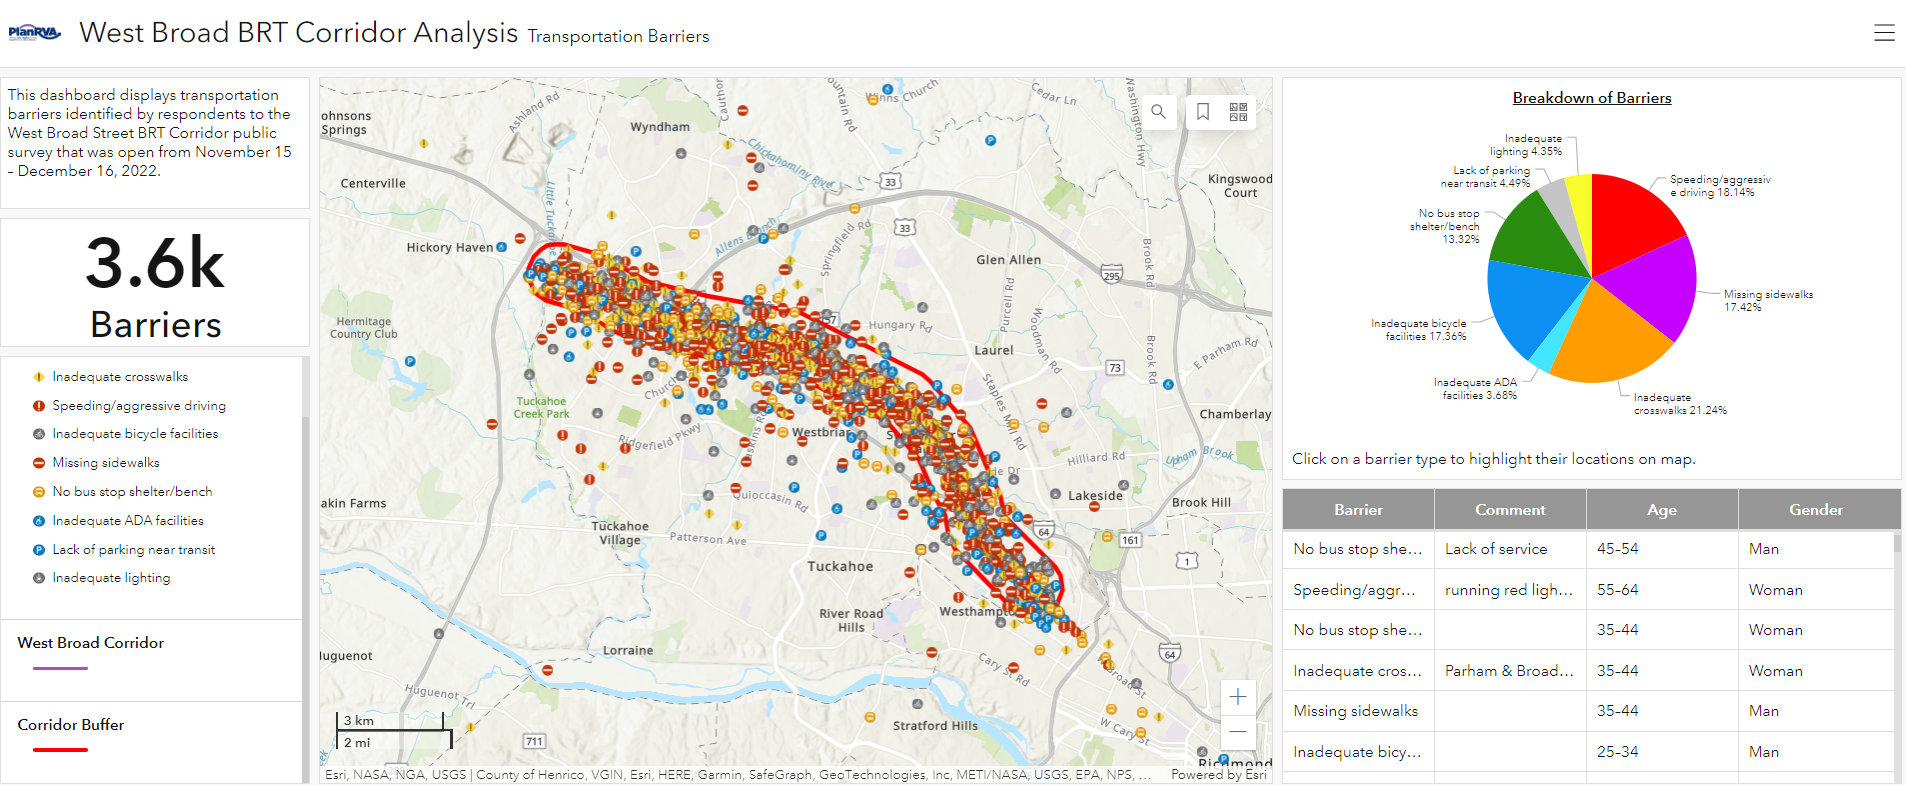
Interactive barrier dashboard showing markers participants dropped, a pie chart automatically adjusts as you zoom in and out on different areas of the map and you can click on a barrier type to zoom into the map. It also shows the age and gender of those who dropped the marker.
Make sure to check out the interactive dashboard map!
Screen 5: Wrap Up
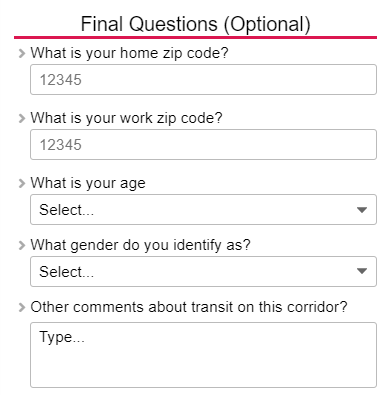
The final Wrap Up Screen remained simple, with five total questions:
- Home ZIP code
- Work ZIP code
- Age
- Gender identity
- Additional comments
From this, the team could understand who they heard from and whether they reached residents or stakeholders proportionally around the project boundary, as detailed in the following graphics.
5 Tips from the West Broad Street BRT Corridor Analysis Survey:
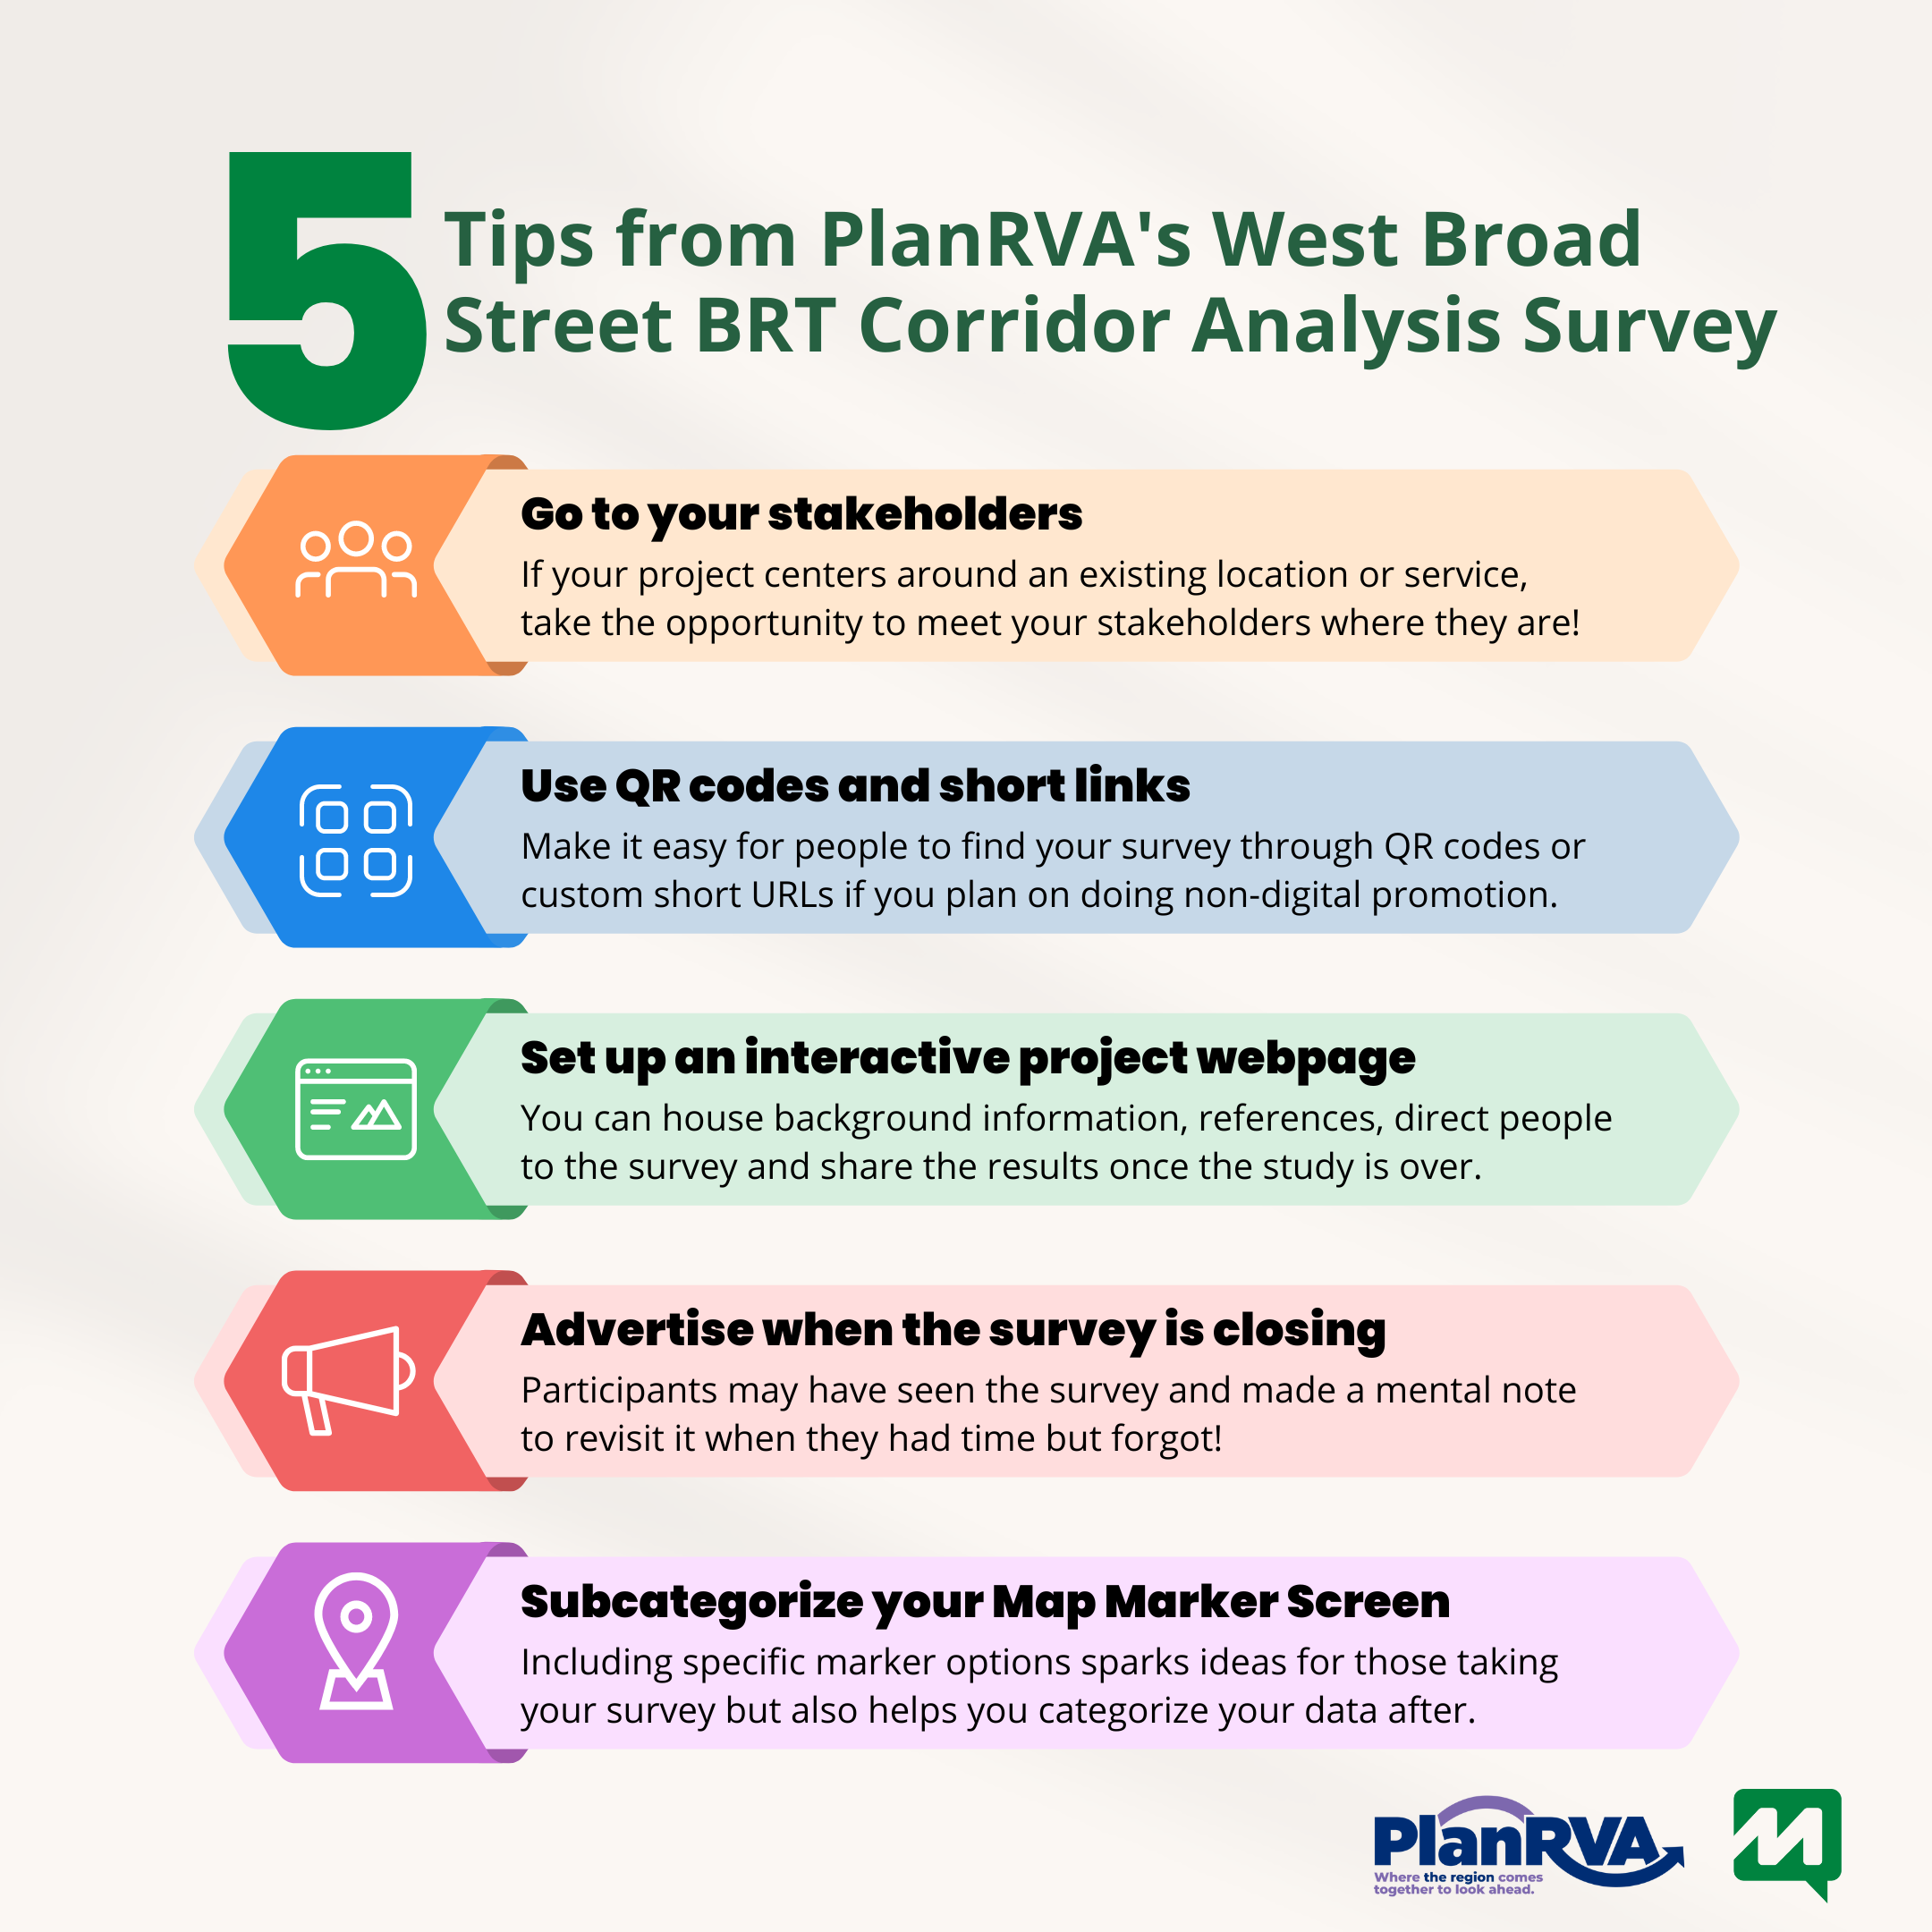
We could focus on many takeaways, but here are our top five!
- GO to your stakeholders: If your project centers around an existing location or service, take the opportunity to meet your stakeholders where they are! In this case, advertising on and around the transit stations was a great way to intercept commuters. Keep in mind not everyone wants to be bothered when they are busy. Wear identifiable organization-branded clothing if you are handing out flyers or information in person. Treats and freebies always help; if you have a booth, consider giving away some swag or complementary beverages to entice commuters to briefly stop and check out the details.
 Use QR codes and short links for quick survey access: In line with going to your stakeholders, some of this direct engagement may require non-digital promotion such as posters, flyers or billboards. Make it easy for people to find your survey through QR codes or custom short URLs.
- Set up an interactive project webpage and use it to re-engage post-survey: Every project can benefit from its own project website or a dedicated section on your organization’s website. A project webpage can house background information, reference documents, direct people to the survey and provide a place to share the results once the study is over. Additionally, project webpages usually include somewhere to sign-up to receive email updates. Once you have some results to share, re-engage survey participants and share what you heard: consider creating some content and visuals with the results that are simple and interactive.
- Advertise when the survey is closing: This is a major yet often overlooked step. By advertising when the survey will close, you communicate a timeline, and participants will be more likely to take the survey with a deadline. It’s imperative to communicate this date in the days before the survey is set to close. Often, participants may have initially seen the survey and made a mental note to revisit it when they had time but forgot. Plus, deadlines help with any procrastination!
- Subcategorize your Map Marker Screen: There are endless icons and options to customize the markers on your Map Marker Screen. The less brainstorming required for participants, the better. Including specific marker options, such as those PlanRVA used for this survey, not only sparks ideas for those taking your survey but also helps you categorize your data after.
We are very appreciative of the team at PlanRVA for the opportunity to showcase this survey. It is clear they put significant time and effort into designing this survey, their project website and reporting on the results.
Once again, make sure to check out the project website and demo survey to see for yourself how interactive and engaging they are!
For more great tips on how to make the most out of MetroQuest, reach out for more information or, if you are an existing subscriber, contact our Manager of Client Services Team, Woo-Ree Cho.
Download Our New VPI Checklist!