[SURVEY OF THE MONTH] Walk, Bike, Ride, Leb – Planning Safe and Connected Routes in Lebanon, NH

The Survey of the Month series is a monthly blog where we highlight the extraordinary work our customers are doing! We feature well-designed surveys and share relevant takeaways for anyone interested in making the most out of online engagement using MetroQuest’s survey platform. To see more in the series, visit the blogs here.
Continuing with our active transportation theme from last month, we are featuring a succinctly designed survey developed by the Upper Valley Lake Sunapee Regional Planning Commission (UVLSRPC). UVLSRPC is one of nine regional planning commissions with access to the New Hampshire Department of Transportation (NHDOT) MetroQuest subscription.
The survey is concise and simple, resulting in it effectively engaging hundreds. Further, the project team presented the project background and survey findings very interactively. So, let’s get into it!
What’s the story? Walk, Bike, Ride, Leb – Planning for Active Transportation
Walk, Bike, Ride, Leb is a planning initiative in Lebanon, New Hampshire, with the goal of creating a safe, comfortable, and connected walking and bicycling network.
The UVLSRPC, in conjunction with the City of Lebanon, developed the Walk, Bike, Ride, Leb Survey, which launched in early 2022. The MetroQuest survey was open for input for approximately one month and engaged over 400* people to determine where pedestrian and cycling infrastructure could benefit from improvement.
*As of the 2020 Census, Lebanon, NH had a population of 14,282. Reaching over 400 people on the survey ensured the project team heard from a representative portion of the community, especially since 90 percent of survey participants stated they live or work in Lebanon.
Evidently, the community was very interested in this effort, as over half of those who initially visited (viewed) the survey provided input, as shown in the graphic below.
Survey participation rates can vary, but if you design a short, simple survey and promote it to the right audience, you can see great participation levels. In most cases, MetroQuest surveys see much higher participation rates compared to other more standard online survey tools due to our highly engaging, gamified activities.
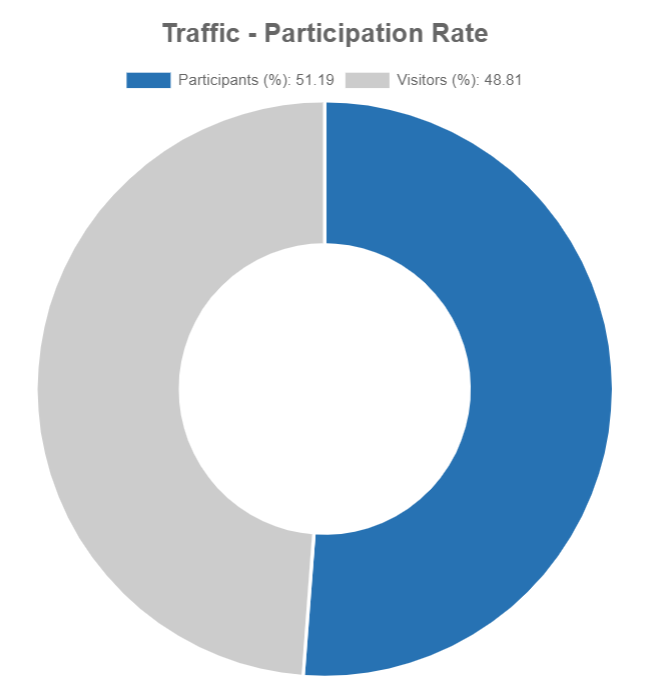
Participation rate data showing that over 51% of people who visited the survey completed at least a portion. This is an excellent rate, showing the community was very engaged with the project.
For this blog, we will dive into what led to this engaged community response! We will share how the project team successfully communicated about the initiative, and how they reported feedback following the survey.
Project Branding
As we often see with successful planning and engagement initiatives, a strong brand that can be carried through multiple planning phases is instrumental in gaining public traction.
Here, the team developed a fun and inviting project logo (bottom left of graphic) and designed the other project visuals to follow the same cohesive color tone and style.
Project Resources and Webpage
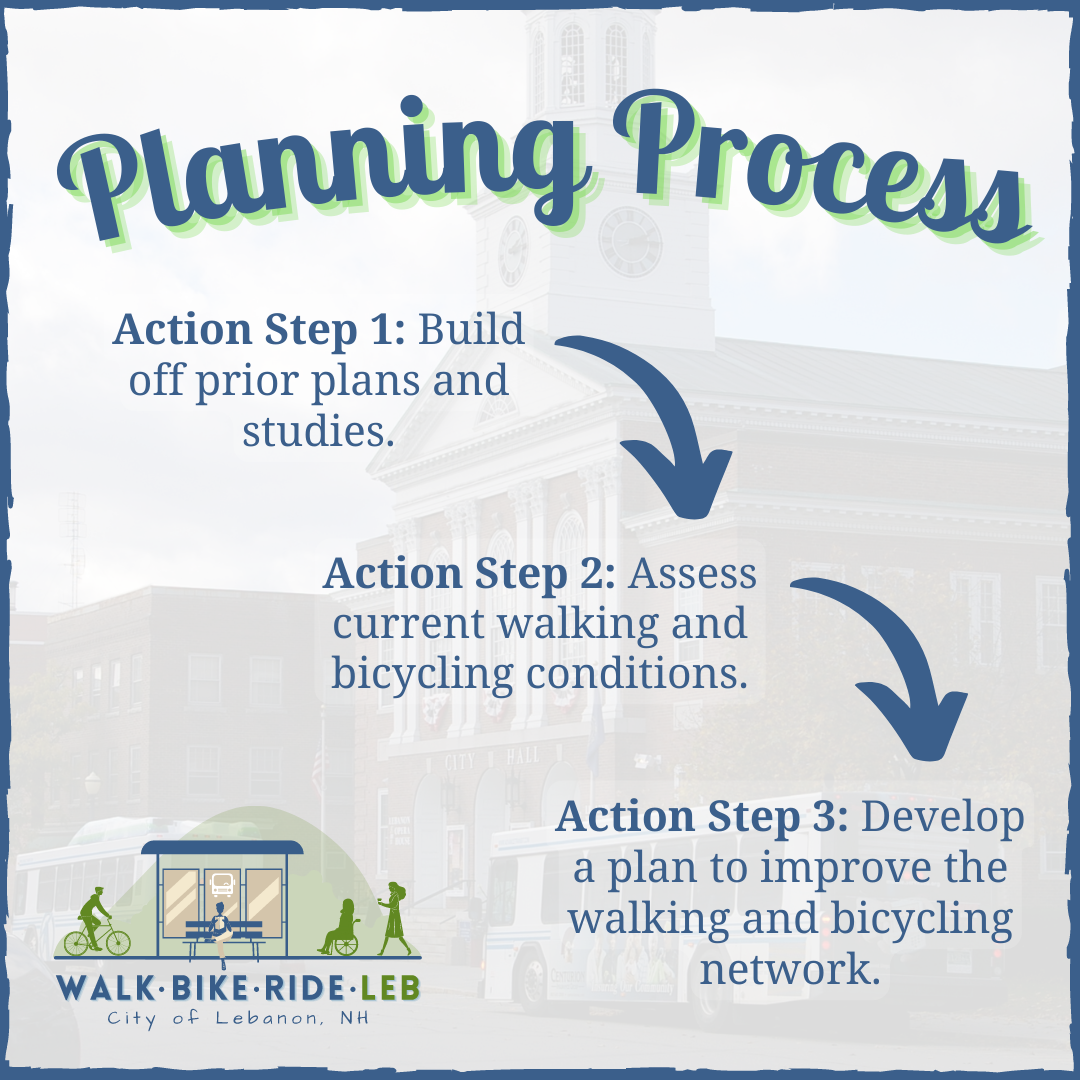
To outline the Walk, Bike, Ride, Leb planning process, the project team utilized an ArcGIS StoryMap, much like the one we saw from PlanRVA here.
This StoryMap allowed the project team to lay out the entire planning and engagement process in a digitally interactive way, as is evident with the project timeline “infogram” displayed below.
The page takes visitors through the project story, including photos and maps of the area and existing infrastructure. Whether stakeholders wanted to gather some brief background on the project or read through it in detail, they could find an array of information from this interactive page.
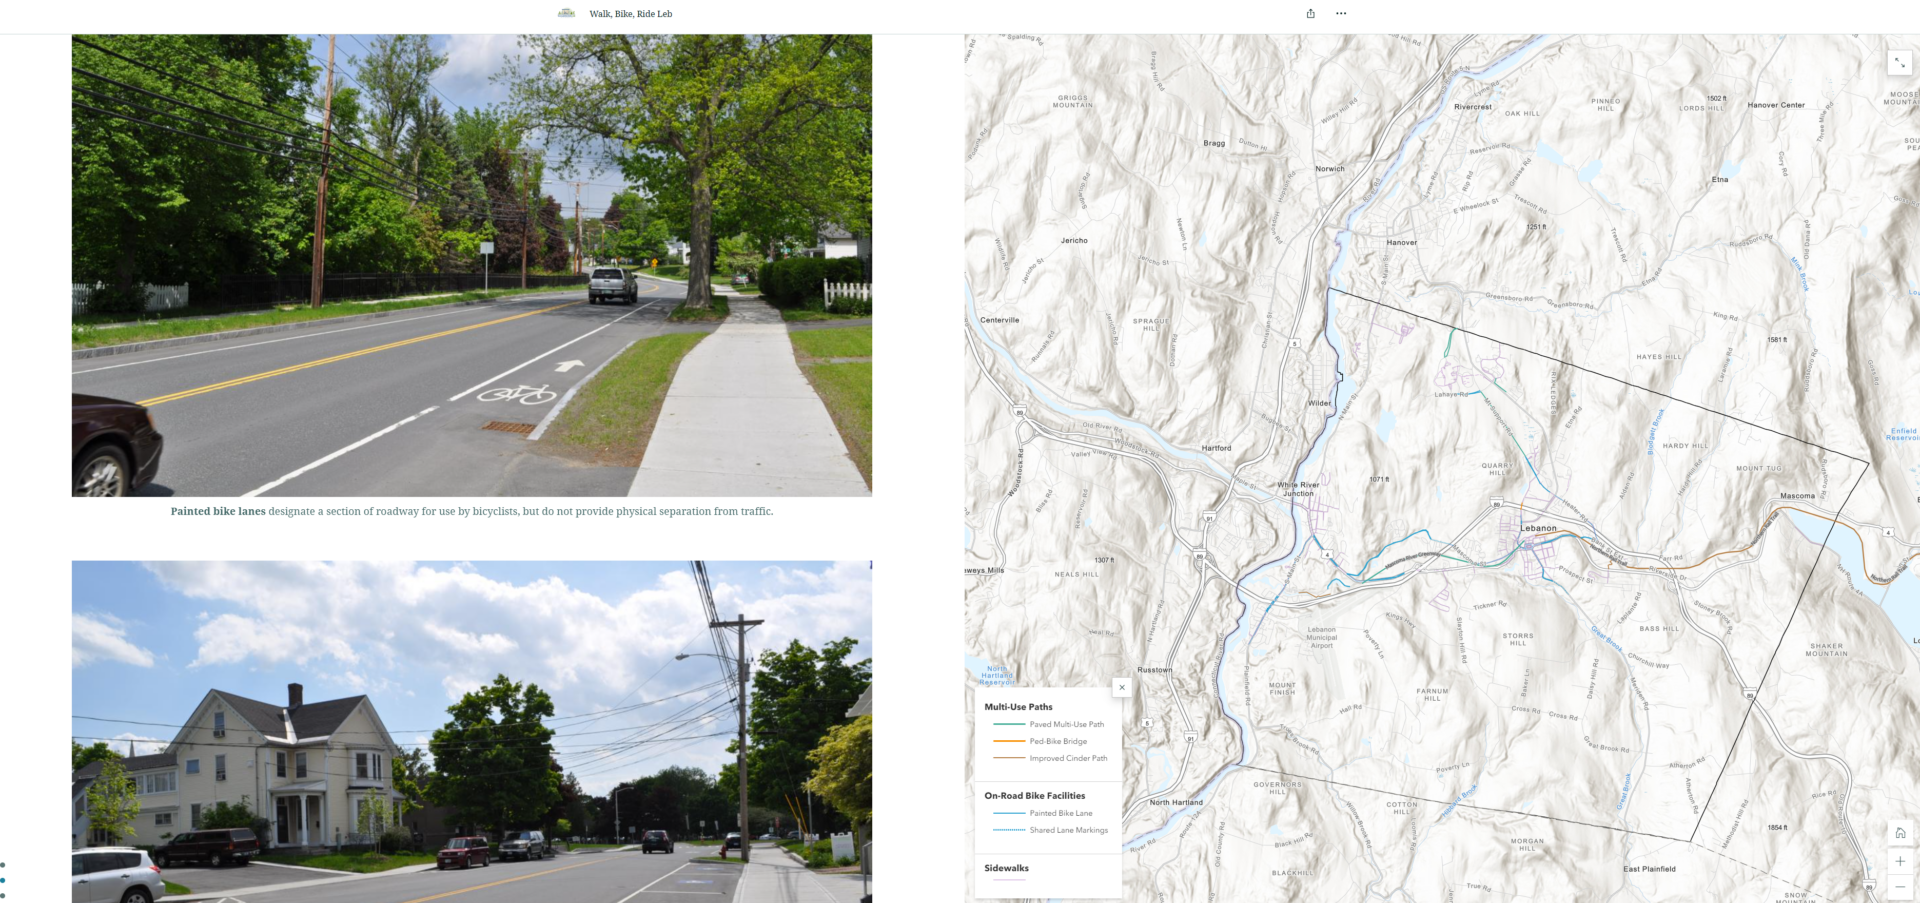
Excerpt from project StoryMap showing photos and a map of existing bike infrastructure.
We highly recommend checking out the interactive StoryMap to see the full effect – it methodically goes through every project stage to tell the complete story from the beginning to present time, as the project team is currently working on a final active transportation plan, informed by the survey.
Anatomy of an Active Transportation Survey: Brief and Specific
The Walk, Bike, Ride, Leb Survey followed a very structured and straightforward approach to gathering input. The survey was split into an upfront survey section that gathered overall impressions on walking and biking in Lebanon. Then, the latter half gathered input on proposed projects and allowed participants to provide map-based input on additional improvements they would like to see.
Try out the demo version survey for yourself here!
Rather than go into detail on every survey Screen, we want to highlight several key components that contributed to the survey’s success:
Simple and Direct Welcome Screen
As we always say, the Welcome Screen sets the tone of the survey. In this case, participants could see that the survey was intended to be brief since they noted: “This survey will take less than 10 minutes to complete”. The text content is to-the-point yet clearly explains the purpose of the survey. They also confirm that all responses are anonymous.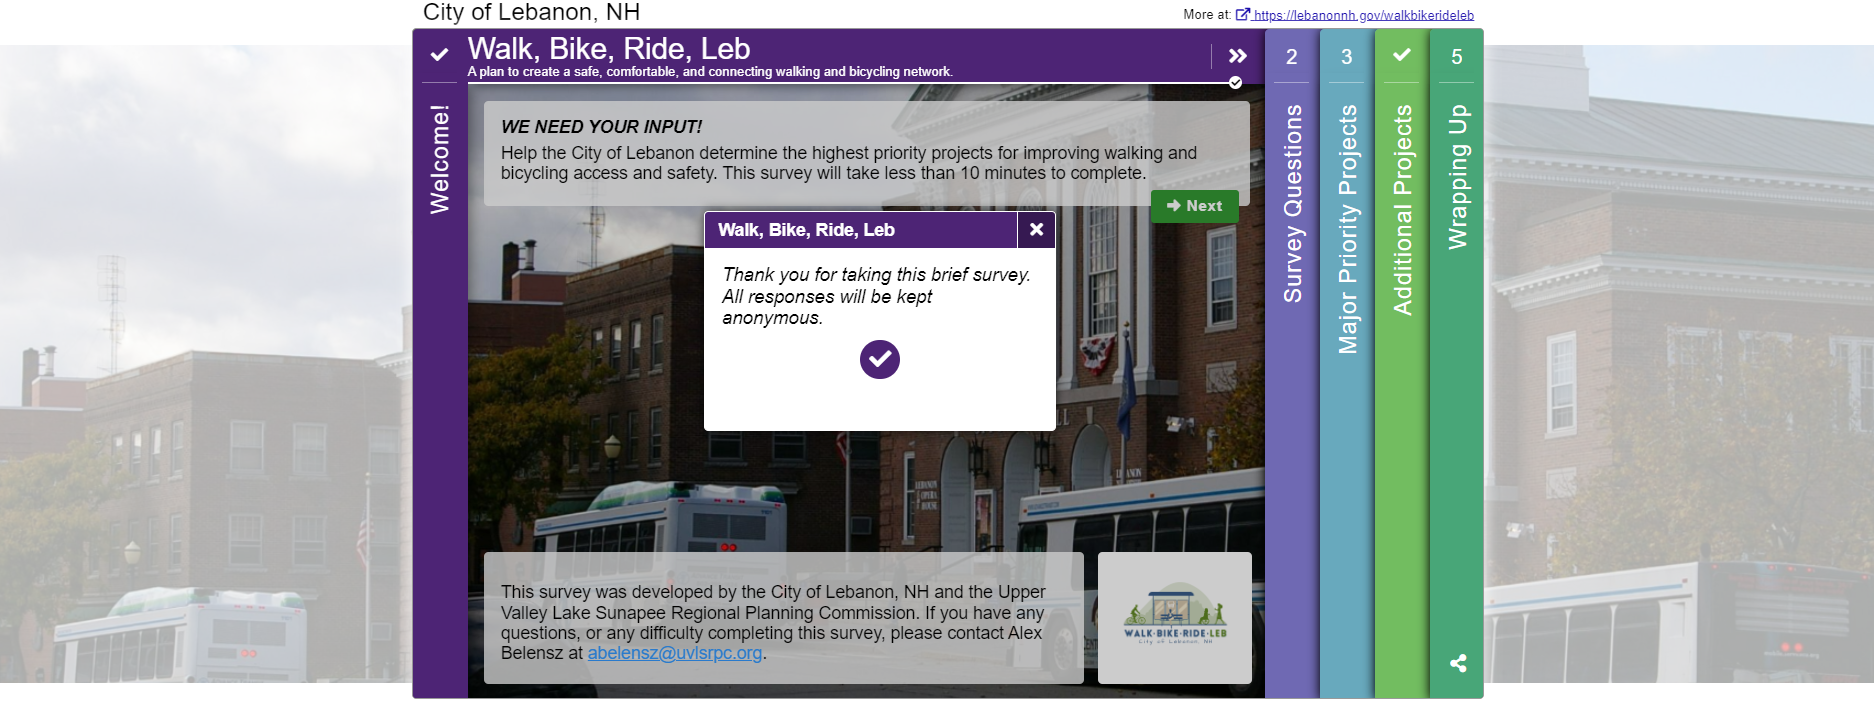
Moreover, it’s advantageous to include a project member’s email or project email, as was done here, so participants know who to contact if they need assistance or have questions.
Overall, this simple Welcome Screen exemplifies what we like to see, concise yet with a specific ask!
Quick, Quantitative Questions
Utilizing MetroQuest’s Standard Survey and Priority Ranking Screens, the majority of the survey gathered feedback through quantitative ranking, checkbox, and multiple-choice questions. The benefit here is twofold; questions are quick to respond to and provide quantifiable data.
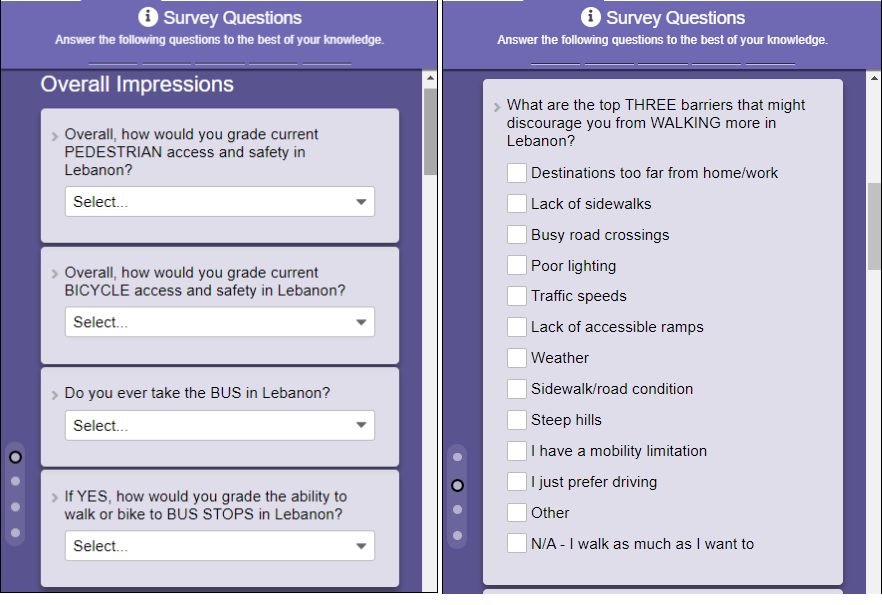
The team was able to dive deep into each respondent’s overall impressions of pedestrian and bicycling access and safety in Lebanon, as well as what they think are the top barriers for those who may otherwise walk or bike to destinations. They also incorporated questions about accessibility and key priority issues to address.
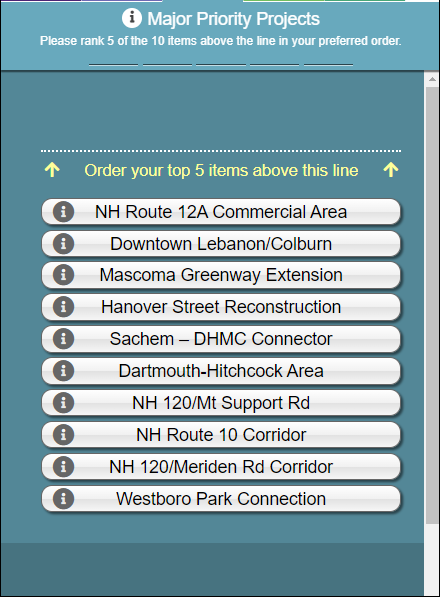
Following these simple survey questions, the Priority Ranking Screen asked participants to rank their top five of ten priority projects that they wish to see completed.
An Opportunity for Additional Map Input
Given the Priority Ranking Screen focused on ranking proposed projects, it made sense for the team to offer participants an opportunity to provide recommendations on other infrastructure they want to see improved. The Map Marker Screen was an excellent format for this input type and eliminated any uncertainty about the recommended location.
We like how the team utilized this as the fourth Screen; it’s usually best to work up to this more detailed map exercise rather than start with it upfront.
Short Wrap-Up Screen
It can be tempting to ask many questions on the final Screen, but when done right, the final Screen is best left short and sweet. This time, the team asked four simple questions to gather just enough about who they heard from:
Sharing the Results Using a GIS Dashboard
As is evident with the survey design, it gathered a great deal of data to inform the future plan. Nearly 10,000 individual data points were gathered, including over 770 individual map markers dropped on Screen four.
To share the findings with the community, the project team developed an online survey results dashboard utilizing GIS software. This interactive dashboard presented graphs and map-based data, instantly allowing the community to see the high-level survey results and dive into detailed map data.
Additionally, the project team developed a one-page executive summary of the survey results, which concluded:
“Our survey illuminated safety and accessibility concerns around pedestrian and bicycle mobility in Lebanon. The survey provided many insights into the types of investments the City should be making to improve community needs.”
We are always happy to see projects where the team takes the time to share feedback with the community; presenting it in an interactive, engaging way takes it one step further.
Stay tuned! MetroQuest will soon be releasing a survey insights dashboard which will allow you to create a customized page of your survey data graphs and findings. We look forward to sharing more on this soon with MetroQuest users as it comes to fruition!
5 Tips from the Walk, Bike, Ride, Leb Survey: Quick Surveying and Effective Reporting
As detailed above, this survey was particularly successful thanks to its short and straightforward approach. The questions were relevant and helpful for the project but also kept at a minimum to not require too much time.
To wrap up, here are a few quick tips to keep in mind for your next project:
- Find an interactive and visual way to communicate the project story: We always recommend a project website to house your survey; the more visual, the better! Utilizing infographics, interactive elements, and eye-catching visuals will result in more people taking the time to study the information.
- Utilize consistent project and survey branding: Between your project website, survey, promotional materials, and any public meeting materials, having a consistent project brand adds to the legitimacy of your effort. Also, it allows stakeholders to familiarize themselves with your project.
- Communicate about the length of your survey: Have a colleague or friend take your survey and get a sense of how long it takes, ideally under 10 minutes. Communicating this upfront can lessen any visitor concerns about the survey taking a long time.
- Keep your “asks” brief: Following the above point, keep your survey language concise and questions limited. There are endless things you COULD ask, ask what you NEED to know.
- Utilize interactive graphics and maps to share your data: Decide how you will share your survey data, and where possible, utilize engaging graphics to communicate the results visually. We recommend taking a deeper look at how the project information and results were shared as this team took a very interactive approach. We also can’t wait to unveil our future survey insights dashboard, which will provide an interactive overview of your survey at a glance!
Thank you to the UVLSRPC team and to all that took the opportunity to participate in this survey. Surveys like this provide valuable information which is helpful to regional and state transportation planning initiatives.
I thoroughly enjoyed learning about this initiative and hope you did too!
For more great tips on how to make the most out of MetroQuest, reach out for more information, or, if you are an existing subscriber, contact our Manager of Client Services Team, Woo-Ree Cho.
Join us at our upcoming webinar!
Phase-by-Phase: Unbundling MnDOT’s Winning Virtual Public Engagement Strategy