[SURVEY OF THE MONTH] Identifying Transportation Needs in Ashe County, NC
The Survey of the Month series is a monthly blog where we highlight the extraordinary work our customers are doing! We feature well-designed surveys and share takeaways that are relevant for anyone interested in making the most out of online engagement using MetroQuest’s survey platform. To see more in the series, visit the blogs here.
What’s the story? Organizations Working Together to Engage Ashe County Residents and Road Users
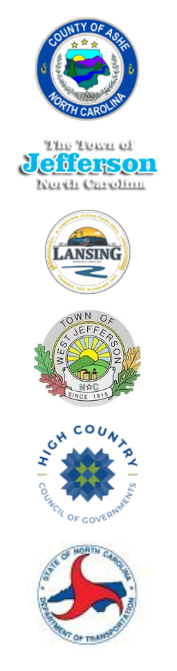
Logos of all six organizations involved in the survey.
This month, we feature a survey developed jointly by the North Carolina Department of Transportation (NCDOT), one of our longest subscribers, along with Ashe County and High Country Council of Governments (HCCOG). This survey was truly a team effort and an excellent example of statewide and regional organizations working together to plan for future transportation needs.
Ashe County is a mountainous region in northwest North Carolina, along the border of Tennessee and Virginia. The centrally located town, West Jefferson, is located about 113 miles northwest of Charlotte, NC and the area is well-serviced by four major highways.
Comprehensive Transportation Plans, CTPs, are a form of long-range transportation plans. They seek to identify transportation needs and subsequent solutions to address those needs. Input may be gathered at a regional level but often informs statewide planning decisions.
Anatomy of a Comprehensive Transportation Plan Survey: Seeking Feedback on All Things Transportation
Like many CTPs, the Ashe County survey sought a wide range of feedback on everything from vehicle use and public transportation to bicycle and pedestrian movement. The project team successfully engaged over 570 people on the survey that remained open from May 11 to June 30, 2022.
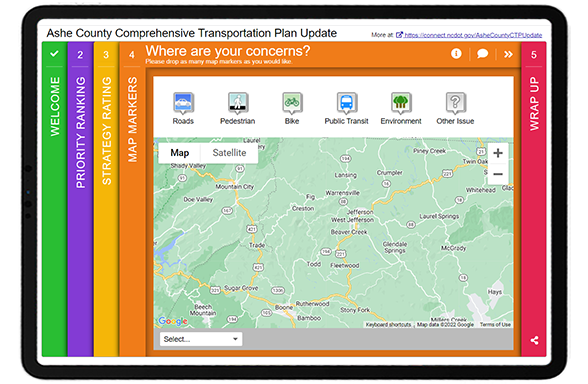
The survey followed a straightforward and logical layout, starting with an inviting and informative Welcome Screen. You may notice a pattern here with surveys starting with a Priority Ranking Screen, and there is a good reason for that! It is a very effective exercise to gather clear and actionable data, which also acts as a simple introductory activity. Then, a Strategy Rating Screen was utilized to gather ratings on 16 statements, and finally, a Map Marker Screen allowed participants to provide location-specific data. As with all MetroQuest surveys, demographic questions are asked on the final Wrap Up Screen.
We’ll focus on each Screen and highlight some key takeaways for your next survey!
Screen 1: Welcome
Similar to our example from last month, bright colors instantly draw you into the survey! They also subconsciously communicate to participants that this will not be another “boring” transportation survey. A wealth of information is shared on this upfront Screen, yet the format ensures it does not appear as a wall of text. The team relayed some key details here, including:
- Who is conducting the plan/survey
- What a CTP is
- How input will be considered
- The CTP vision statement
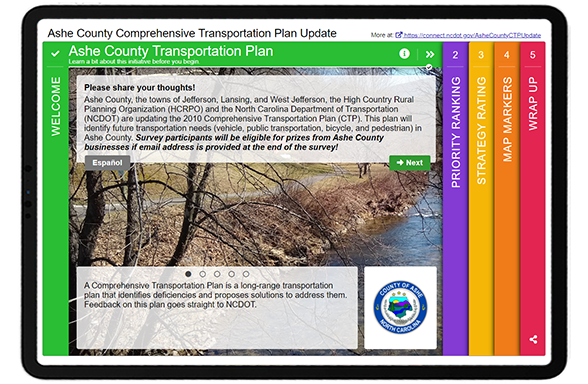
They also note that those who complete the survey will be eligible for prizes from businesses in Ashe County. When considering a contest for participants, we always recommend offering local prizes, as was done here. When you offer a prize that can be spent from anywhere, such as an Amazon gift card, you increase the risk of ballot box stuffing or bots taking your survey multiple times to win the prize. By keeping your prize as something that can only be useful to someone living in the project area, your risk of ballot box stuffing remains low.
Notice this Screen also offers a link to the Spanish version of the survey.
Screen 2: Priority Ranking
As noted above, the Priority Ranking Screen offers a great starting point for participants. In this case, they were asked to rank their top five of the following nine priorities as presented in the left image. Each priority is accompanied by an image and a concise yet informative statement, such as this one shown for the Quality of Life and Environment.
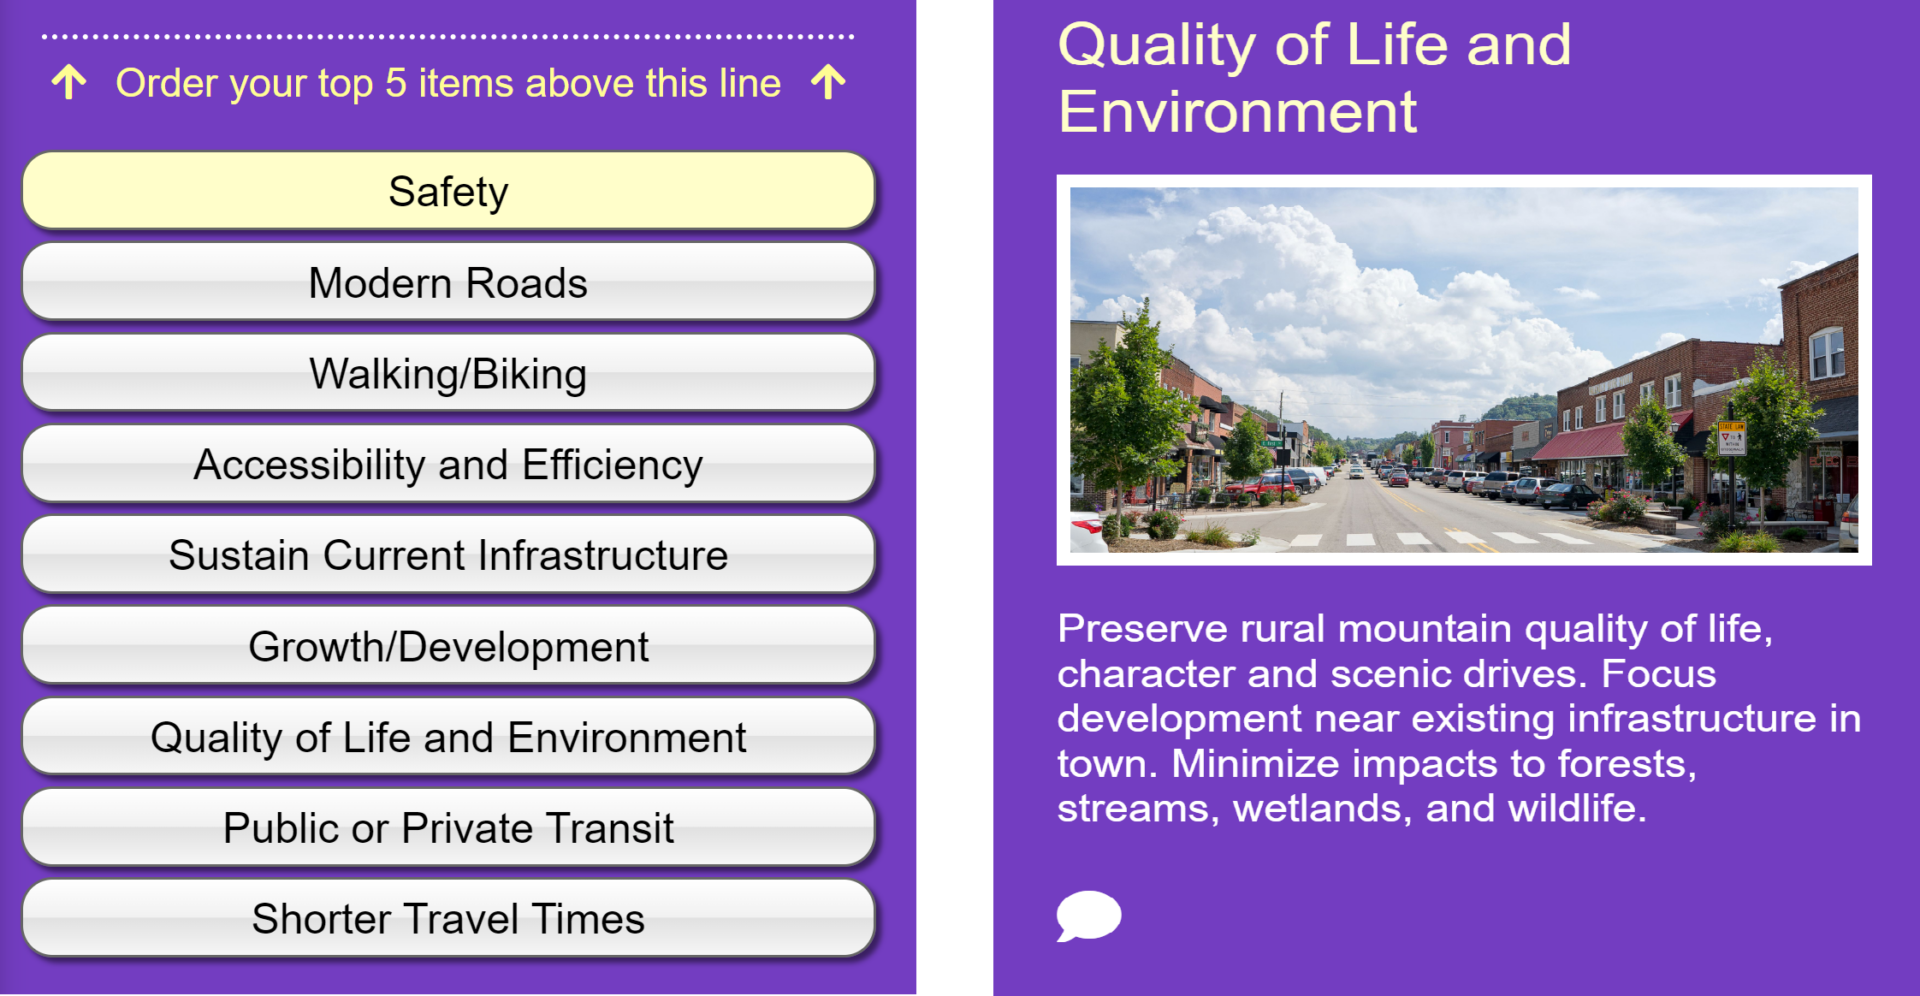
[LEFT] List of items to prioritize: safety, modern roads, walking/biking, accessibility and efficiency, sustain current infrastructure, growth/development, quality of live and environment, public or private transit, and shorter travel times.
[RIGHT] Screenshot of the content and description for the “quality of life and environment” priority.
Screen 3: Strategy Rating
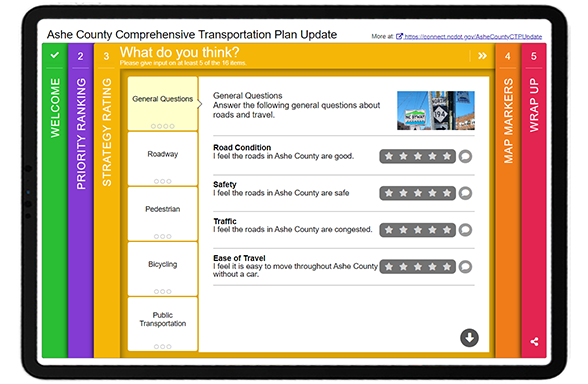
The Strategy Rating Screen is also one of our most popular activities! It allows you to gather a large volume of quantitative data efficiently. While it works well for strategies, it can also be used for general sentiment statements and gathering opinions on infrastructure options.
This survey gathered feedback on five main categories:
- General questions (e.g. overall road condition and congestion)
- Roadway (e.g. road improvements and widening)
- Pedestrian (e.g. more sidewalks and improved pedestrian connections)
- Bicycling (e.g. bike lanes and types of paths)
- Public Transportation (e.g. expanded use and transit vs. vehicle space)
* Tip – if you are considering the Strategy Rating Screen but want more of a visual focus, try out our Image Rating Screen. It’s a similar question format that allows for larger images.
Screen 4: Map Marker
Continuing with the same topic areas, the Map Marker Screen allowed participants to visually drop markers where they had experienced issues and explain what they encountered in more detail.
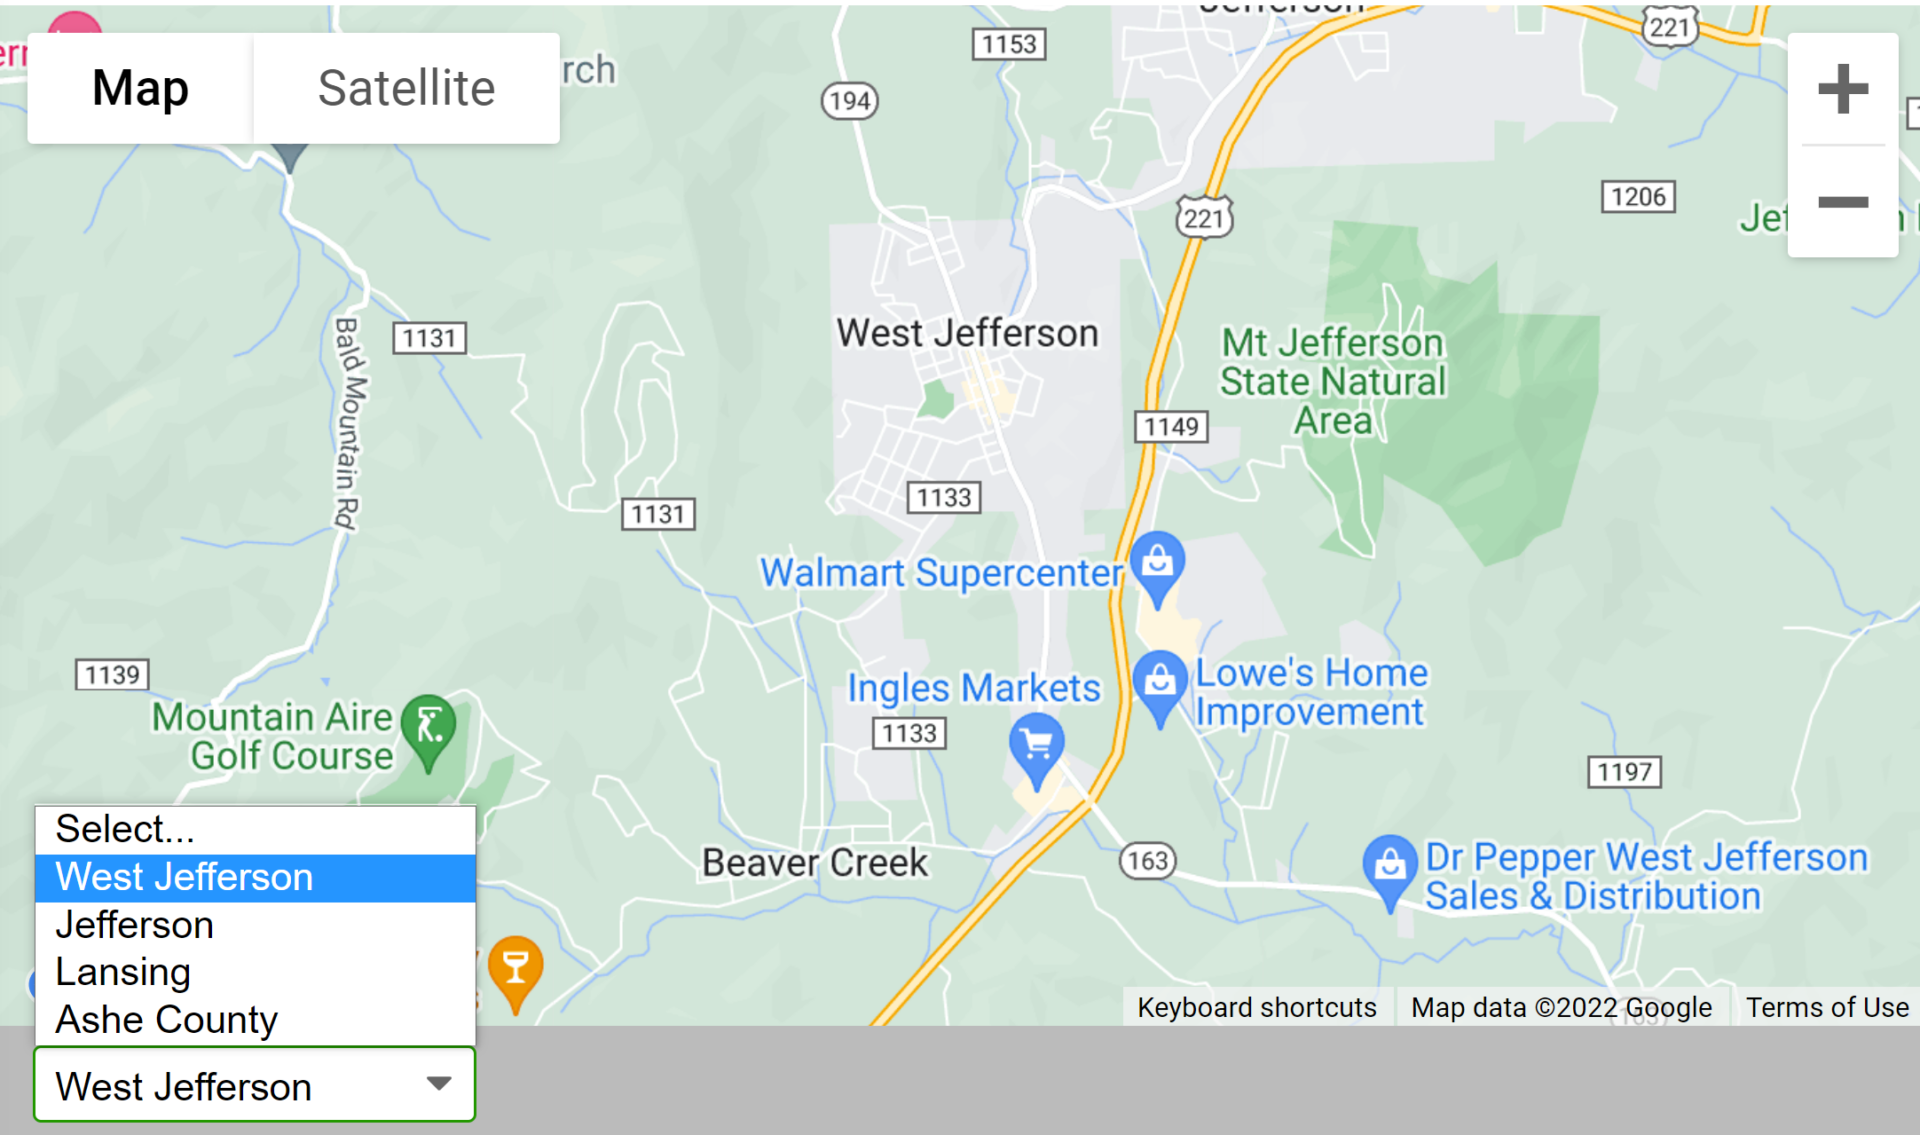 Additionally, since the project area encompassed several towns, they used the dropdown menu to allow participants to zoom into Ashe County, Jefferson, West Jefferson and Lansing. Anything you can do to make your survey faster to complete will pay off.
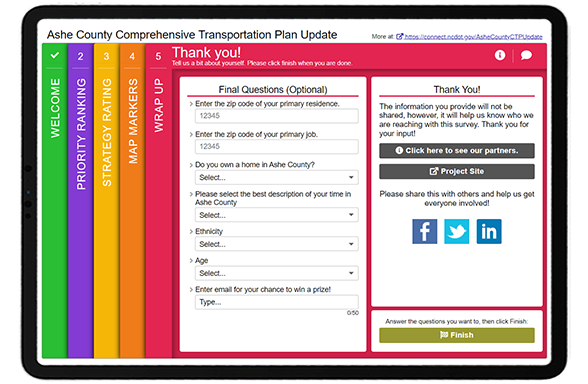
Screen 5: Wrap Up
To wrap things up, the final Screen asked a series of demographic questions. The team followed a number of best practices here, such as:
- Utilizing dropdown menus to gather quantifiable data and keep the format brief
- Listing ethnicities in alphabetical order
- Sticking to just six simple questions
Additionally, during our latest optimizing webinar, we highlighted our relatively new ZIP/postal code heat map feature. By asking participants to provide ZIP codes for their residence and job, the team could see trends between common commuter routes. Notice the difference in the two heat maps below:
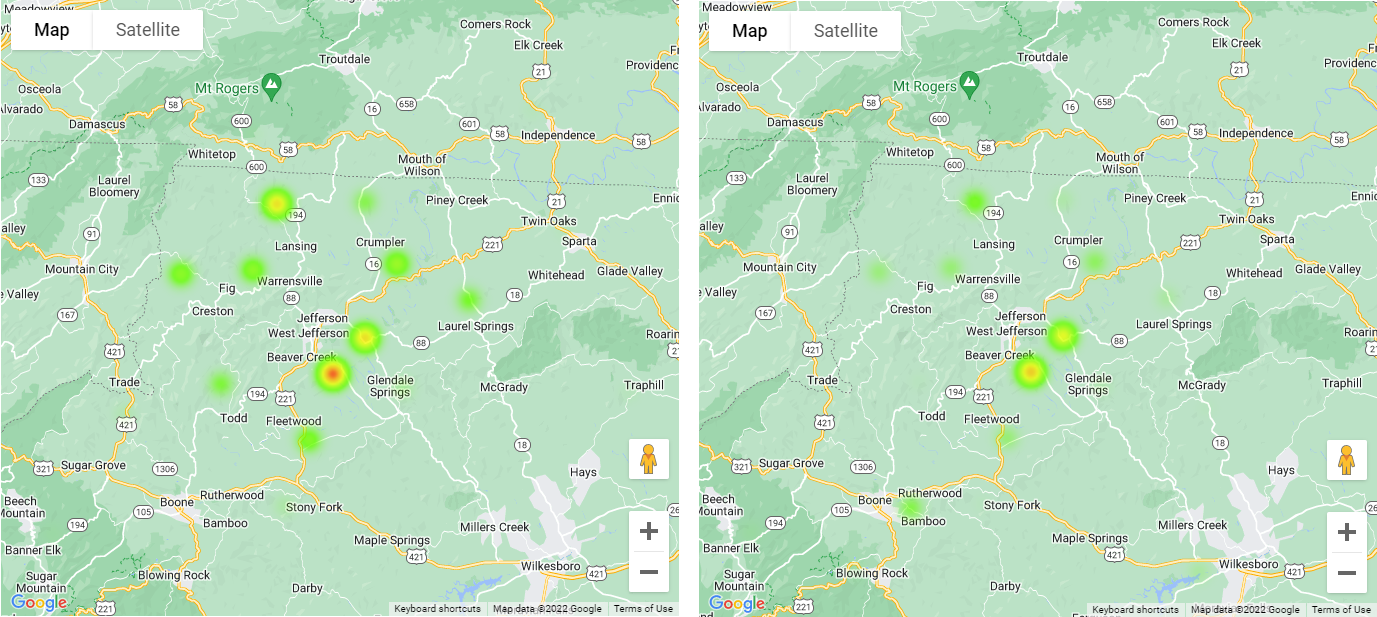
Residential ZIP codes are shown on the left and primary job ZIP codes on the right. Notice how they are similar, yet residents are more concentrated in Beaver Creek and more jobs appear near Boone.
5 Tips from the Ashe County CTP Update Survey:
- If you are offering an incentive, keep it local: As mentioned earlier, this survey included an option for participants to provide their email to be entered into a prize draw. The survey indicates that the prizes are local, reducing the likelihood of non-community members or bots completing the survey just for the prize.
- Consider bright and inviting colors: Whether you match your color palette to your branding or choose something bright and cheerful, consider that your survey colors often are the first thing that participants notice. The more they stand out, the more likely your survey will be taken. Keep in mind that surveys are often shared via a thumbnail image on social media, so the colors and Welcome Screen image have a big impact.
- Flow through content in a consistent sequence: You will notice when going through this survey that the topics remain the same throughout each Screen, but different activities and questions gather a variety of input. Surveys that are consistent and build on the same topic areas are often more successful. Consider that a survey may be your community’s first time learning about a particular topic, so you want to keep the content focused to avoid information overload.
- Ask for home and work ZIP codes: As shown above, the Wrap Up Screen included a place for respondents to provide both their primary home and work location ZIP codes. Coupled with our recent heat map feature for ZIP codes, you can easily see who you hear from and identify whether you need to target your promotion in certain underrepresented areas. Asking for both a home and work location also gives you a sense of common commuter activity.
- Order demographic options in alphabetical order: To ensure you are engaging equitably and fairly, always list race or ethnicity options in alphabetical order.
The NCDOT team and the various regional sub-organizations throughout the state create some excellent MetroQuest surveys. We thank them for the opportunity to highlight this excellent CTP update survey! Make sure to check it out yourself here.
For more great tips on how to make the most out of MetroQuest reach out for more information or, if you are an existing subscriber, contact our Vice President, Norma Hogan.
Check out our latest webinar where we discussed the most effective strategies for promoting and designing surveys that support diverse and equitable participation.

Optimizing Online Surveys for
Diverse and Equitable Public Engagement